
The Market Mosaic 4.12.26
The Great Bullish Reset: Do Stocks Have Room to Run?

👋Welcome back to The Market Mosaic, where I gauge the stock market’s next move by looking at macro, technicals, and market internals. I’ll also highlight trade ideas using this analysis.
If you find this report helpful please hit that “like” button, share this post, and become a subscriber if you haven’t already done so!
🚨And be sure to check out Mosaic Traders Hub. It’s a members-only platform to alert trade ideas, track a model portfolio of open positions, and further analyze the message coming from the capital markets.
Now for this week’s issue…
A two week ceasefire between the U.S. and Iran delivered the spark that ignited bullish conditions recently building across positioning and sentiment data.
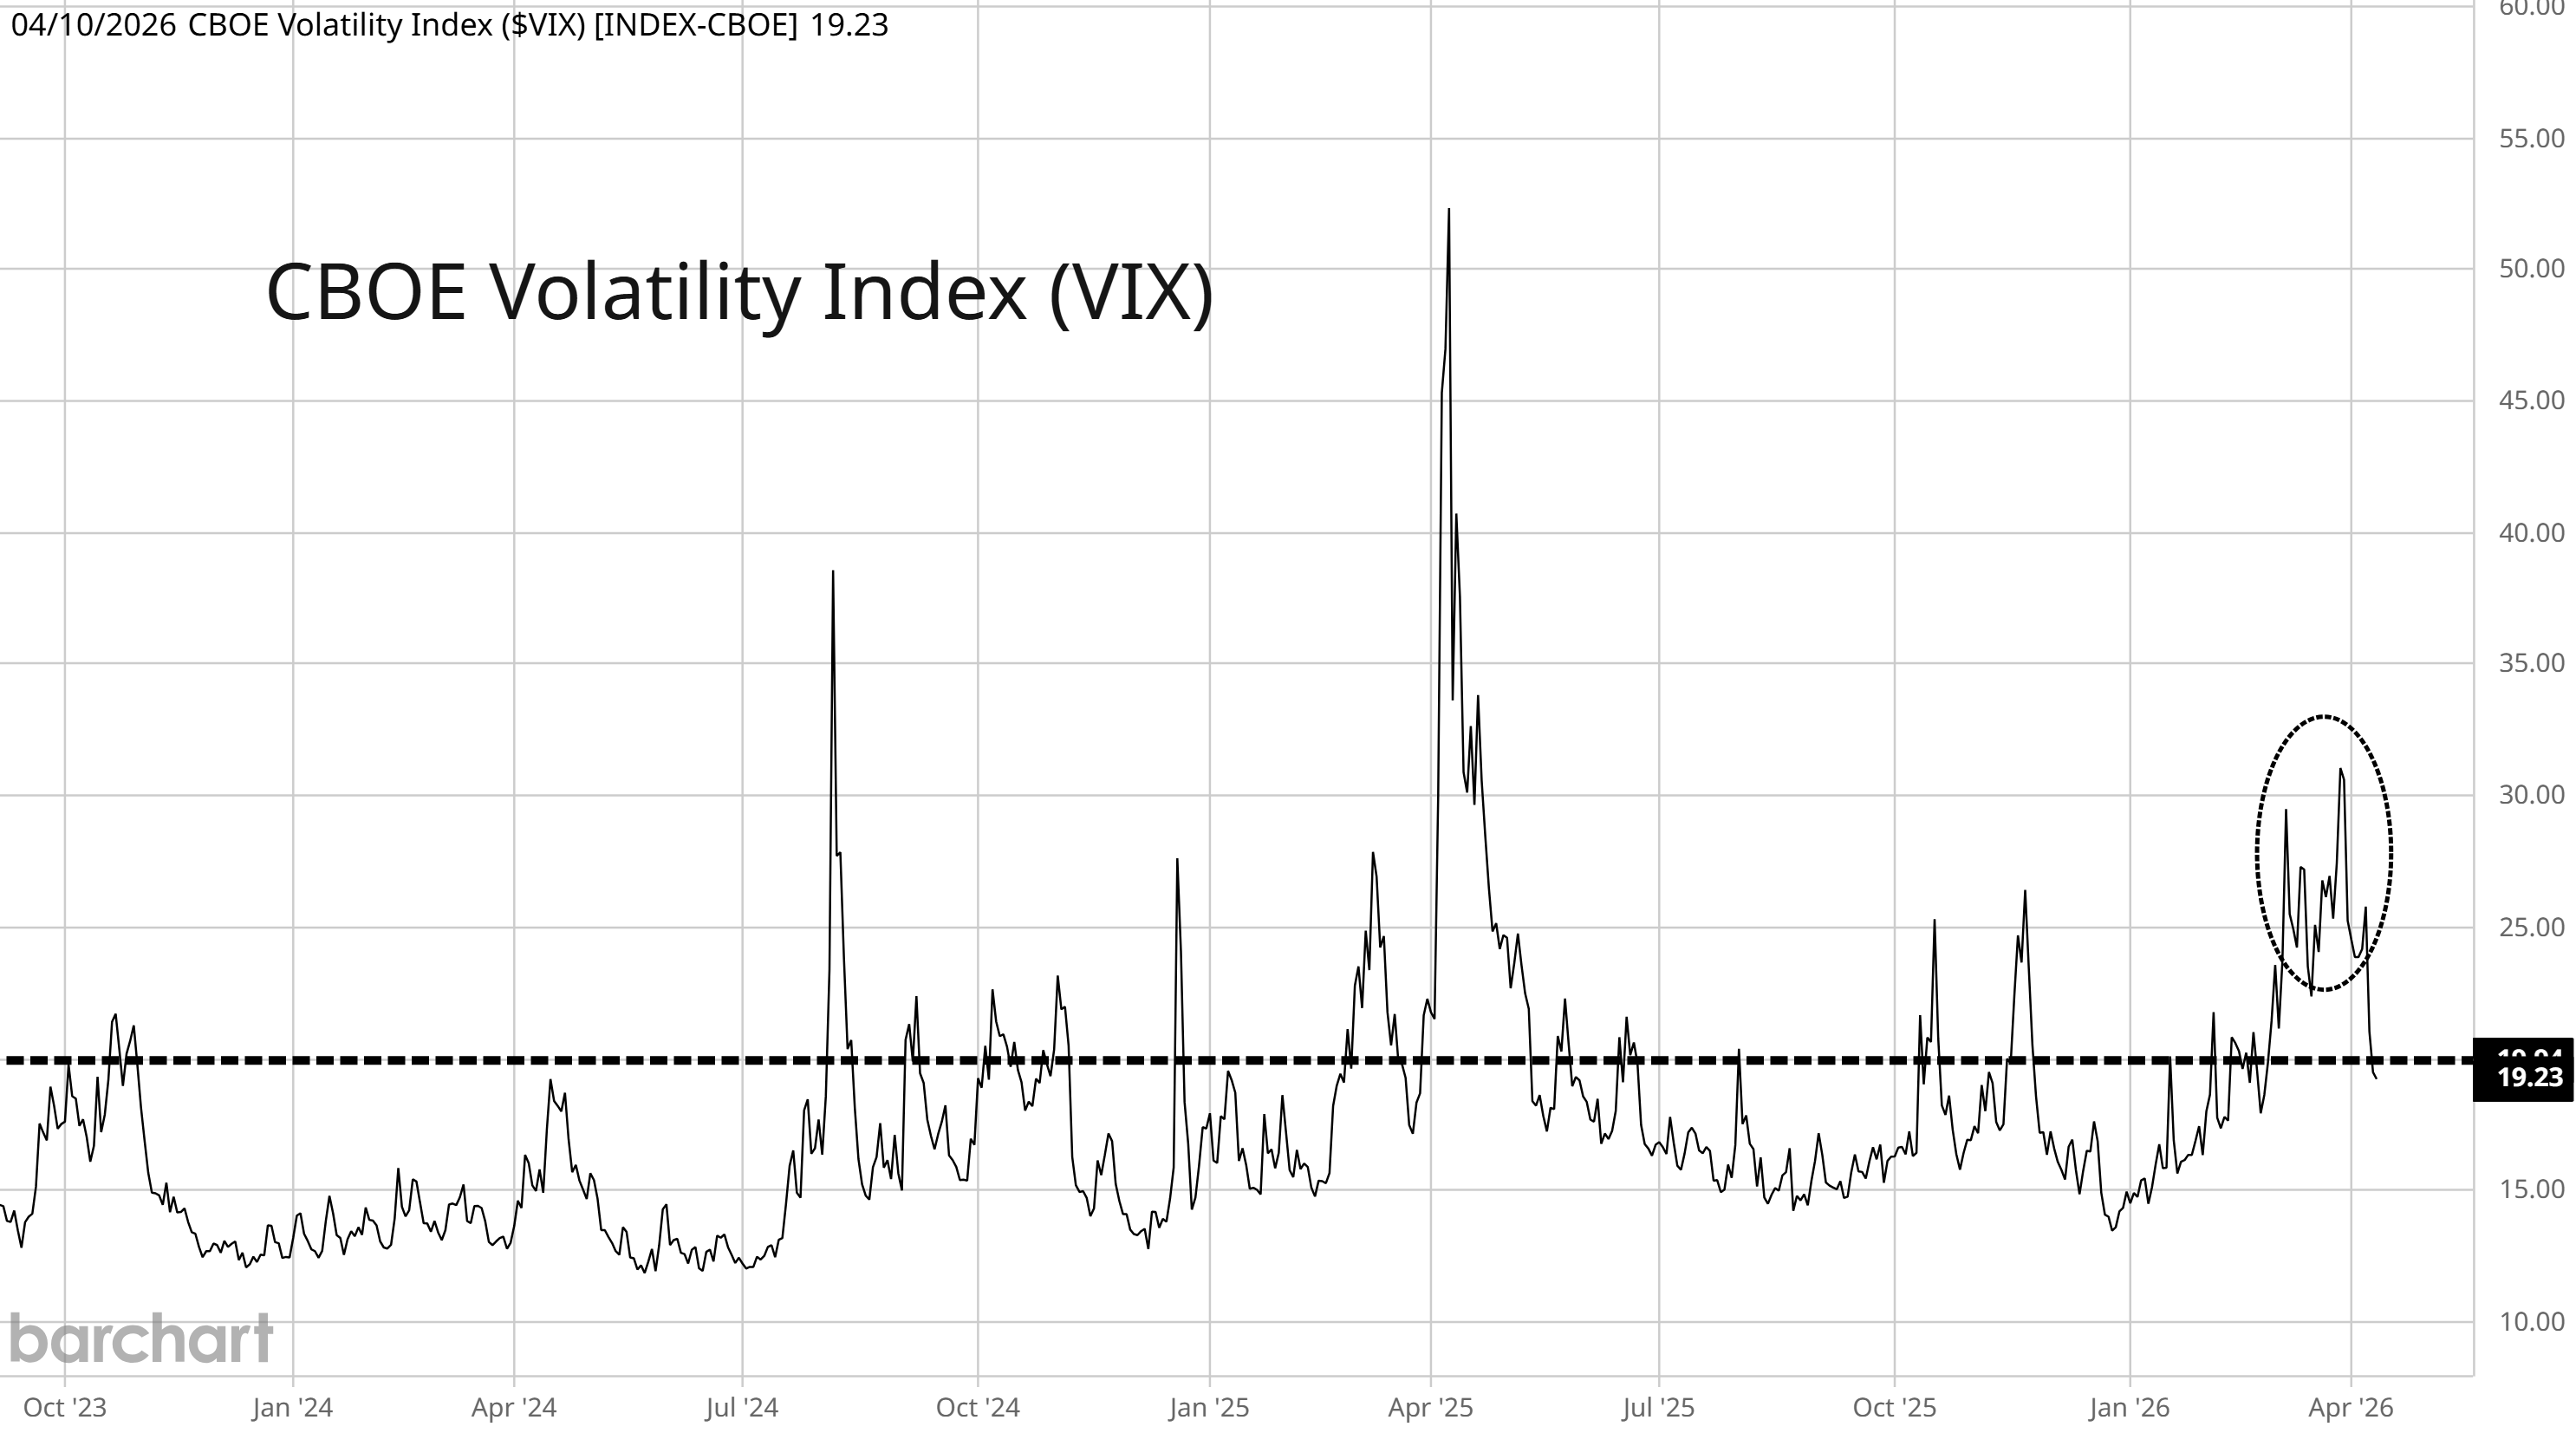
A combination of oversold breadth, positive divergences, and bearish sentiment and positioning provided the right ingredients to see a massive rally unfold. The drop in equity market volatility (VIX chart below) is creating a positive feedback loop to send equity prices higher.
The strong gains come on the one-year anniversary of another geopolitical shock driving uncertainty across the global economy. In early April 2025, the S&P 500 experienced a V-bottom following a pause on tariffs around the trade war.
While the circumstances around geopolitical volatility feels familiar, there are key differences between the rebound seen a year ago and what’s unfolding now, including much weaker participation.
This past week also delivered a reminder that inflation promises to become a bigger issue in the months ahead, with the Consumer Price Index (CPI) jumping to the highest level seen in two years.
While energy prices like oil have come off the highs following the ceasefire, prices remain well above levels before the conflict. There’s also the threat of higher food prices ahead due to the impact on fertilizer supplies from the Middle East conflict.
And although equities are rebounding, interest rate markets are hardly reversing the increase in yields seen following the outbreak of war, which is another factor that could limit the longer-term gains seen in stock prices.
This week, let’s look at key levers that could keep driving inflation higher in the months ahead, and how that’s impacting one key chart tracking interest rates. We’ll also look at bearish positioning by institutional investors, and why the unwind could support stocks over the near-term.
The Chart Report
While headlines coming out of the Middle East are capturing investor attention, a pair of consumer inflation reports released last week continues showing upward pressure on prices. The CPI for the month of March came in at 3.3% compared to last year, which was the biggest jump since early 2024. The Fed’s preferred measure is the Personal Consumption Expenditures (PCE) price index, which was released for the month of February. The core figure that removes food and energy prices increased 3.0% year-over-year, while more recent annualized rates over the past three- and six-months are accelerating higher (chart below). That shows inflation pressures outside of what’s expected following war in the Middle East and impact on energy prices.

The CPI inflation report for March is the first that captures the move in energy prices following the war with Iran. Gas prices jumped by 21.2% during the month, which is the largest gain in the history of the series going back to 1967. While investors are focused on energy’s impact to inflation looking ahead, more evidence is emerging on the impact of last year’s trade war on the price of goods. A study be researchers at the Fed shows the estimated impact of tariffs on core goods prices in the PCE price index. The chart below shows the published data (black line) compared to estimates excluding the impact of tariffs (blue line). While the economists behind the research estimate that the pass through impact of tariffs is complete, uncertainty on the inflation outlook now shifts to energy prices.

Investors should also monitor the impact of fertilizer shortages on food prices in the months ahead. The Middle East is a key producing region of ingredients used in farm fertilizers, which have also been impacted by tanker traffic through the Strait of Hormuz. Higher fertilizer prices has a direct impact on food prices, while fertilizer shortages could impact crop yields as well. Concerns on the impact have led President Trump to recently warn against price gouging by major fertilizer producers. The chart below overlays an index of food prices (black line) against an index of fertilizer prices (red line). You can see that rising fertilizer and food prices played a role during the last inflation wave into mid-2022, with fertilizer prices tracking higher once again.

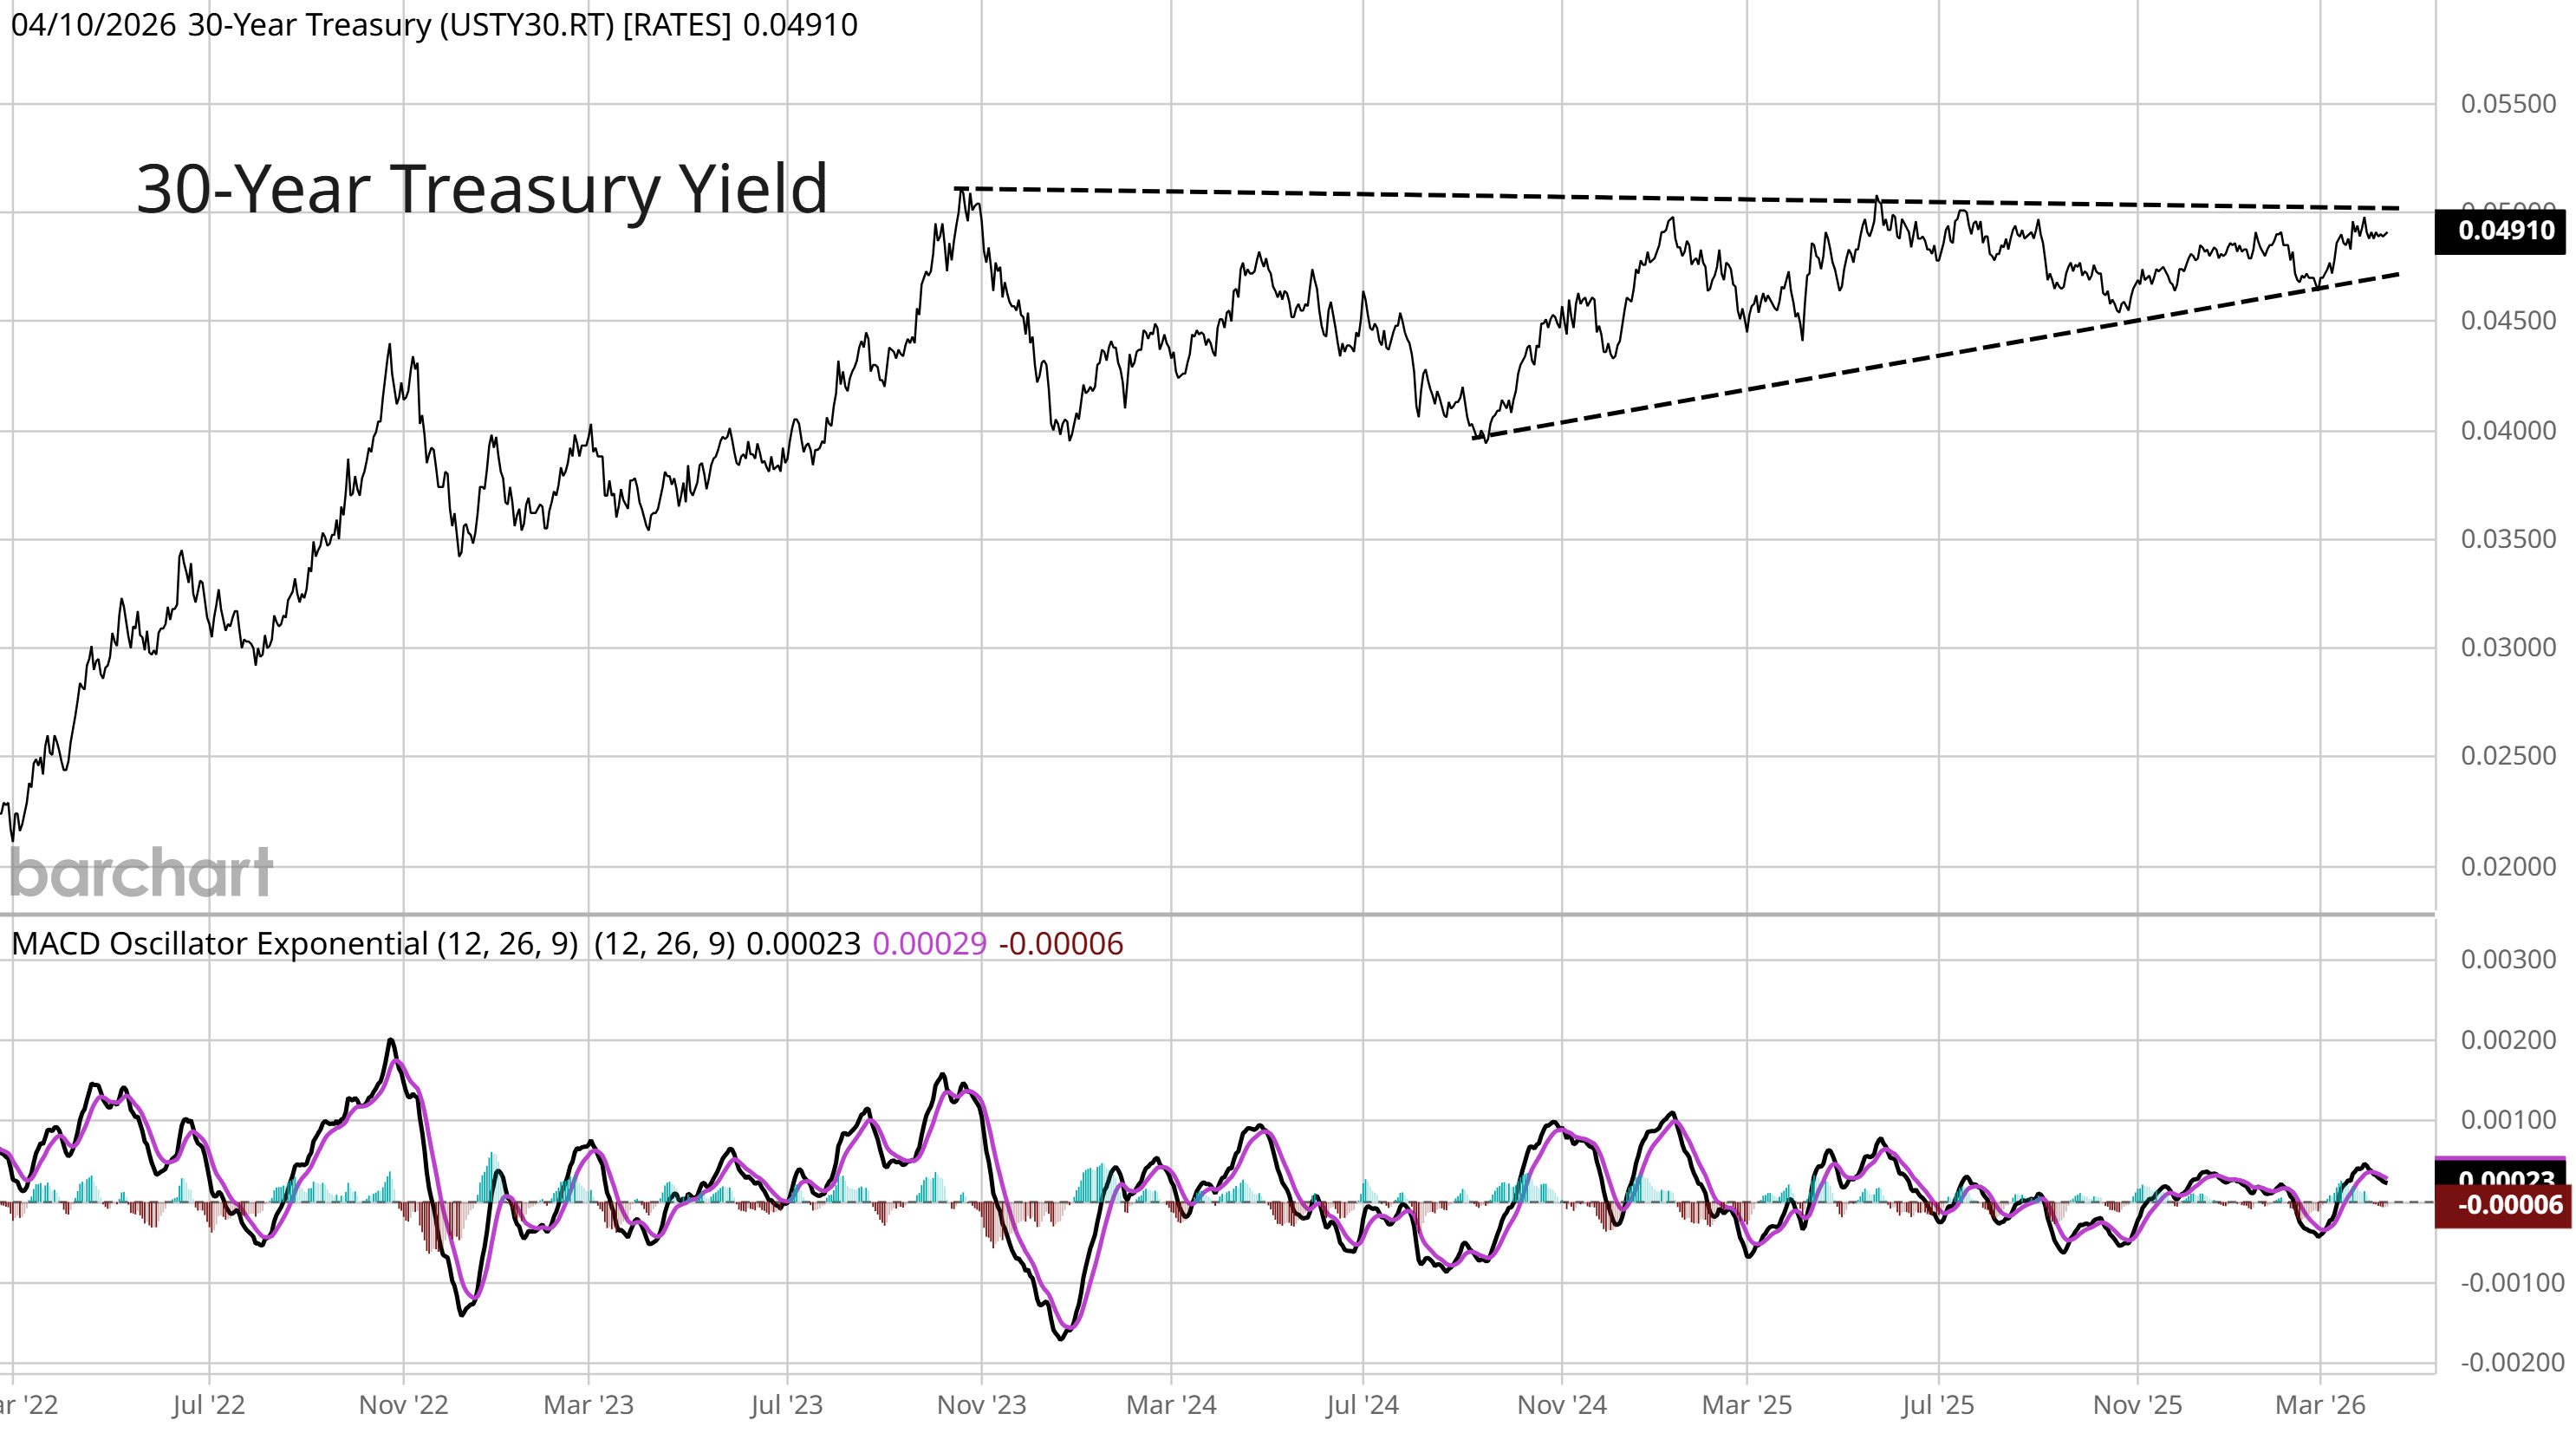
Uncertainty over the inflation outlook is having a major impact on interest rate markets. The 2-year Treasury yield crossed above the fed funds rate for the first time in 3 years, which could signal a pivot by the Fed to tighter monetary policy in the months ahead. On the longer end of the yield curve, the 30-year Treasury is close to a key breakout in the chart below. The 30-year is trading in an ascending triangle pattern since 2023 and is currently making a smaller pullback off the 5% resistance level. A breakout would put the 30-year at the highest level since 2007.
While the two week ceasefire between the U.S. and Iran is on fragile ground, that catalyst was enough to send stock prices soaring as bearish positioning was pushed to extremes. Positive breadth divergences were hinting at a turnaround over the last couple weeks, with an unwinding of massive short positions by institutional investors driving a buying spree. CTAs are systematic investors that incorporate variables like stock price momentum and volatility to drive equity exposure. Their exposure was recently pushed to negative extreme as you can see in the chart below, with the unwind underway still in the early stages. If market volatility remains contained, CTAs could be facing their second largest buy estimate on record over the coming week.

Heard in the Hub
The Traders Hub features live trade alerts, market update videos, and other educational content for members.
Here’s a quick recap of recent alerts, market updates, and educational posts:
The long-term risk from commodity prices.
The near-term opportunity brewing in stocks.
The market’s similarities to 2022’s bear market.
Why the traditional retirement portfolio could get rocked.
One stock about to see a massive acceleration in earnings.
You can follow everything we’re trading and tracking by becoming a member of the Traders Hub.
By becoming a member, you will unlock all market updates and trade alerts reserved exclusively for members.
Trade Idea
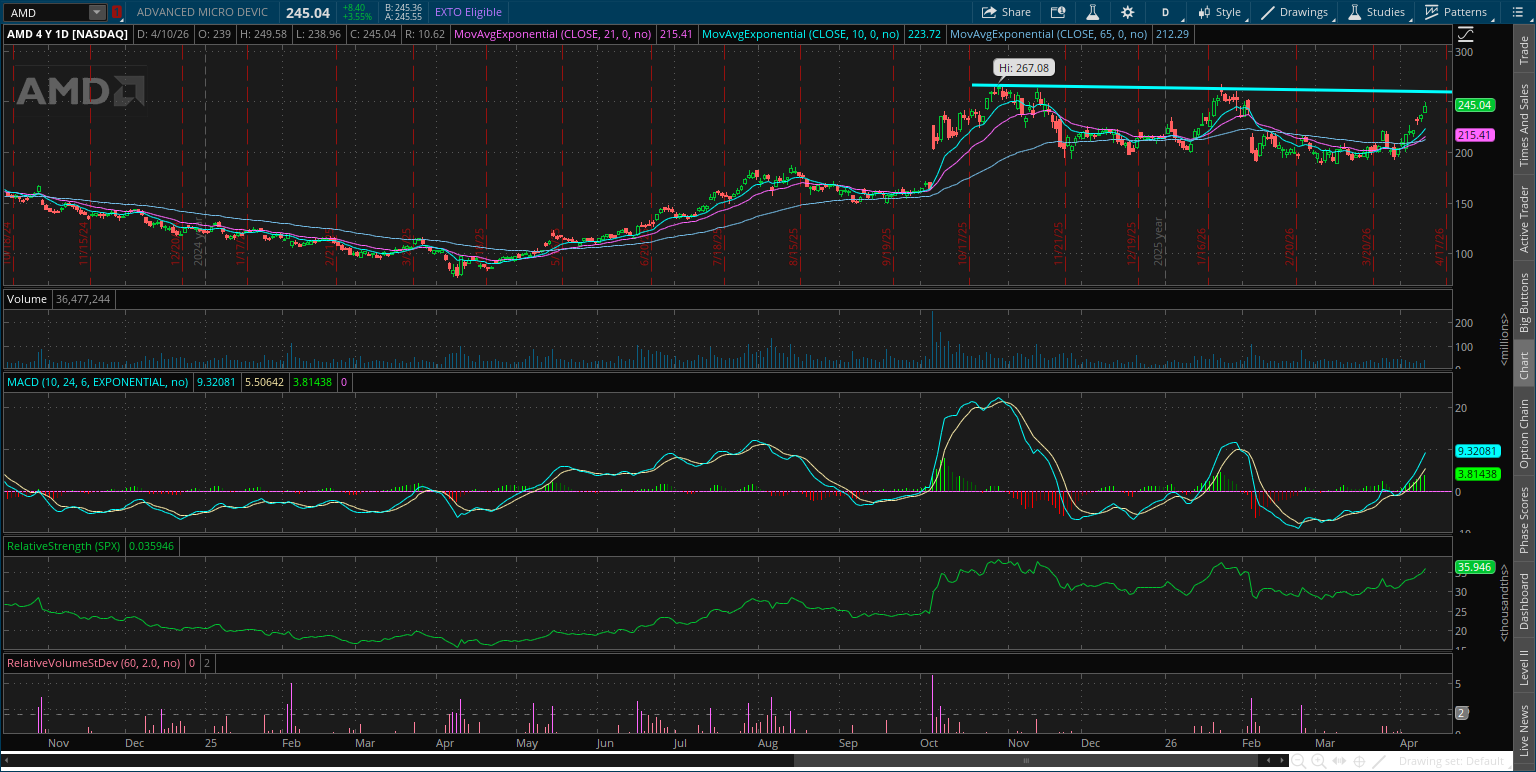
Advanced Micro Devices (AMD)
AMD is forming a new basing pattern after breaking above $200 in October. The stock is back testing that level as support several times while forming a new resistance level near $270. I’m watching for a breakout over $270.
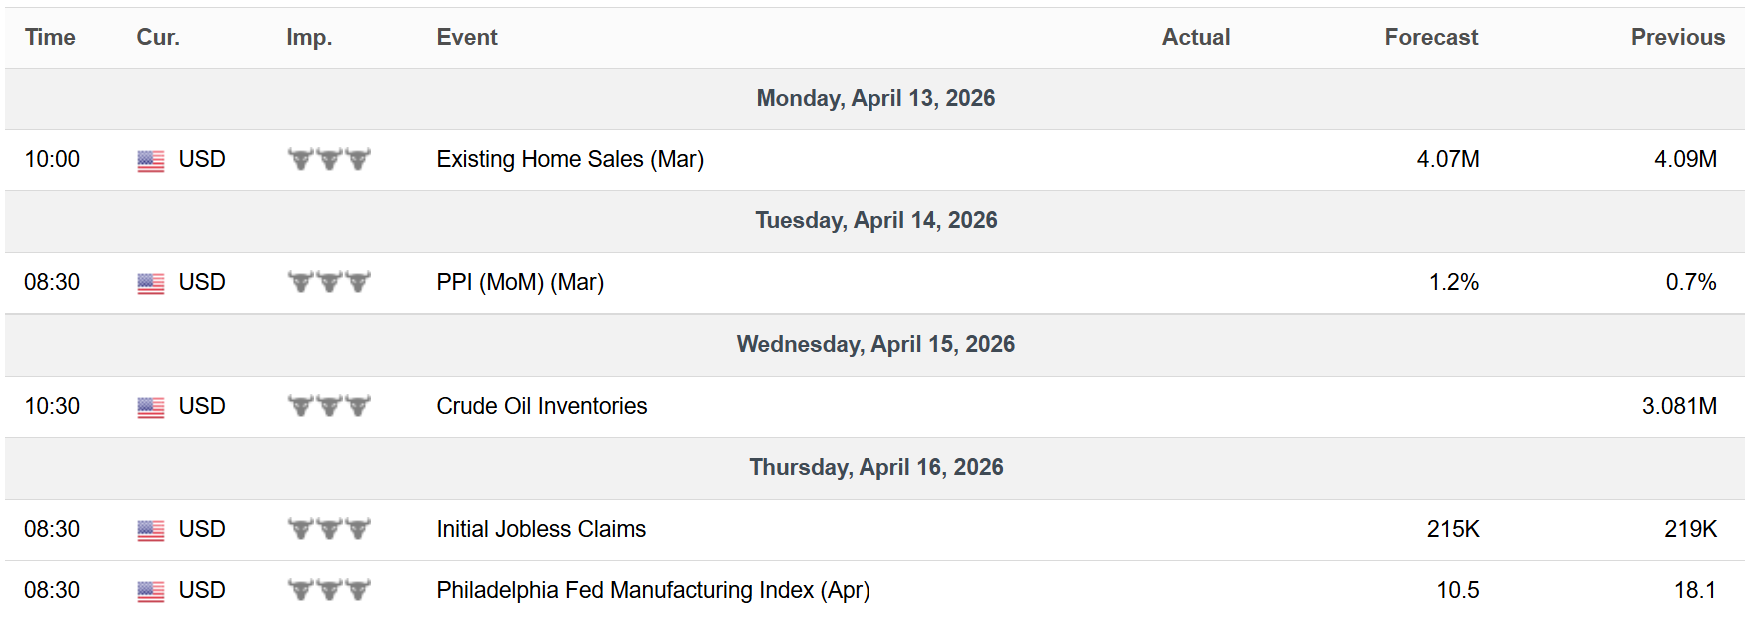
Key Upcoming Data
Economic Reports
Earnings Reports

I hope you’ve enjoyed The Market Mosaic, and please share this report with your family, friends, coworkers…or anyone that would benefit from an objective look at the stock market.
Become a member of the Traders Hub to unlock access to:
✅Model Portfolio
✅Members Only Chat
✅Trade Ideas & Live Alerts
✅Mosaic Vision Market Updates + More
Our model portfolio is built using a “core and explore” approach, including a Stock Trading Portfolio and ETF Investment Portfolio.
Come join us over at the Hub as we seek to capitalize on stocks and ETFs that are breaking out!
And if you have any questions or feedback, feel free to shoot me an email at mosaicassetco@gmail.com
Disclaimer: these are not recommendations and just my thoughts and opinions…do your own due diligence! I may hold a position in the securities mentioned in this report.