
The Market Mosaic 3.9.25
S&P 500: Signs of capitulation at a key support level.

👋Welcome back to The Market Mosaic, where I gauge the stock market’s next move by looking at macro, technicals, and market internals. I’ll also highlight trade ideas using this analysis.
If you find this content helpful please hit that “like” button, share this post, and become a subscriber if you haven’t already done so!
And be sure to check out Mosaic Traders Hub. It’s a members-only platform to alert trade ideas, track a model portfolio of open positions, and further analyze the message coming from the capital markets.
🚨You can start a 7-day free trial to the Hub by clicking here. By starting a trial, you will unlock all market updates and trade alerts reserved exclusively for members.
Now for this week’s issue…
Geopolitical uncertainty and weakening economic data has investors questioning the outlook for the economy and stock market.
President Trump pushed ahead with 25% tariffs on Canada and Mexico along with another 10% tariff on imports coming from China. Although delays were subsequently announced for many products coming from Canada and Mexico, tariffs on China now stand at 20%.
Several key economic releases are clouding the outlook as well. While the February payrolls report showed 151,000 new jobs during the month, it was below expectations. The household survey used to calculate the unemployment rate fell by 588,000, which caused the unemployment rate to rise to 4.1%.
And a new report on manufacturing activity from the ISM showed the key new orders component falling to 48.6 in February from 55.1 last month. New orders are a leading indicator of activity, where a reading below 50 points to contraction.

The growing uncertainty is leading to the largest pullback in the S&P 500 since last summer. The S&P is also testing a key support level for the first time since 2023. Technology and growth stocks are faring even worse, with the Nasdaq Composite entering correction territory.
But amidst investor concerns that the selloff is only the early stages, there are several signs of capitulation across the market that could point to a bottom and help see a rally unfold. Plus one key segment of the capital markets is not signaling concerns over the growth outlook.
This week, let’s look at factors pointing to extreme fear and bearish positioning in the stock market that can help support a bottom. I also want unpack charts sensitive to the economy and how the average stock is holding up year-to-date.
The Chart Report
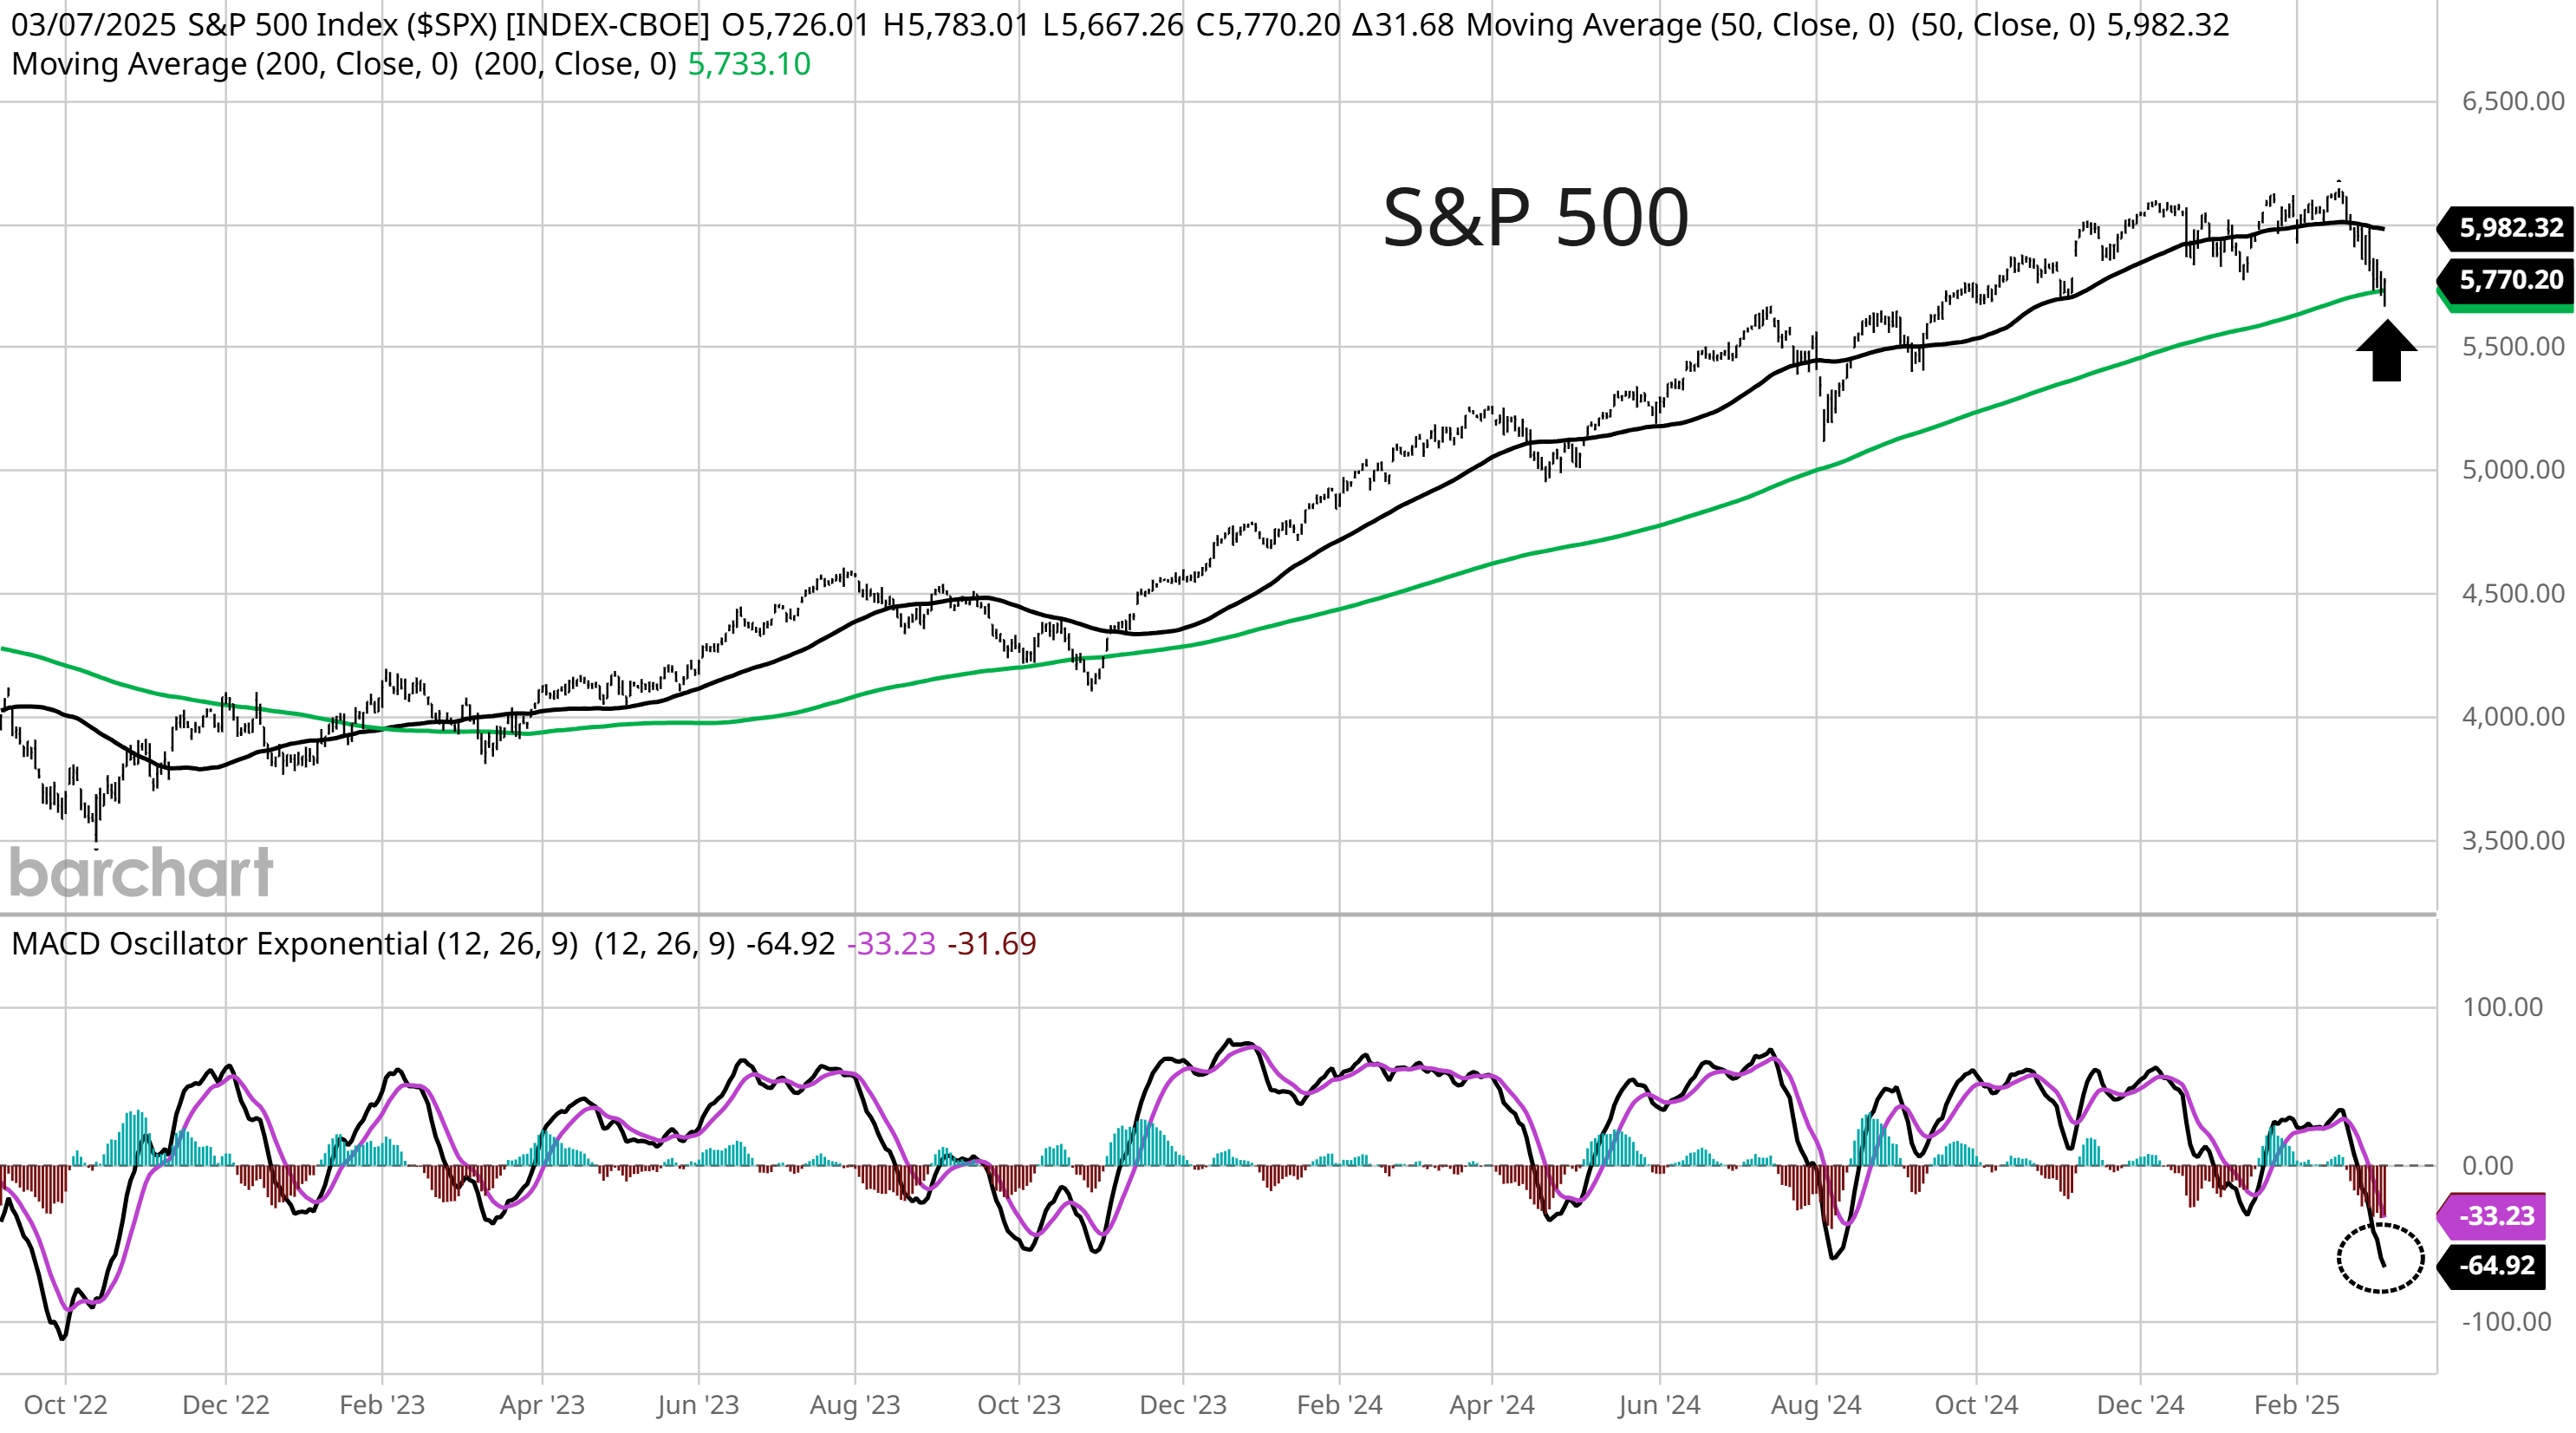
The pullback in the S&P 500 has the index down as much as 7% from the peak and testing a key support level for the first time since 2023. As you can see at the arrow in the chart below, the S&P is testing the 200-day moving average (MA - green line). It’s the first test of the 200-day MA since late 2023. At the same time the S&P is testing a key support level, gauges of momentum are getting stretched to the downside. The MACD compares the distance between a short- and long-term moving average. When a price trend goes too far in one direction, the short-term MA gets stretched far above or below the long-term MA. The MACD is hitting the lowest level (circled area) since this cyclical bull market began in October 2022.
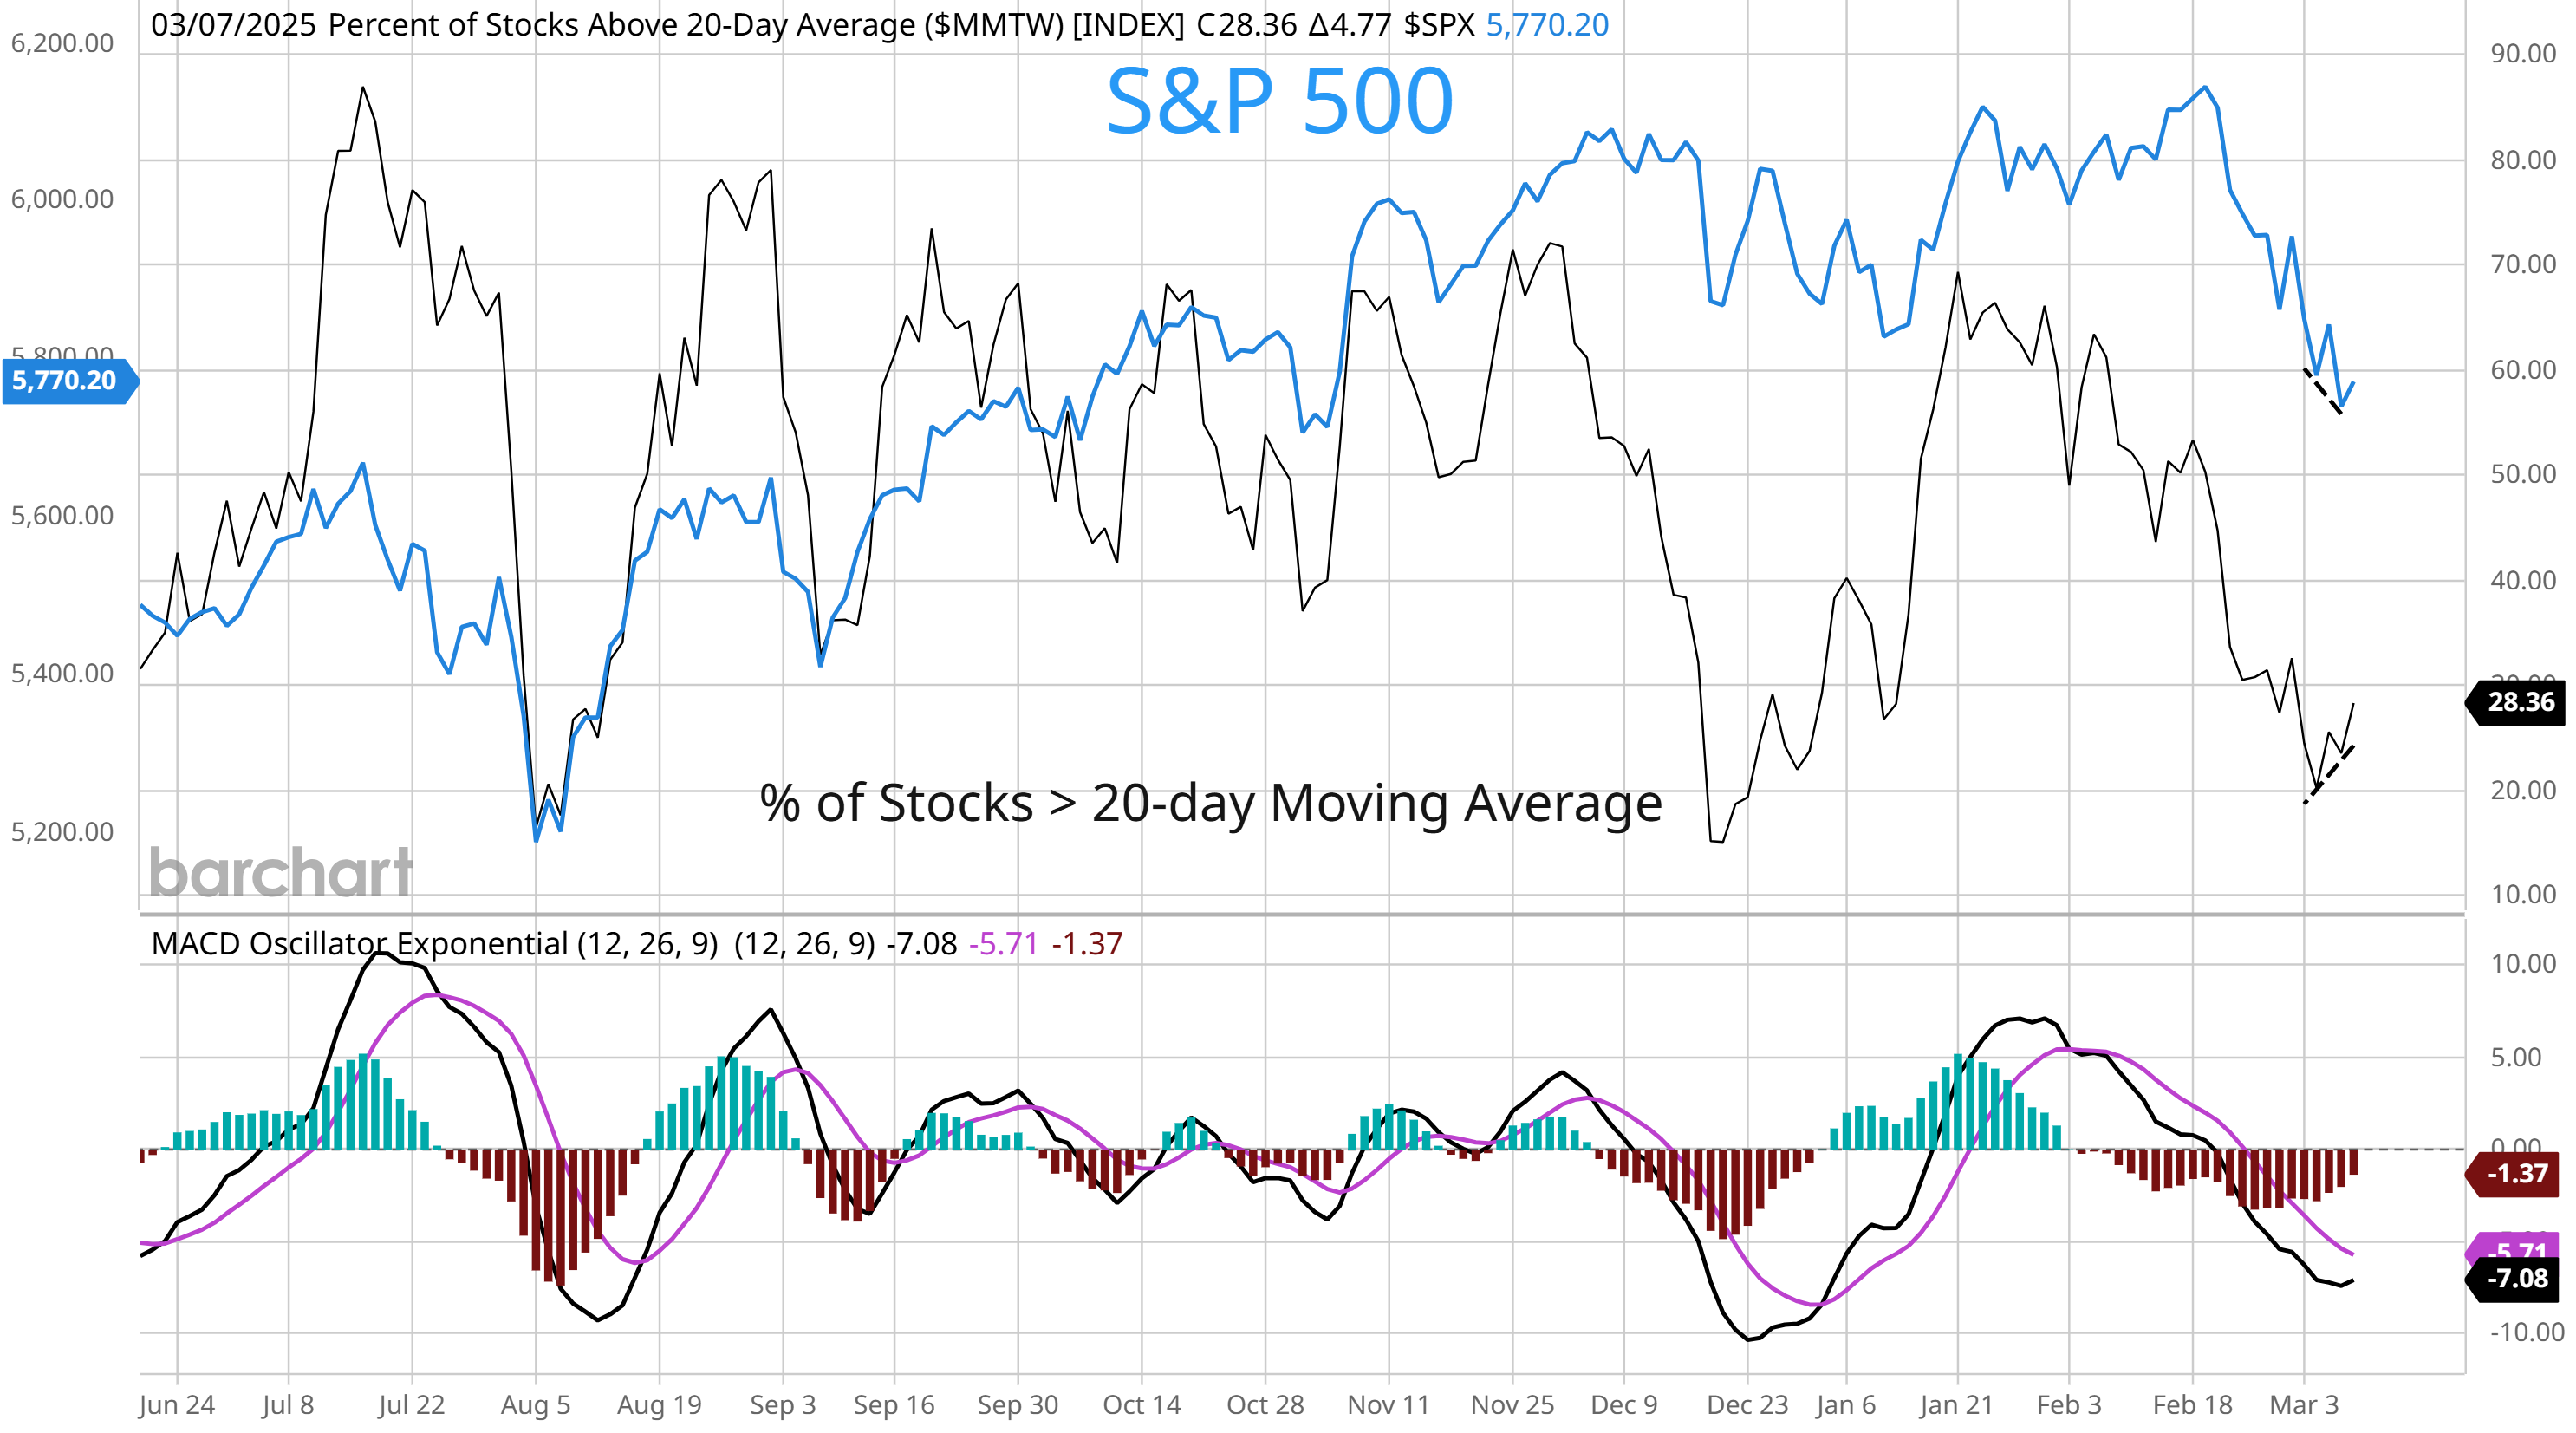
There are other signs that the stock market is hitting oversold levels with breadth metrics. The chart below shows the percentage of stocks across exchanges trading above their 20-day moving average. The number of stocks in short-term uptrends deteriorated as the S&P 500 hit a new high on February 19. But last week, this breadth metric hit 20% which historically is an extremely oversold level. Now there’s a positive divergence developing with the dashed trendlines. As the S&P 500 made a lower low last week, the percent of stocks above their 20-day MA made a higher low. It’s a modest positive, but carries more weight given the presence of other oversold conditions.
Signs of capitulation are emerging in volatility markets. That includes an indicator built off the CBOE Volatility Index (VIX) which tracks implied volatility on the S&P 500. The VIX jumped over 26 last week, which is the highest level seen so far this year. But that increase is inverting the futures curve tied to VIX contracts. The chart below shows the VIX futures term structure, which is normally upward sloping. When panic drives spot VIX levels above futures contracts expiring further out, the curve becomes inverted (or in backwardation). Historically that’s been a strong capitulation signal of at least a near-term bottom following a selloff.

Just as the S&P 500 made a new all-time high on February 19, poor historical seasonality delivered a headwind. The last two weeks of February is the worst two week stretch of the entire calendar year looking back for the S&P 500. But as you can see below, that poor seasonal stretch tends to bottom in the first week of March and turn higher. Seasonals become a positive tailwind for the S&P from now into early May. That’s another factor to consider given oversold conditions and signs of capitulation.

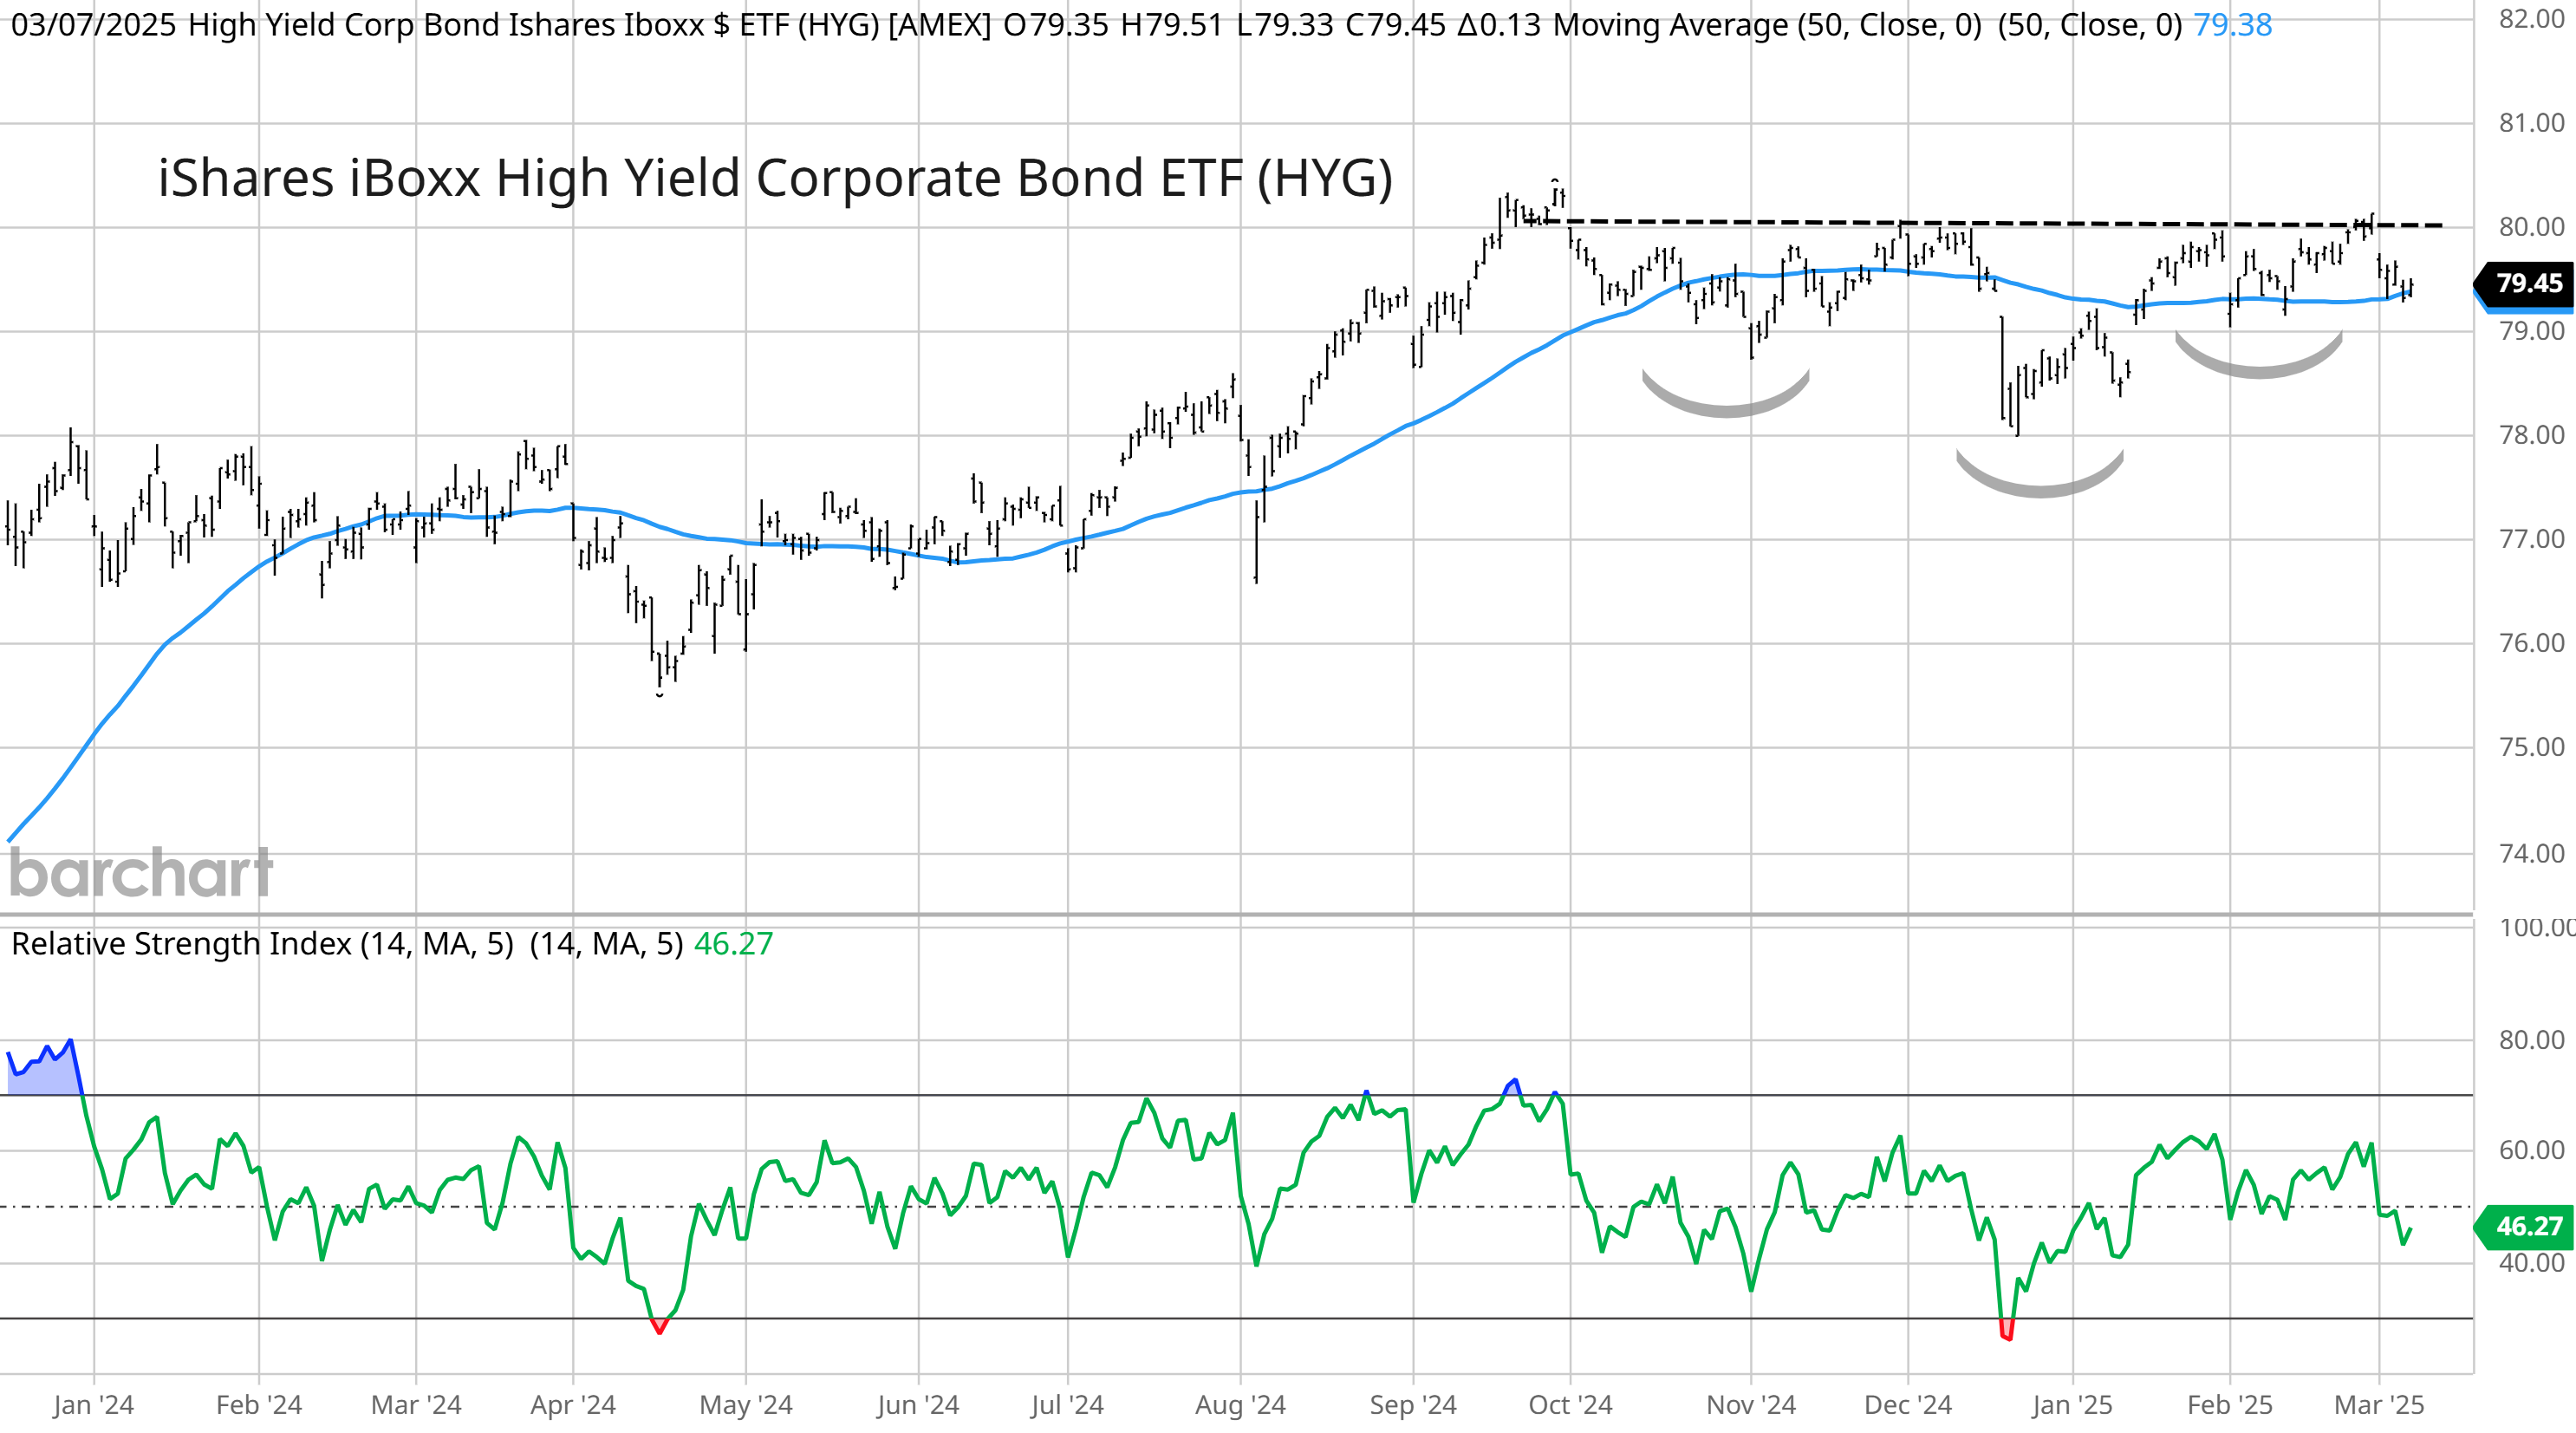
While news on the economic front seems to be getting worse, some market sectors sensitive to the economic outlook are holding up just fine. The chart below shows the iShares High Yield Corporate Bond ETF (HYG). High yield bond issuers are of lower financial quality due to either leveraged balance sheets or low interest coverage ratios. That makes high yield bonds extremely sensitive to the economic outlook. As you can see below, HYG is only seeing a small retracement off the prior highs. And HYG might be creating a bullish inverse head and shoulders setup (shown with the arches). A breakout over $80 would suggest high yield investors are discounting a favorable outlook.
After helping push market indexes higher over the past couple years to a number of new all-time highs, the “Magnificent 7” are playing a major role in the recent selloff. The chart below shows the year-to-date return of the Nasdaq 100 (black line), and the contribution from the Mag 7 versus the 93 other stocks in the index. You can see that the Mag 7 is responsible for nearly all of the Nasdaq 100’s decline on the year. That’s a sharp reversal from prior years, where the Mag 7 has been a key driver in propping up the major indexes. It also shows the average stock is holding up much better than mega-cap stocks so far this year.

Heard in the Hub
The Traders Hub features live trade alerts, market update videos, and other educational content for members.
Here’s a quick recap of recent alerts, market updates, and educational posts:
What comes next according to S&P 500 seasonality.
The main reason behind plunging economic growth estimates.
The chart setup in this inflation-sensitive sector about to breakout.
Underlying components in the ISM report points to higher inflation.
You can follow everything we’re trading and tracking by becoming a member of the Traders Hub.
By becoming a member, you will unlock all market updates and trade alerts reserved exclusively for members.
👉You can click here to join now👈
Trade Idea
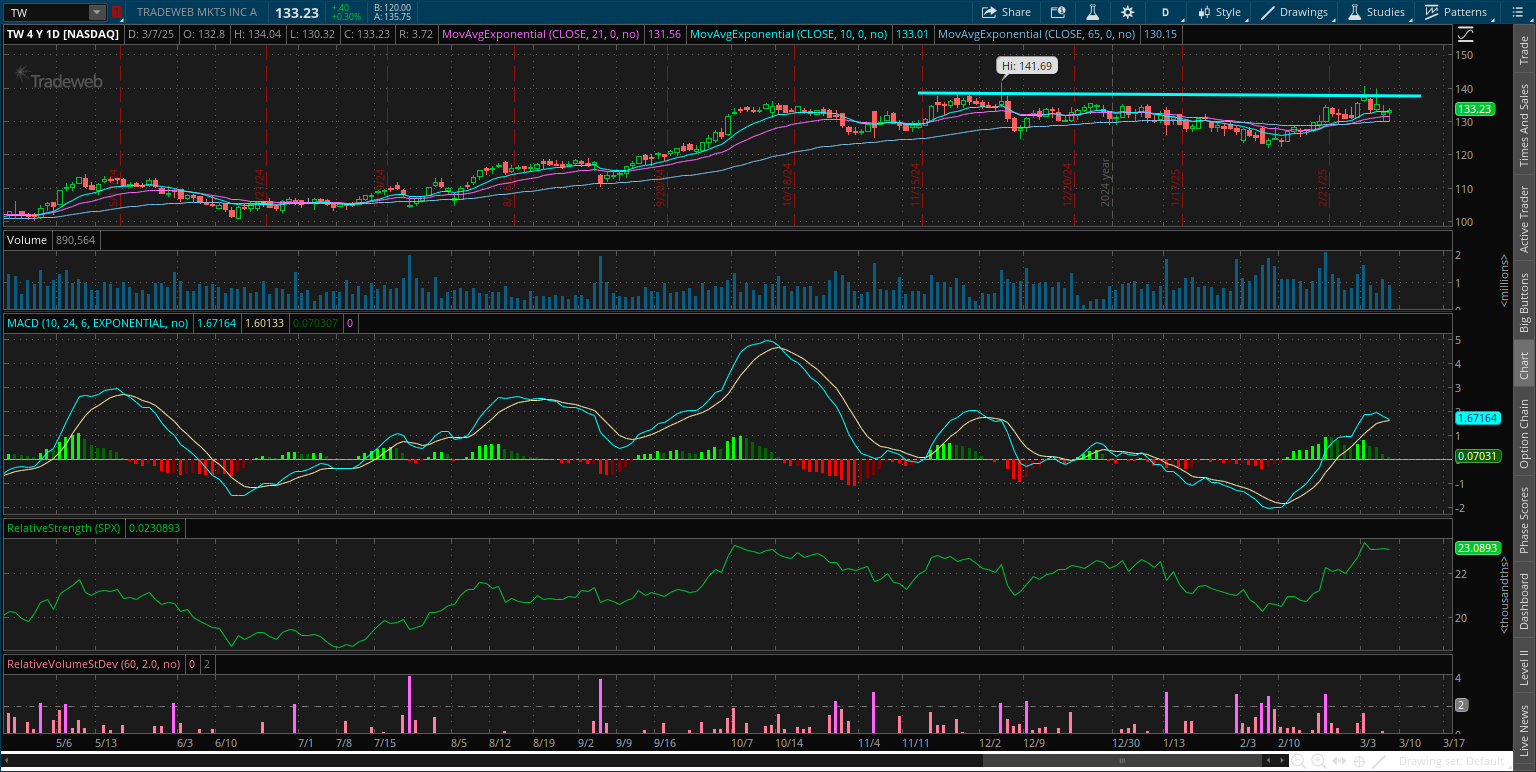
Tradeweb Markets (TW)
The stock peaked near $140 in November then made a shallow retracement. Testing resistance again this week as the MACD crosses back above zero. I want to see one more smaller pullback that holds above $130, then a breakout over $140.
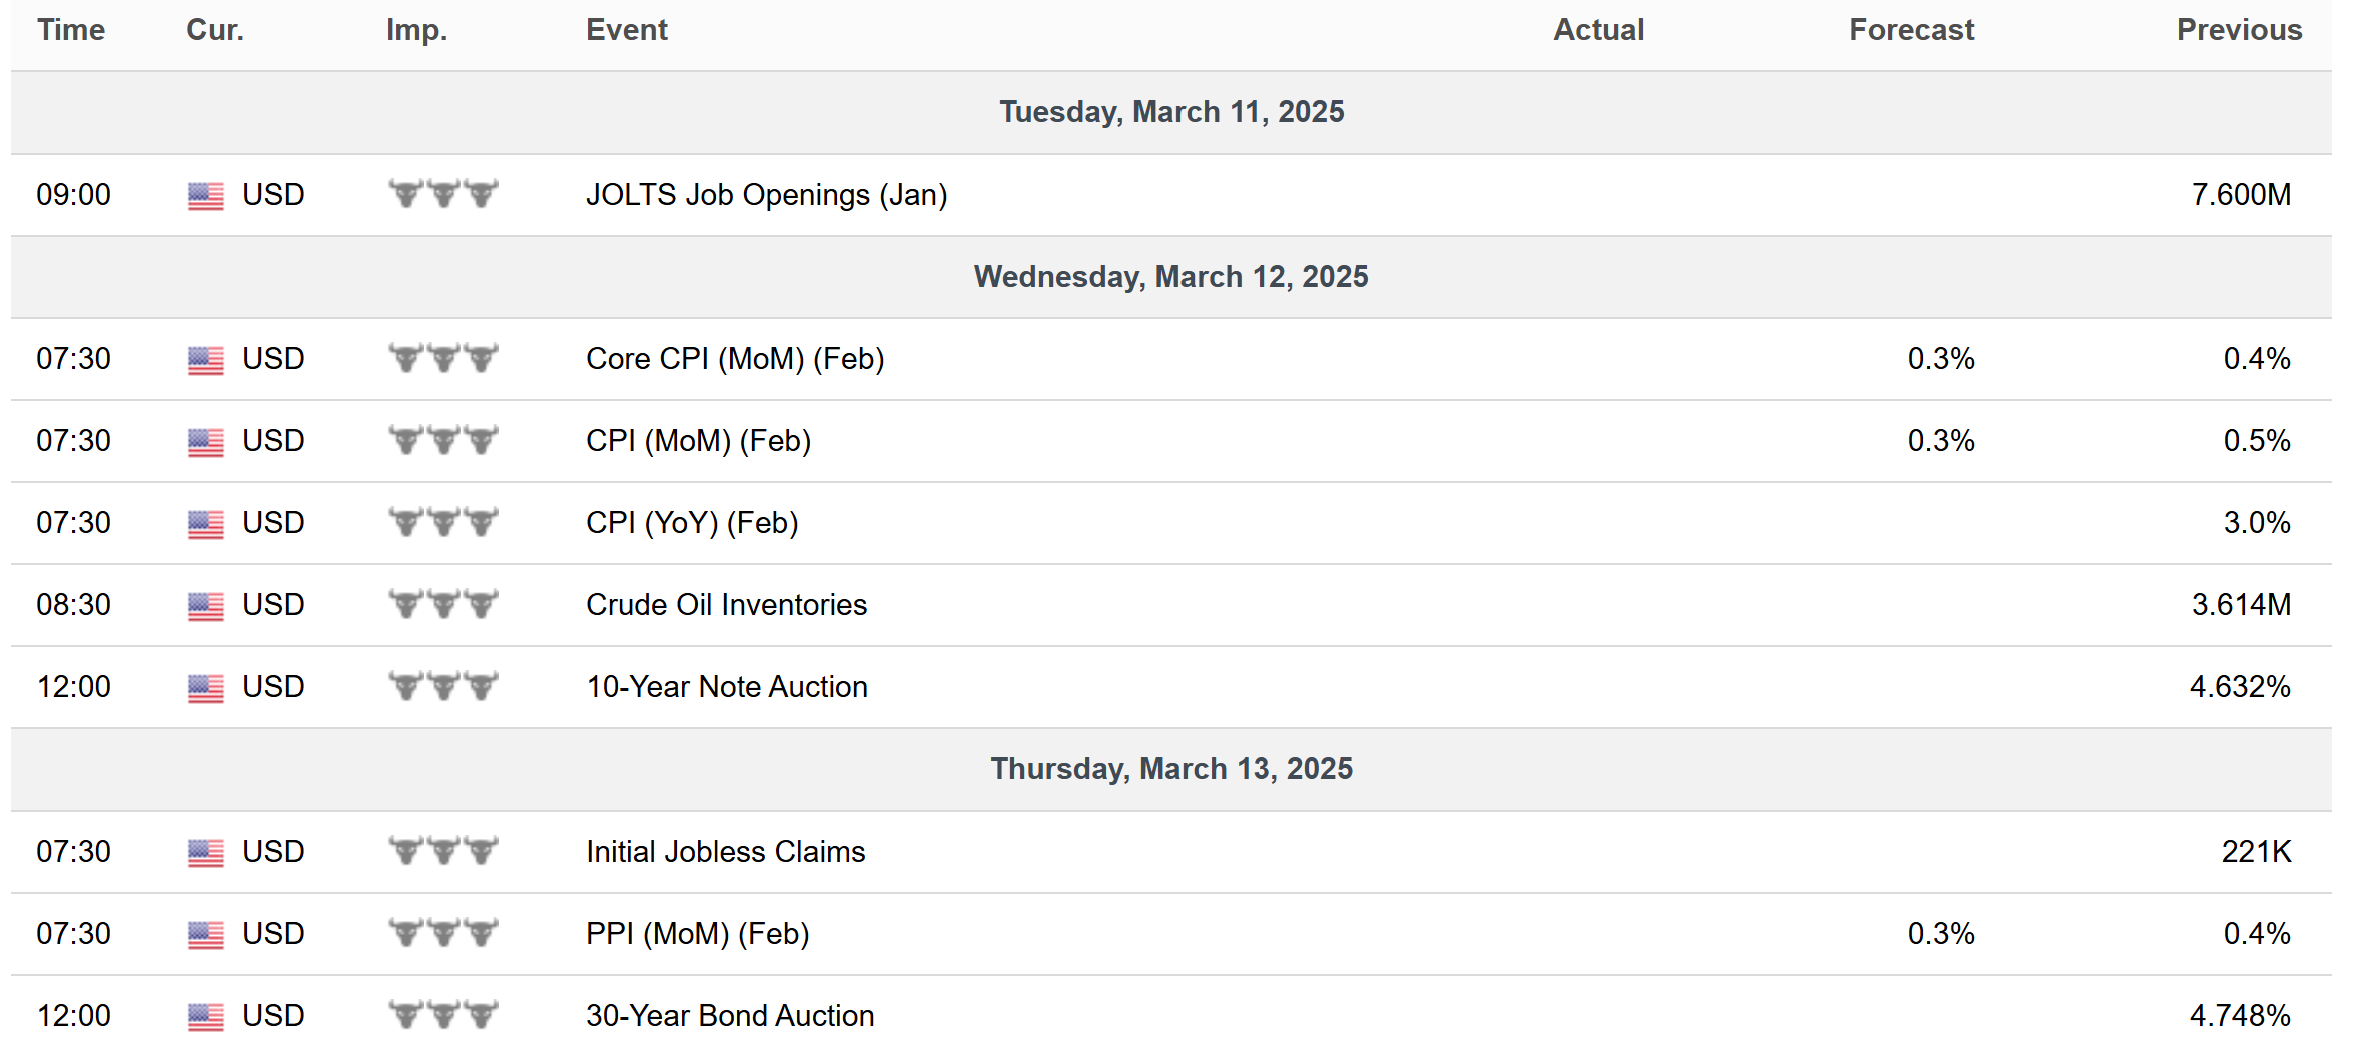
Key Upcoming Data
Economic Reports
Earnings Releases

I hope you’ve enjoyed The Market Mosaic, and please share this report with your family, friends, coworkers…or anyone that would benefit from an objective look at the stock market.
Become a member of the Traders Hub to unlock access to:
✅Model Portfolio
✅Members Only Chat
✅Trade Ideas & Live Alerts
✅Mosaic Vision Market Updates + More
Our model portfolio is built using a “core and explore” approach, including a Stock Trading Portfolio and ETF Investment Portfolio.
Come join us over at the Hub as we seek to capitalize on stocks and ETFs that are breaking out!
And if you have any questions or feedback, feel free to shoot me an email at mosaicassetco@gmail.com
Disclaimer: these are not recommendations and just my thoughts and opinions…do your own due diligence! I may hold a position in the securities mentioned in this report.
Thanks.
* Not back tested but based on a few years of observation, I wait to see market new highs/new lows to be at least 50% new highs. Supposed to be an indication of 'smart money' coming back into the market. (?)