
The Market Mosaic 3.8.26
S&P 500: Can Oversold Conditions Ignite A Rally?

👋Welcome back to The Market Mosaic, where I gauge the stock market’s next move by looking at macro, technicals, and market internals. I’ll also highlight trade ideas using this analysis.
If you find this report helpful please hit that “like” button, share this post, and become a subscriber if you haven’t already done so!
🚨And be sure to check out Mosaic Traders Hub. It’s a members-only platform to alert trade ideas, track a model portfolio of open positions, and further analyze the message coming from the capital markets.
Now for this week’s issue…
Hostilities between the U.S. and Iran show no signs of easing which is wreaking havoc on numerous energy markets.
Neither side is showing signs of backing down following U.S. strikes on Iran, and Iran’s retaliation against military and infrastructure targets in multiple countries across the Middle East.
At the same time, tanker traffic in the Strait of Hormuz has slowed to a halt. The chart below shows the number of tanker transits by type of ship going through the Strait, which has essentially collapsed to zero.

That’s crippling energy exports in a region responsible for approximately 30% of global oil production and 18% of the world’s natural gas. Key energy products extend to liquified natural gas, jet fuel, and ingredients used to produce farm fertilizer products.
The result is a surge in energy prices. Oil prices saw the biggest weekly gain ever with a 35% rally last week to top $90 per barrel. Domestic gasoline prices jumped by $0.32 per gallon, which is the third largest weekly gain in the past 20 years.
The rally in energy prices is posing a threat to the economy and capital markets. Rising oil and gas prices threatens to crimp consumer spending and adds inflationary pressures. The prospect for higher inflation is causing uncertainty over the outlook for monetary policy.
Stocks tumbled in response to the dual threat facing the economic outlook and valuations via higher interest rates. The S&P 500 dropped 2% while the Dow Jones Industrial Average had its worst week since last April’s trade war.
But there are signs that the selloff is going too far with market breadth hitting oversold levels. At the same time, several measures of fear in the market are triggering signals associated with near-term bottoms.
This week, let’s look at how the conflict in the Middle East is driving a breakout in key commodity indexes, and why it’s not just energy prices that could be impacted. We’ll also look at the stock market reaction, and why breadth along with measures tracking volatility could point to a near-term bottom.
The Chart Report
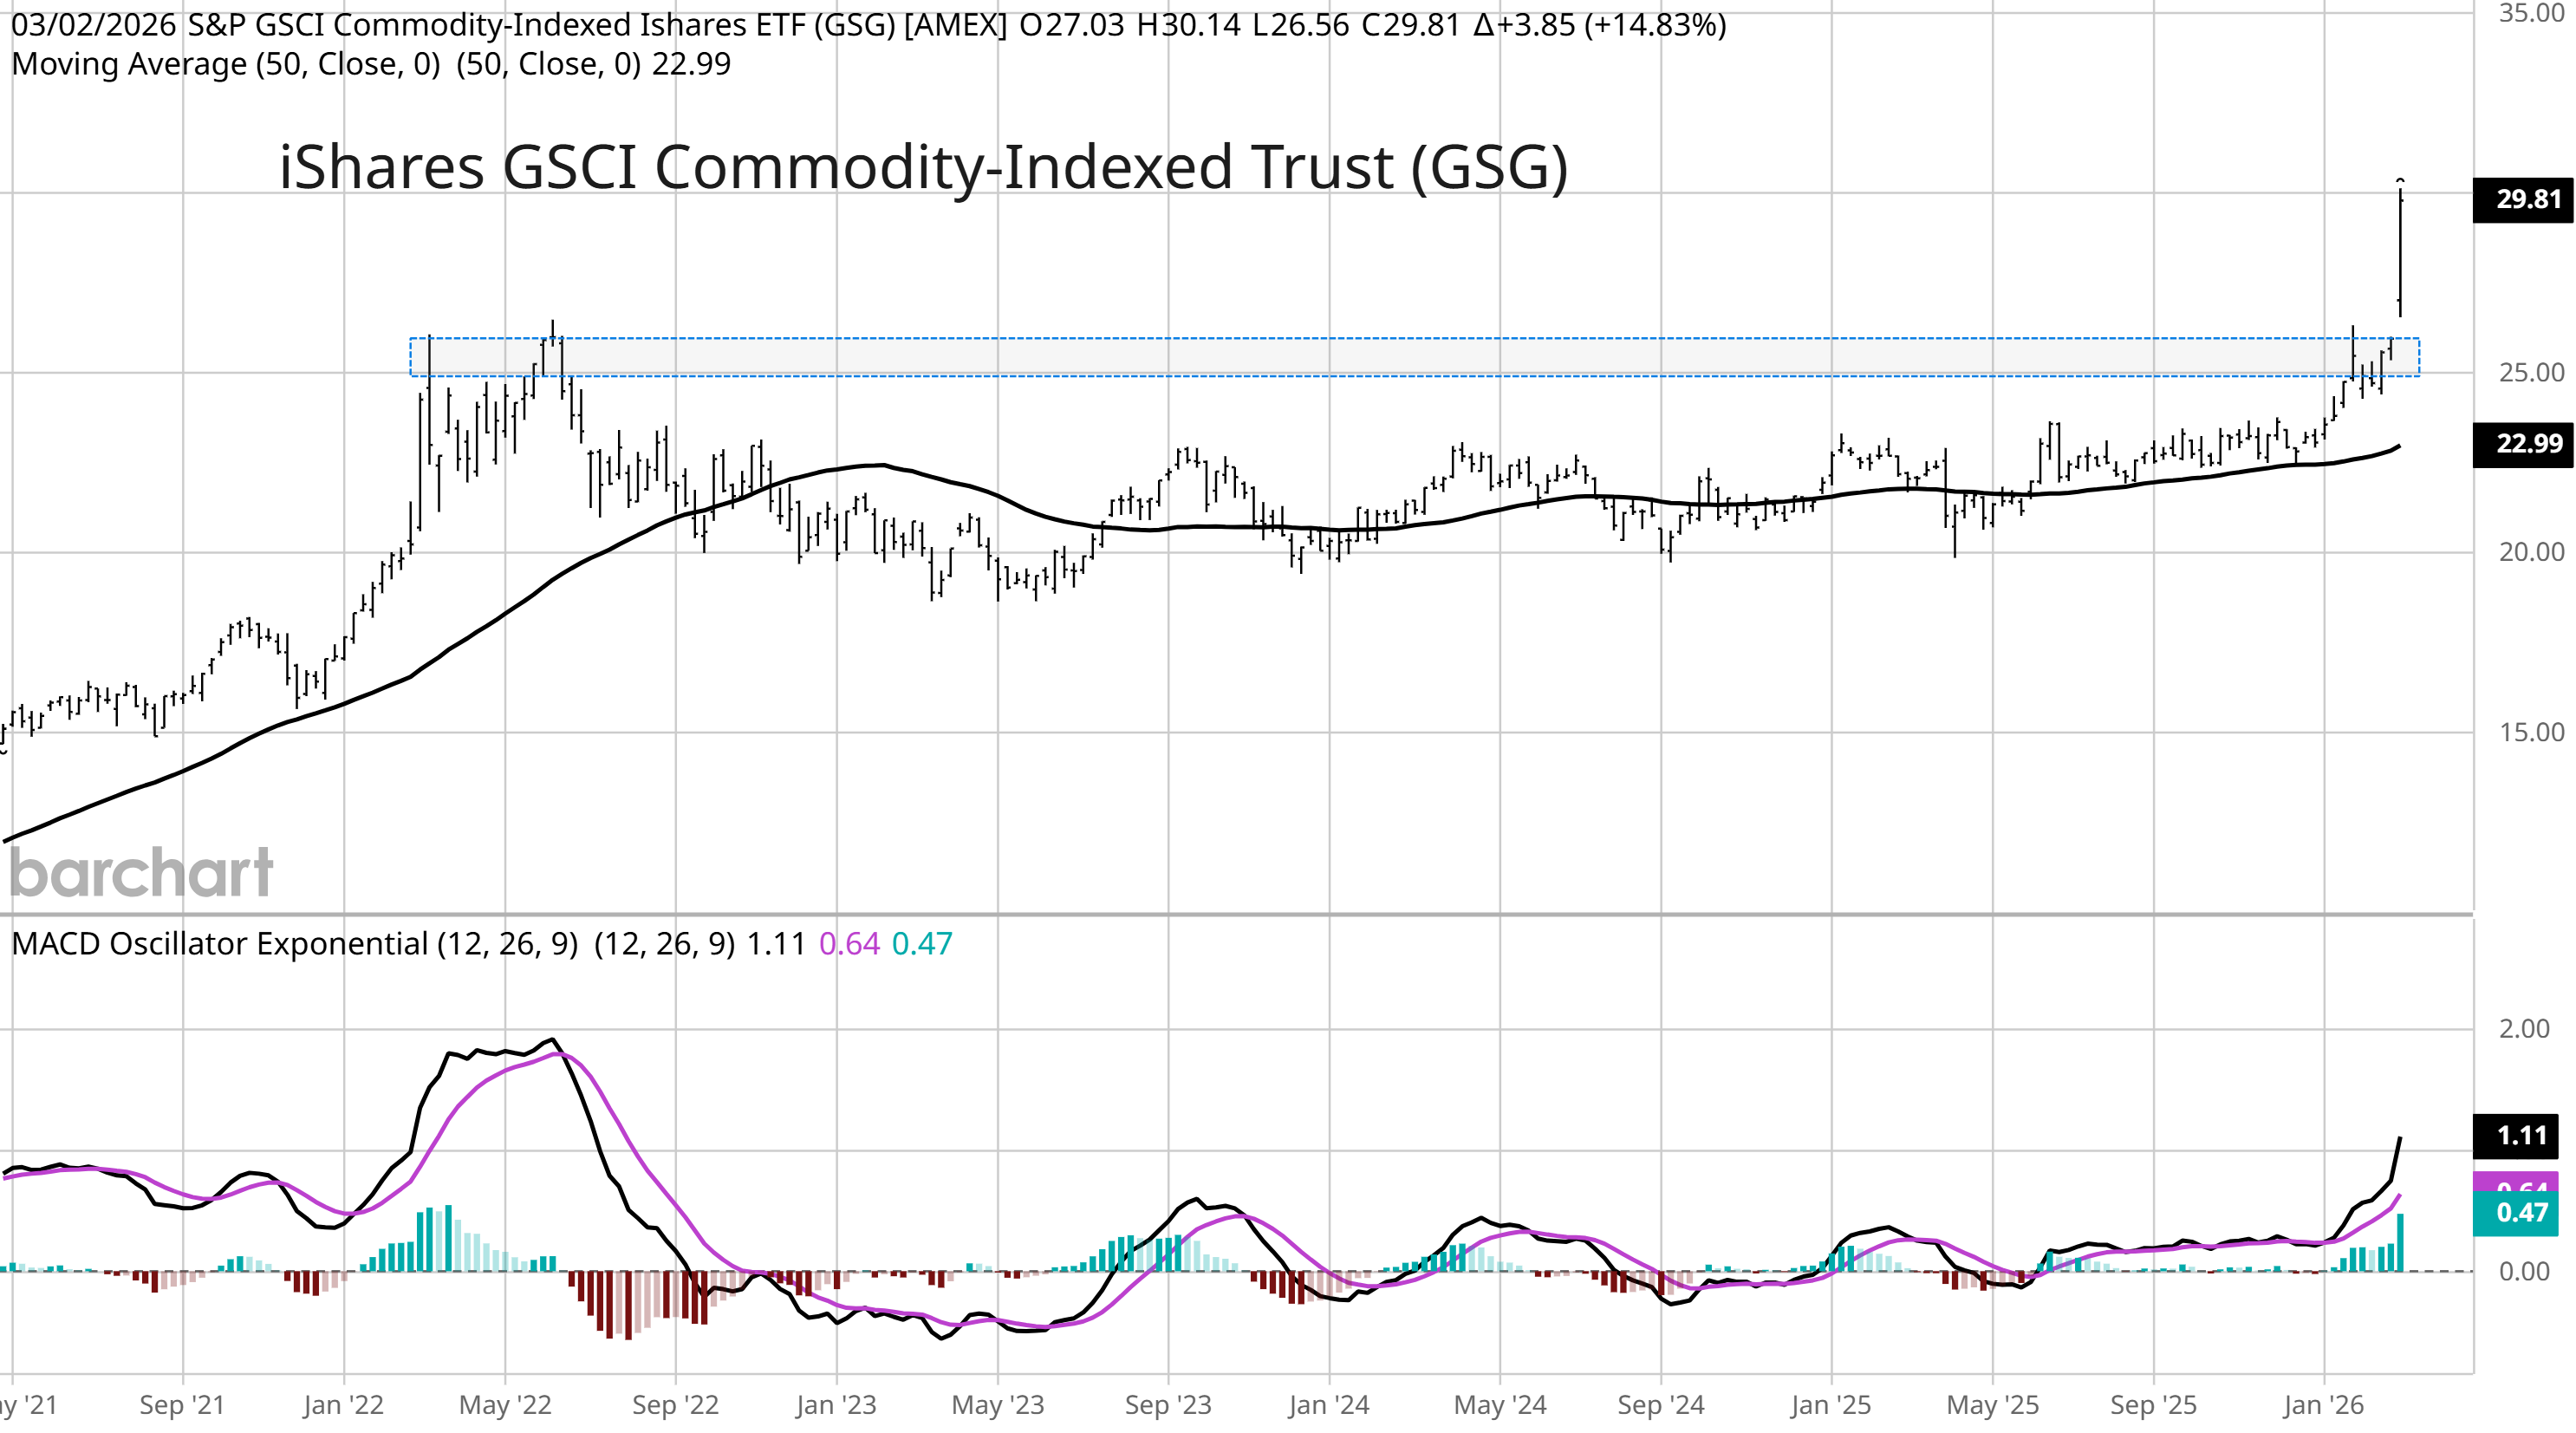
The threat facing global commodity supplies is sending everything from copper to oil surging higher. Base metals like copper have already been rallying in the face of structural supply deficits from data center demand, and now oil and gas prices are jumping on geopolitical uncertainties. The broadening rally is sending indexes tracking commodity prices to significant breakouts. The weekly chart below shows the iShares S&P GSCI Commodity-Indexed Trust ETF (GSG), which tracks a broad basket of commodity prices. GSG is breaking out from a bullish multi-year basing pattern forming since the last peak in 2022. GSG has been making higher lows since 2023 and is taking out the highs from 2022. The last major rally in commodity prices into mid-2022 coincided with an inflation wave that saw the consumer price index (CPI) top at 9.0%.
The movement in key segments of the capital markets can tip the outlook for changing conditions in the economy. I’ve frequently warned about the potential for a breakout in commodity prices, and what it means for the inflation outlook. The rally in other inflation-sensitive sectors like energy producers is sending a signal on the prospect for rising inflation as well. The chart below plots the correlation to inflation across various asset classes over the past decade. Along with the rally in commodity prices and natural resource stocks, keep close watch of the performance of bond prices that are negatively correlated to inflation (bond price tend to fall and yields rise during rising inflation). The initial reaction in longer-dated Treasury yields was to fall following the Middle East conflict, which reflects a flight to safety. But that reaction in being quickly reversed with the 10-year Treasury yield rising 20 basis points to 4.15% on the week. Bonds could be delivering another warning on the outlook for inflation.

While the jump in oil and gas prices is the focal point for investors following the events in the Middle East, food prices could experience a significant jump in the months ahead as well. That’s because several key fertilizer ingredients also pass through the Strait of Hormuz, with around 33% of global fertilizer supply transiting the Strait. That makes indexes tracking agricultural products the next area for a key breakout. The chart below plots several commodity categories, with agricultural commodities at the bottom. The rally in precious metals was followed by base metals like copper, and now energy products more recently. The next commodity domino to watch could be a breakout in agriculture commodities.

Stock market indexes are selling off over fears of rising energy prices and spillover impact to consumer spending and inflation. But there are signs emerging that the selloff has gone too far in the near-term with market breadth hitting oversold territory. The chart below plots the McClellan Oscillator applied to the S&P 500, which tracks a trailing difference between advancing and declining stocks on the S&P. The oscillator is hitting levels that have marked near-term bottoms over the past three years and has generally been associated with positive forward returns. Whenever the oscillator has fallen to its current level over the past three years, the S&P has rallied by 6% on average over the next three months with a 75% win rate.

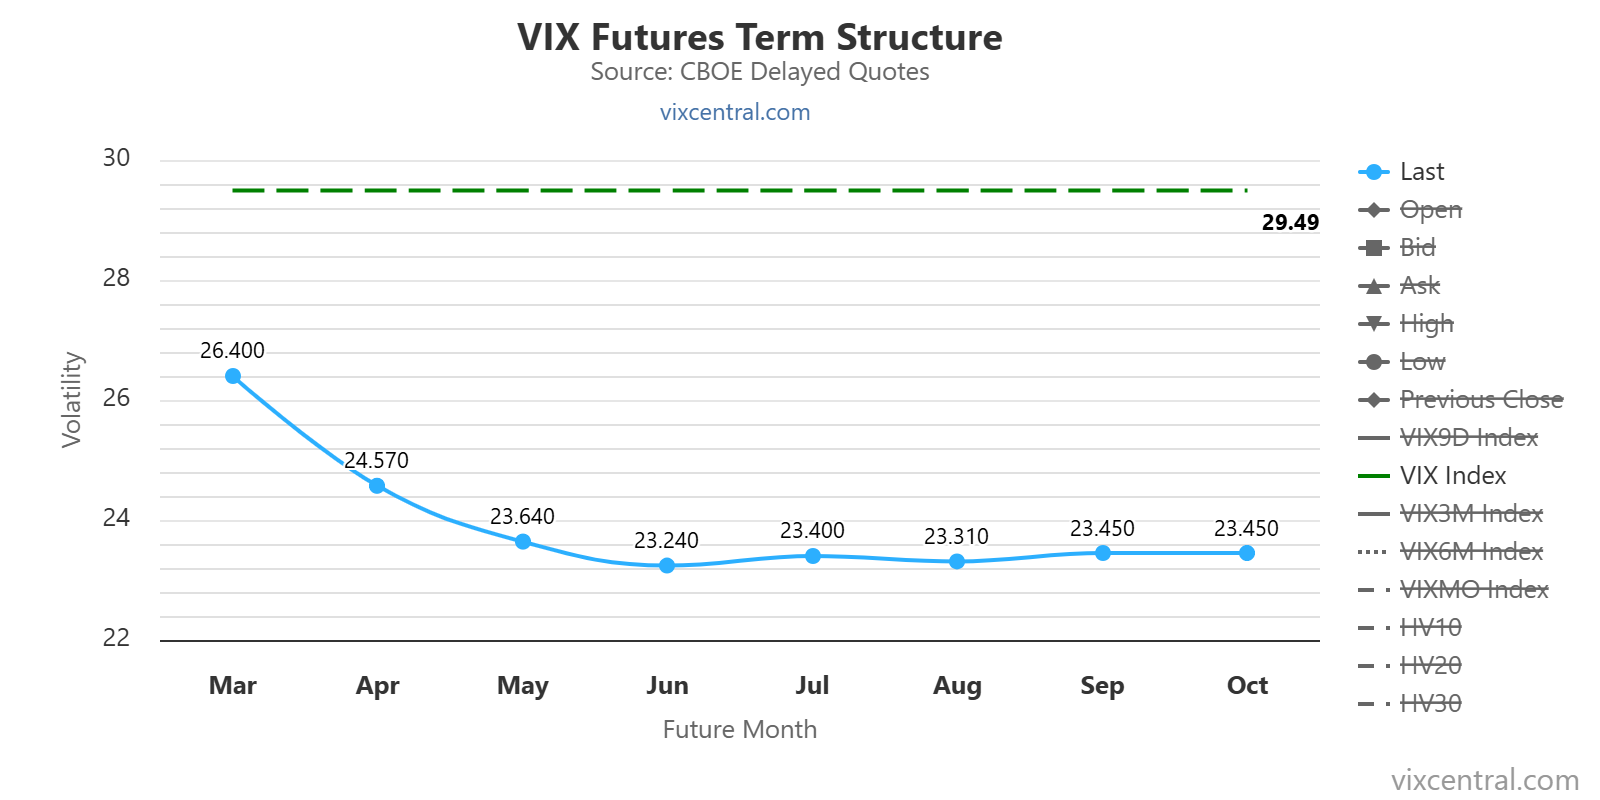
At a time when several measures of breadth are hitting oversold levels, there signs of growing fear as well. CNN’s Fear & Greed Index is close to tipping into “extreme fear” territory while the AAII’s survey of retail investors shows bearish views running above average. But the most significant signal (in my opinion) is coming from futures contracts tied to the CBOE Volatility Index (VIX) that tracks implied volatility on the S&P 500. The chart below plots the term structure of VIX futures contracts (blue line), which is inverting with last week’s selloff and jump in volatility. An inverted curve means that near-term VIX futures contracts are being pushed above contracts that expire in future months. An inverted curve can indicate too much fear and panic among investors, and can hint at a near-term bottom in the S&P.
Heard in the Hub
The Traders Hub features live trade alerts, market update videos, and other educational content for members.
Here’s a quick recap of recent alerts, market updates, and educational posts:
Nuclear stocks are setting up to break out.
How rising oil prices could impact interest rates.
AI stocks are losing their luster to this key group.
The Bitcoin levels to monitor for a “risk on” signal.
How to use relative strength to stay focused on market leaders.
You can follow everything we’re trading and tracking by becoming a member of the Traders Hub.
By becoming a member, you will unlock all market updates and trade alerts reserved exclusively for members.
Trade Idea
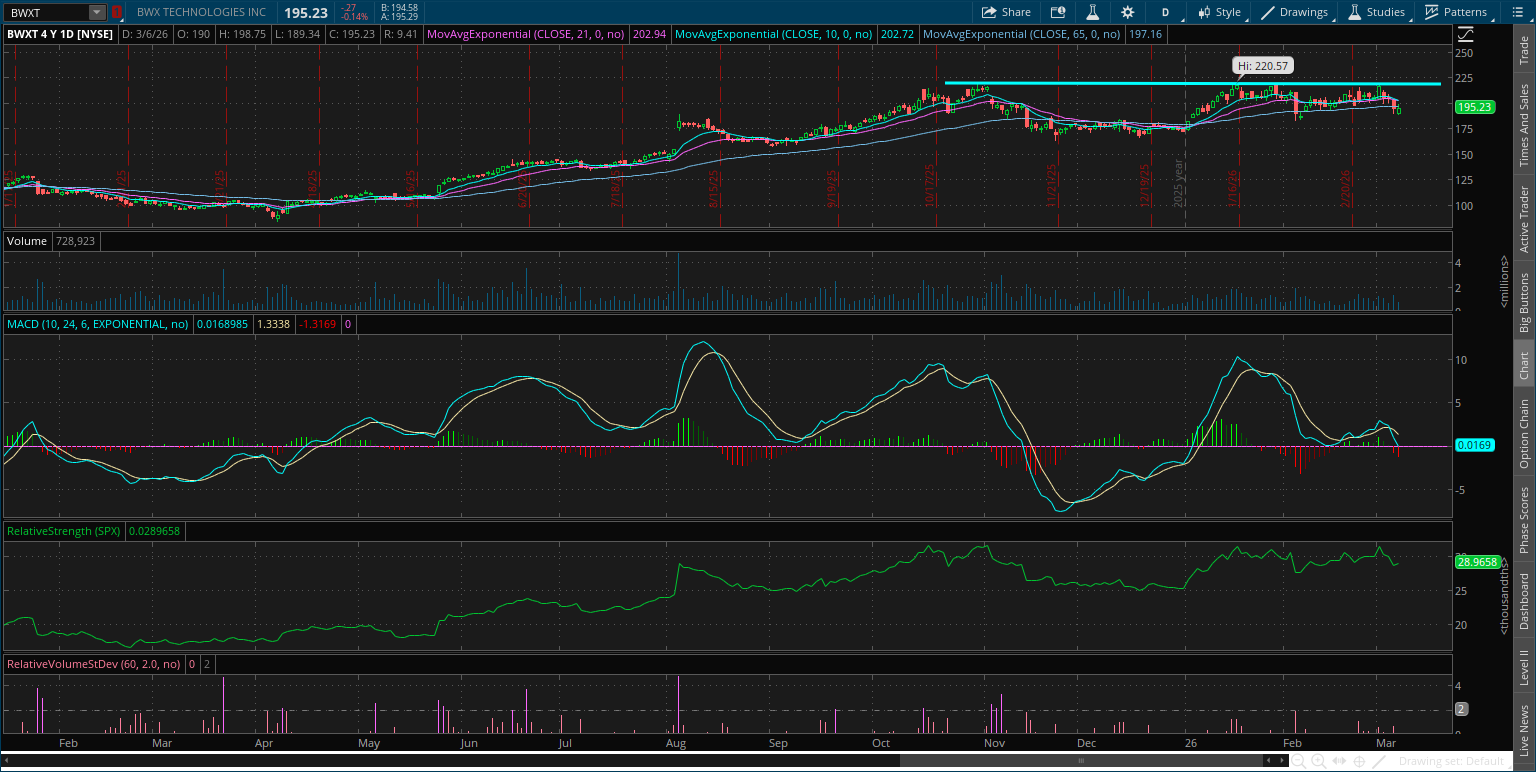
BWX Technologies (BWXT)
BWXT is trading in a new basing structure after peaking at $220 in October. The stock is completing a series of smaller pullbacks after testing resistance with a recent MACD reset above the zero line. I’m watching for a move over $220.
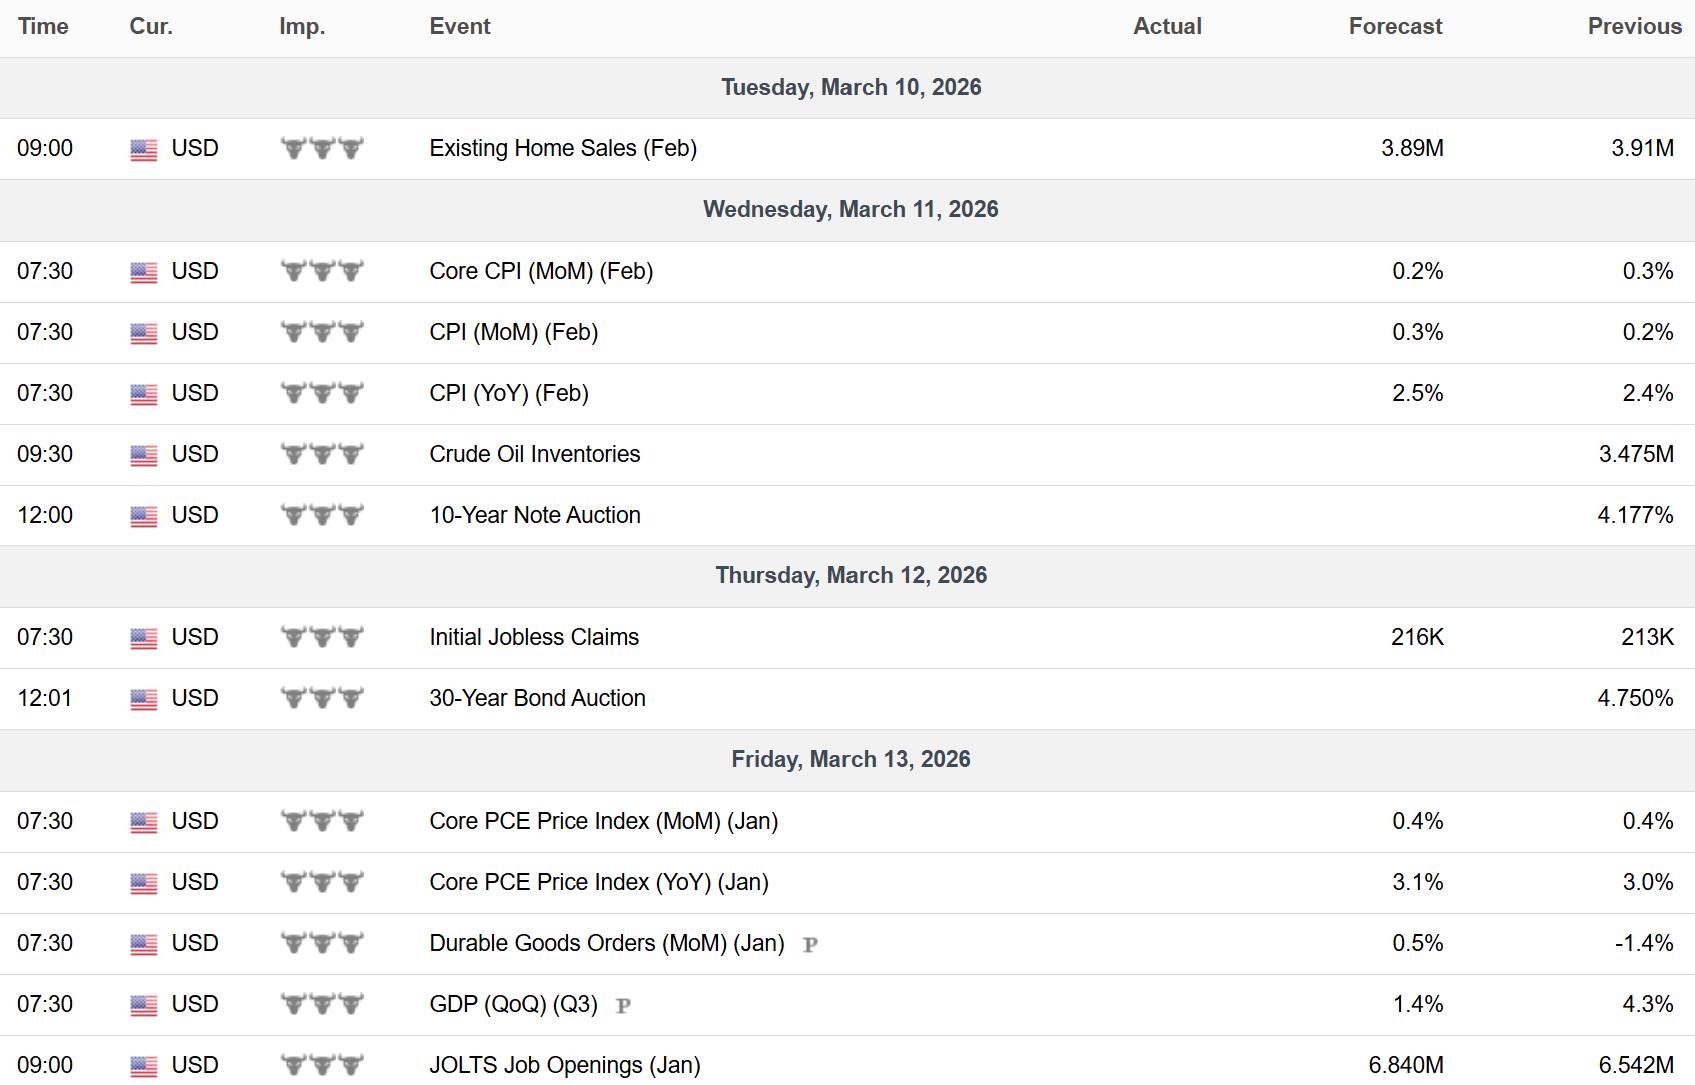
Key Upcoming Data
Economic Reports
Earnings Reports

I hope you’ve enjoyed The Market Mosaic, and please share this report with your family, friends, coworkers…or anyone that would benefit from an objective look at the stock market.
Become a member of the Traders Hub to unlock access to:
✅Model Portfolio
✅Members Only Chat
✅Trade Ideas & Live Alerts
✅Mosaic Vision Market Updates + More
Our model portfolio is built using a “core and explore” approach, including a Stock Trading Portfolio and ETF Investment Portfolio.
Come join us over at the Hub as we seek to capitalize on stocks and ETFs that are breaking out!
And if you have any questions or feedback, feel free to shoot me an email at mosaicassetco@gmail.com
Disclaimer: these are not recommendations and just my thoughts and opinions…do your own due diligence! I may hold a position in the securities mentioned in this report.