Welcome back to The Market Mosaic, where I gauge the stock market’s next move by looking at macro, technicals, and market internals. I’ll also highlight trade ideas using this analysis.
If you find this content helpful please hit that “like” button, share this post, and become a subscriber to this always free newsletter if you haven’t already done so!
And be sure to check out Mosaic Chart Alerts. It’s a midweek update covering my best chart setups among long and short ideas in the stock market, along with levels that could trigger a trade.
Now for this week’s issue…
In a week that featured a bevy of speakers from the Federal Reserve, the message was clear and unanimous. If economic data keeps coming in better-than-expected, prepare for higher interest rates…and for longer.
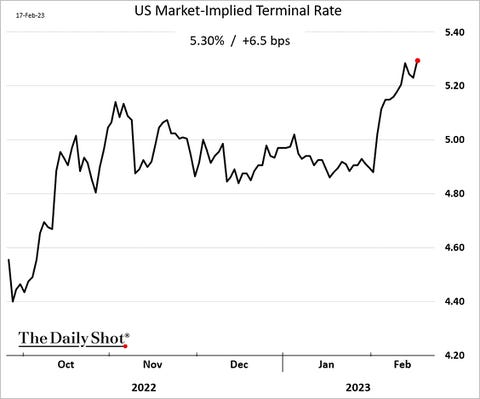
So when the past week also delivered a batch of decent reports on the economy, investors lost their collective mind as projections for the terminal rate jumped higher. The terminal rate is where the market expects the Fed to ultimately push short-term rates, and you can see below the rate shot higher over the past month.
Worse still, it wasn’t just rates on the short-end increasing in response.
Check out the chart of the 10-year Treasury yield. Rates in this tenor have jumped over 0.60% since the start of February, taking 10-year yields briefly back above 4% last week. That jump has coincided with a 5% dip in the S&P 500 over the same time frame.
The last time rates were around this level back in October, the S&P 500 was about 9% lower versus current prices. That has investors on edge that the jump in rates is about to unleash another plunge in the S&P 500.
But not so fast…
Good news on the economy and the implied interest rate impact to stock prices only addresses half the picture. Stronger economic data could actually save the day for investors. Here’s why stocks could buck the trend by rallying even with higher rates.
From Growth Scare to Green Shoots
Stocks plunged in 2022 as the Federal Reserve jacked up short-term rates at a historic pace. That impacts equities in two big ways:
Making future corporate earnings worth less today and thus pressuring valuations, and
Attracting investor capital out of stocks and into cash with a higher return.
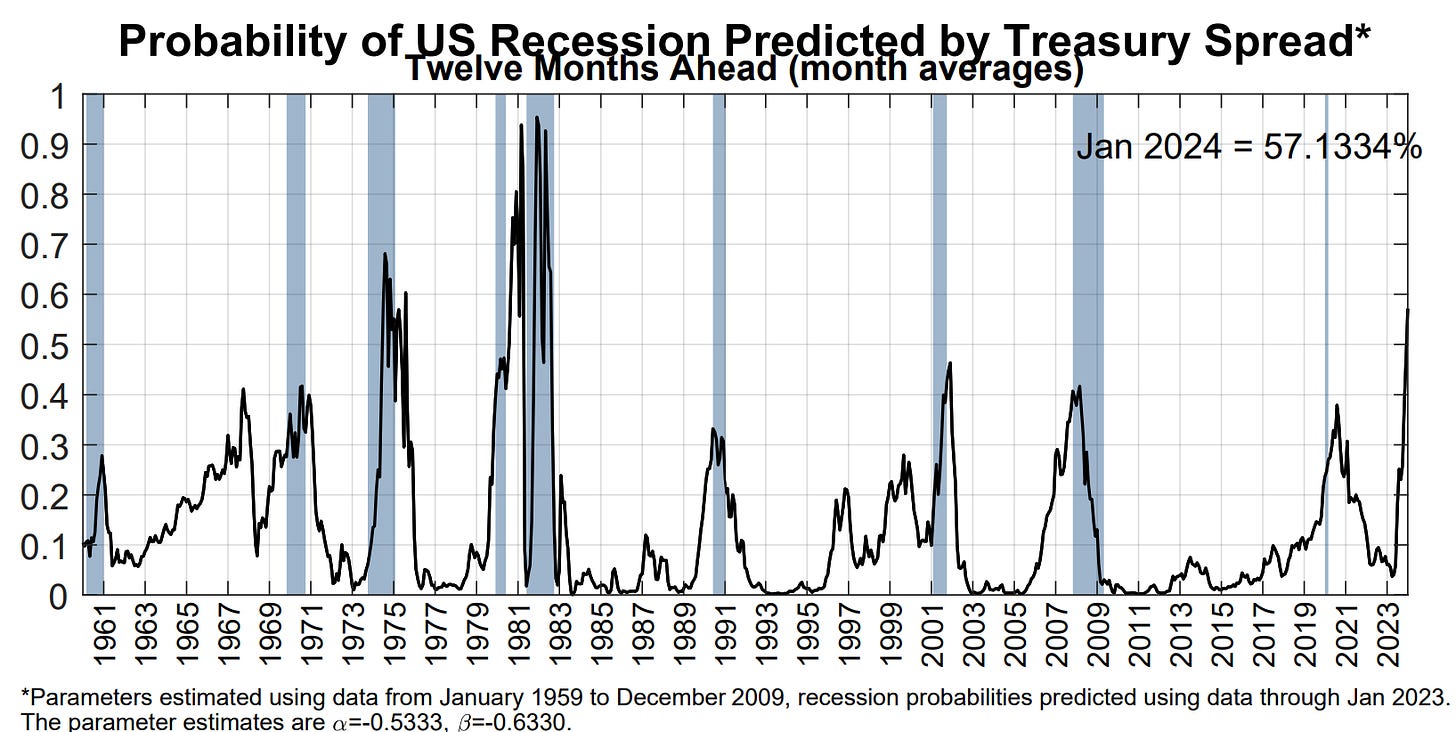
And at the same time, warning signals are piling up that the economy is about to take a dive as the Fed slams the brakes. I’ve frequently talk about leading indicators of activity, such as inverting yield curves that are predicting a 57% chance of recession according to the Fed’s model below.
So the fear coming into 2023 is that a double-whammy of falling valuations and falling earnings would send stocks careening to new lows. But there’s a way to escape this worse-case scenario, and it comes down to the growth outlook.
To escape the bear market, stocks need to get an earnings boost. And despite the warning from prominent leading indicators, there are now green shoots emerging for the growth outlook.
Last week featured the release of several important purchasing manager indexes (PMIs) from around the world. These surveys of managers operating in the manufacturing and services sector offers real time insights into the state of the economy and clues about the outlook. For these reports, a reading above 50 indicates expansion while below 50 points to contracting activity.
Take the ISM’s manufacturing report for example. February’s figure came in at 47.7, which was a slight improvement from the January figure. But also consider that the new orders component of the survey jumped to 47 from 42.5 in the prior month. Yes, it’s still below the 50 threshold but the rebound is notable as I posted below.

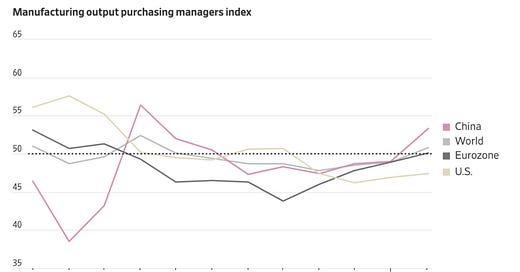
The ISM’s services gauge was even better, coming in at 55.1 which beat estimates and indicates expansion in the largest domestic economic sector. And it’s not just the U.S. seeing a bounce in economic indicators. PMI’s from around the world are seeing a synchronized move off their worst levels as well, with the global figure back above 50.
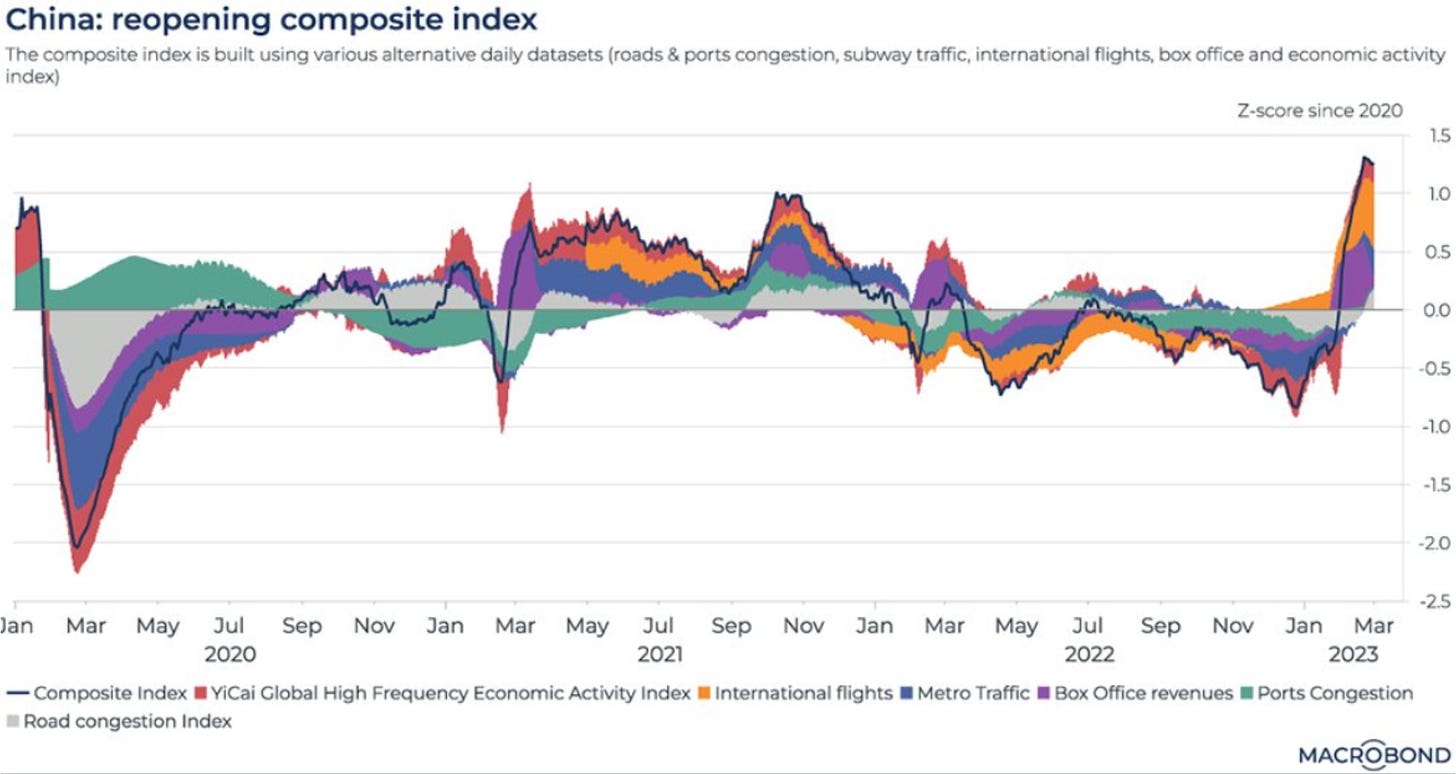
There’s also concrete signs that the world’s second largest economy is making solid progress on reopening, with data from China expanding as you can see in the chart above. A more detailed look below at trends among metrics like box office revenues, flights, and vehicle traffic confirms a sharp rebound.
The green shoot signs around the world are a welcome development for the growth outlook. While many PMI measures are still pointing to contracting activity, the rate of change is improving off low levels. Here’s what I’m watching for stock prices to confirm a more positive outlook.
Now What…
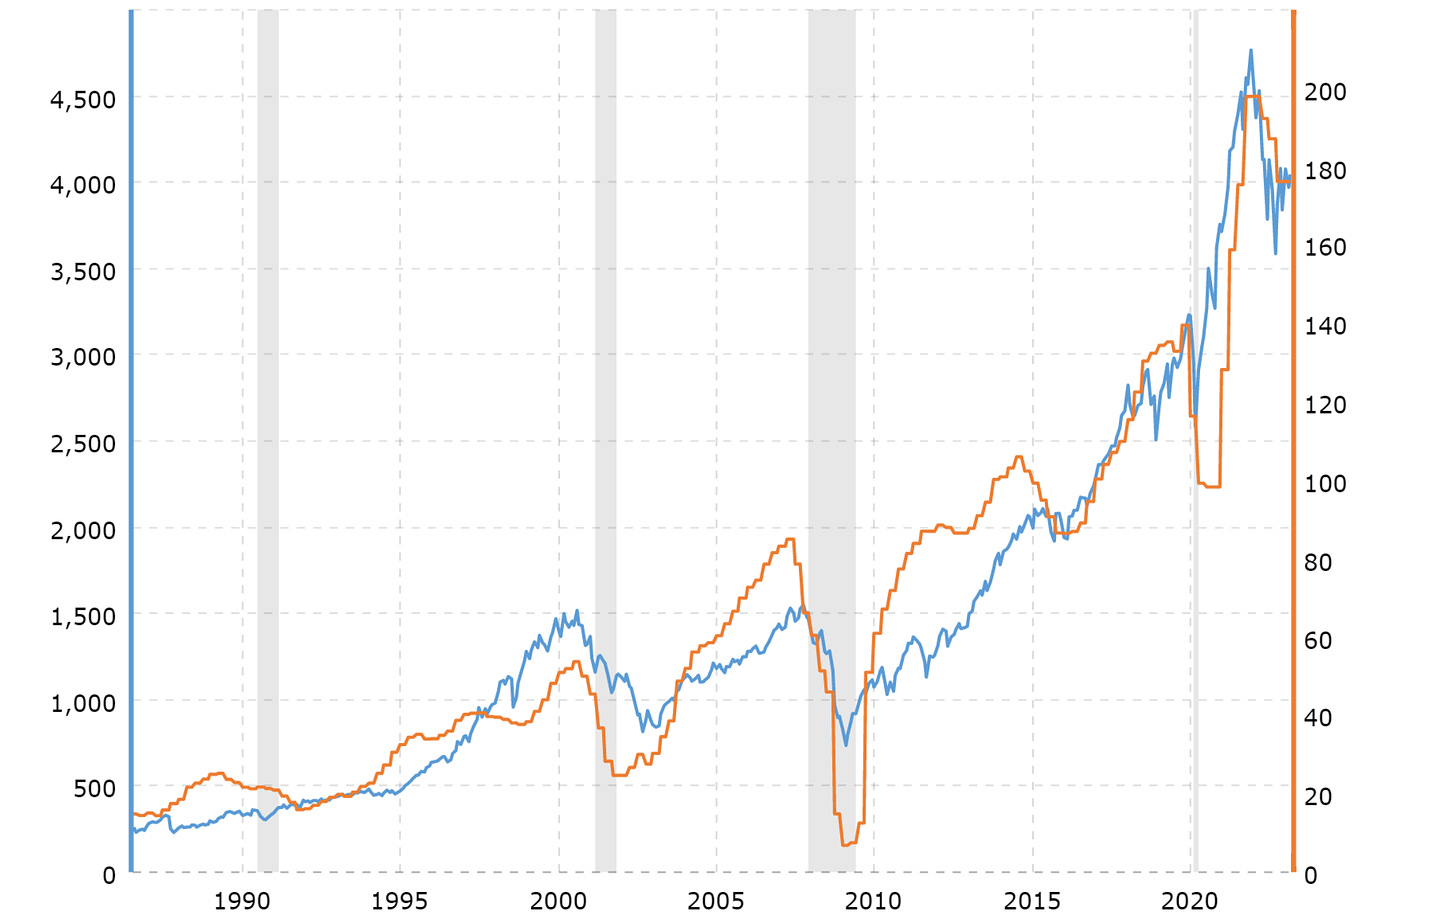
Back in January, I discussed how stocks likely bottomed if the economy avoids recession. The reason comes down to the earnings picture, and the ability of growing corporate profits to offset valuation pressures from higher rates.
If you need any further evidence of how earnings drives the stock market, then just check out this chart below of the S&P 500 Index (blue line) along with trailing earnings (orange line).
That’s why stocks can rally even in the wake of a restrictive Fed as I highlighted last week. The last two significant monetary tightening cycles that started in 2015 and 2004 saw stocks move higher for several years as earnings supported prices.
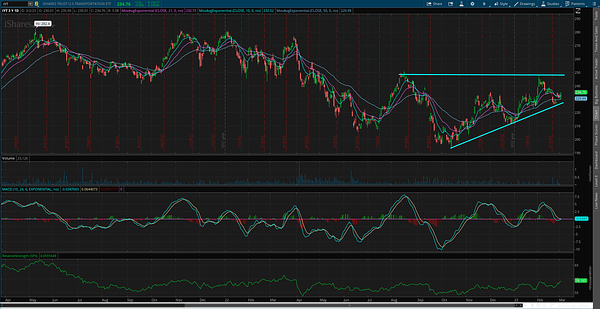
At the end of the day, I don’t trade based on a forecast. I read and react to what’s going on in real time. And my comments on green shoots for the growth outlook also needs to be confirmed by sector performance. I discussed in the post below how I’m watching the action in transportation, semiconductor, and small-cap stocks to confirm a bullish bias for stocks.

I also gauge the outlook based on the action with my watchlist, including stocks that are breaking out and from what sectors or industries. There’s been green shoots here as well, where recent breakouts are holding above key support levels and new setups are developing in cyclical areas.
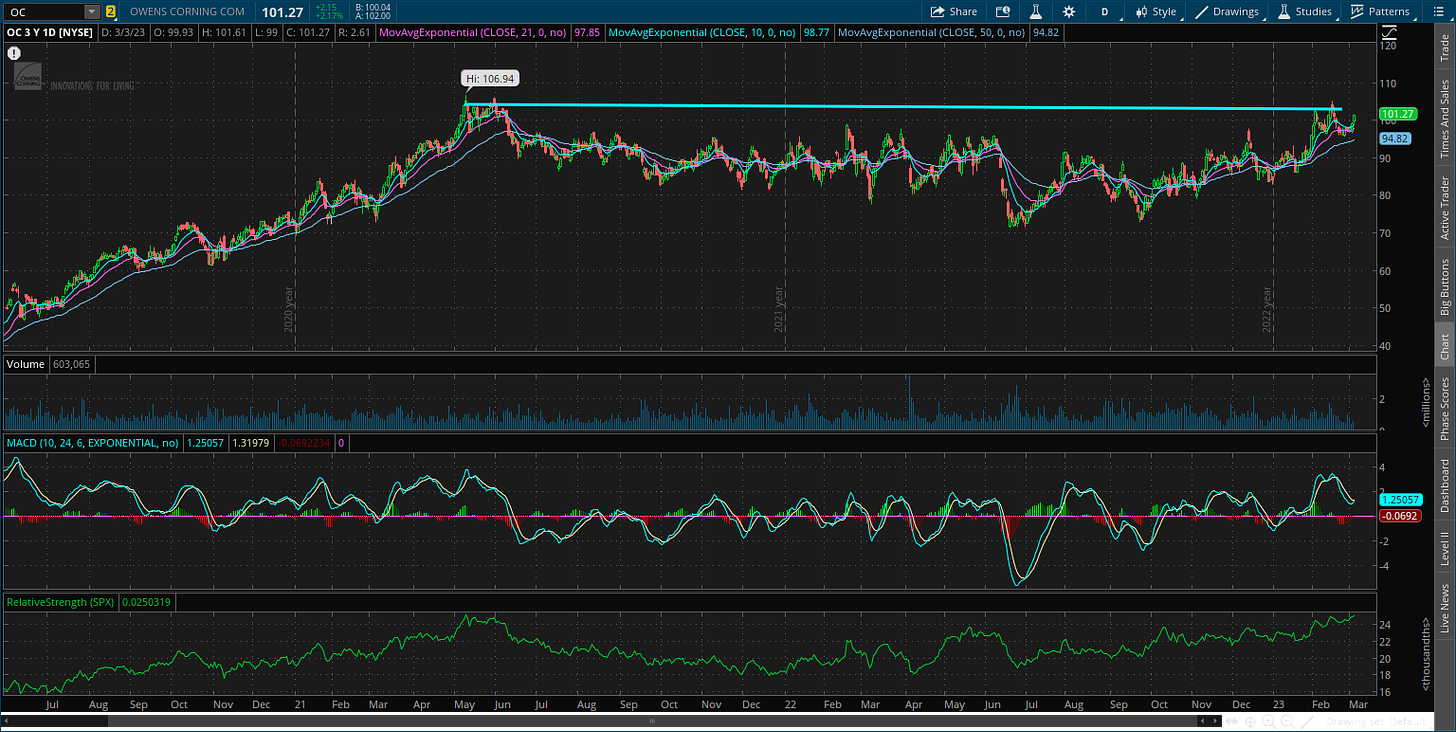
Like with building products stock OC that has been carving out a massive base over the last two years. A breakout over the prior highs around $105 would be a strong signal for both the stock and economy given the sector.
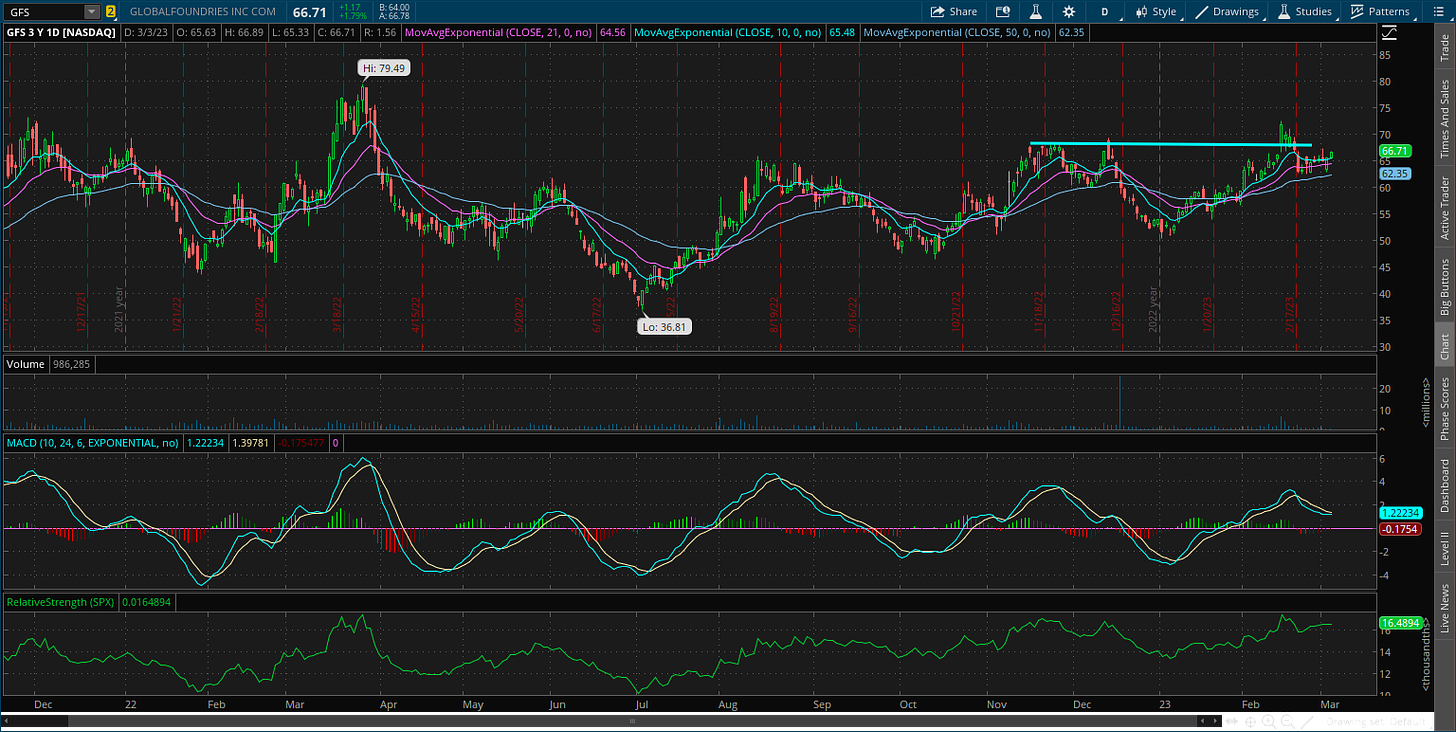
Or in the semiconductor industry with GFS. This is one of the largest chip companies in the world, and operates in a notoriously cyclical sector. I’m watching for a move over the $70 resistance level.
That’s all for this week. Green shoots are exactly what it sounds like: early signs that things could be improving for the growth outlook. Don’t take that as my endorsement that a recession will be avoided and a soft-landing scenario is upon us. As always, I will be objective in my analysis and use the action in stocks to ultimately guide my trading decisions.
I hope you’ve enjoyed this edition of The Market Mosaic, and please share this newsletter with your family and friends…or anyone that would benefit from an objective look at the stock market.
And make sure you never miss an edition by subscribing here:
For updated charts, market analysis, and other trade ideas, give me a follow on Twitter: @mosaicassetco
And if you have any questions or feedback, feel free to shoot me an email at mosaicassetco@gmail.com
Disclaimer: these are not recommendations and just my thoughts and opinions…do your own due diligence! I may hold a position in the securities mentioned in this newsletter.

