The Market Mosaic 3.31.24
The bullish case for commodities.
Welcome back to The Market Mosaic, where I gauge the stock market’s next move by looking at macro, technicals, and market internals. I’ll also highlight trade ideas using this analysis.
If you find this content helpful please hit that “like” button, share this post, and become a subscriber to this always free report if you haven’t already done so!
And be sure to check out Mosaic Chart Alerts. It’s a midweek update covering chart setups among long and short trade ideas in the stock market, along with levels I’m watching.
Now for this week’s issue…
Following a pair of hotter than expected inflation reports, investors are breathing a sigh of relief that not all price data for February are higher than expected.
The most recent Consumer Price Index (CPI) and Producer Price Index (PPI) came in above estimates for both the headline and core figure that strips out food and energy prices.
But the Personal Consumption Expenditures (PCE) inflation metric is widely considered to be the Federal Reserve’s preferred gauge. And February’s core figure increased 2.8% compared to last year (orange line below), which was in line with expectations. That also means fed funds (blue line below) is still the most restrictive relative to inflation since 2007.

That’s turning investor attention back to the timing for the first Fed rate cut, with market-implied odds now standing at 64% for the June meeting. But while investors pore over the timing of the first rate cut, key fixed income markets are reinforcing that a dovish pivot is coming.
In other words, don’t worry so much about the timing of the first rate cut. Rather, I’m evaluating the outlook for monetary policy with 2-year Treasury yields, which strongly suggests that rate cuts are coming sometime soon.
The chart below shows 2-year Treasury yield (blue line) versus the fed funds effective rate (red line). The 2-year yield has remained below the fed funds effective rate, and has led changes in fed funds on several occasions over the past 20 years.
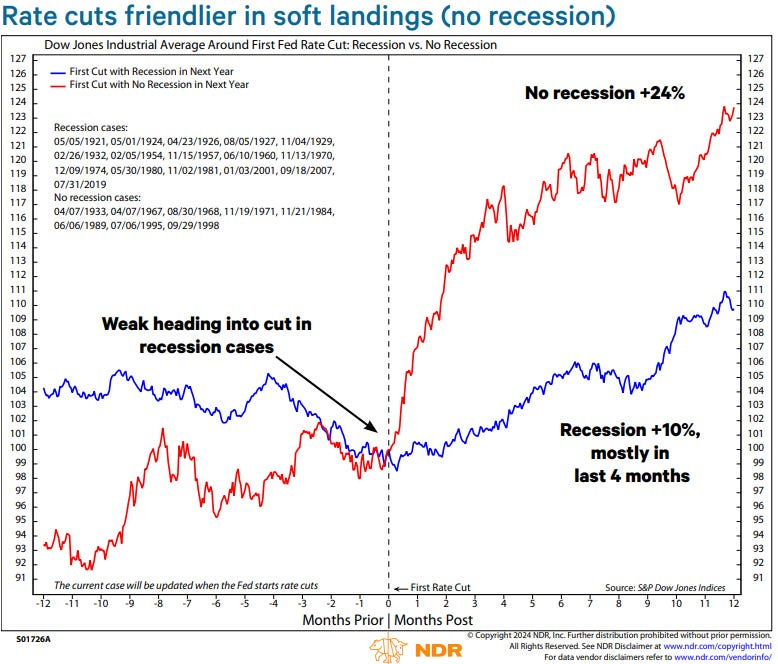
And that’s good news for stocks. A Fed cutting interest rates while the economy avoids recession is a positive scenario for the market. You can see in the chart below that when the Fed cuts rates in a non-recessionary environment, then the Dow Jones Industrial Average tends to rally over the next 12 months.
But signs of a strong economic regime coupled with falling interest rates isn’t just a positive backdrop for stocks. There’s another asset class showing various signs of breaking out, and it could still be in the early innings of a strong move higher.
The Case for Commodities
Trailing indicators show the economy is performing just fine. This Friday’s payrolls report for March is expected to show 200,000 jobs added for the month while the unemployment rate hovers near the low end of the historic range at 3.8%.
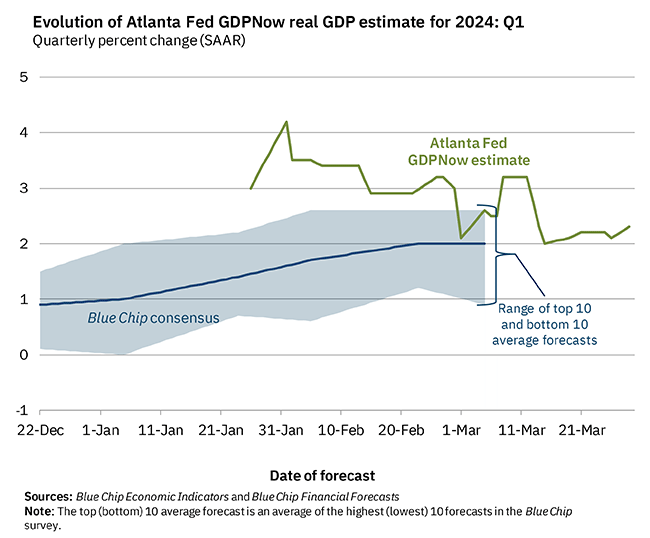
Fourth quarter gross domestic product was just revised higher to an annualized gain of 3.4%. The Atlanta Fed’s GDPNow indicator is pointing to 2.3% growth for the current quarter (chart below).
And in last week’s Market Mosaic, I made the case that several indicators are pointing to accelerating economic activity ahead. That strongly suggests that rate cuts are on the way while the economy avoids tipping into a recession.
While that’s a good thing for stocks as noted above, rate cuts in an expanding economy are good for other asset classes as well. More specifically, various commodities have responded favorably to such a scenario.
The chart below shows how various commodities have performed in a non-recessionary environment when the 2-year yield is falling, which should reflect changes in monetary policy. Copper and other industrial metals perform well, as does gold and oil.

But there are other catalysts that are lining up for the commodity trade as well, including positioning among professional investors. As an asset class, commodities have lagged badly with overall falling prices in the S&P GSCI commodity index since mid-2022, giving fund managers little reason to chase performance.
Based on BofA’s recent survey of fund managers, institutional portfolios are the most underweight to commodities relative to bonds since 2008’s financial crisis. But that type of herd positioning can quickly reverse especially if commodities start to recover, with fund managers scrambling to adjust exposure.

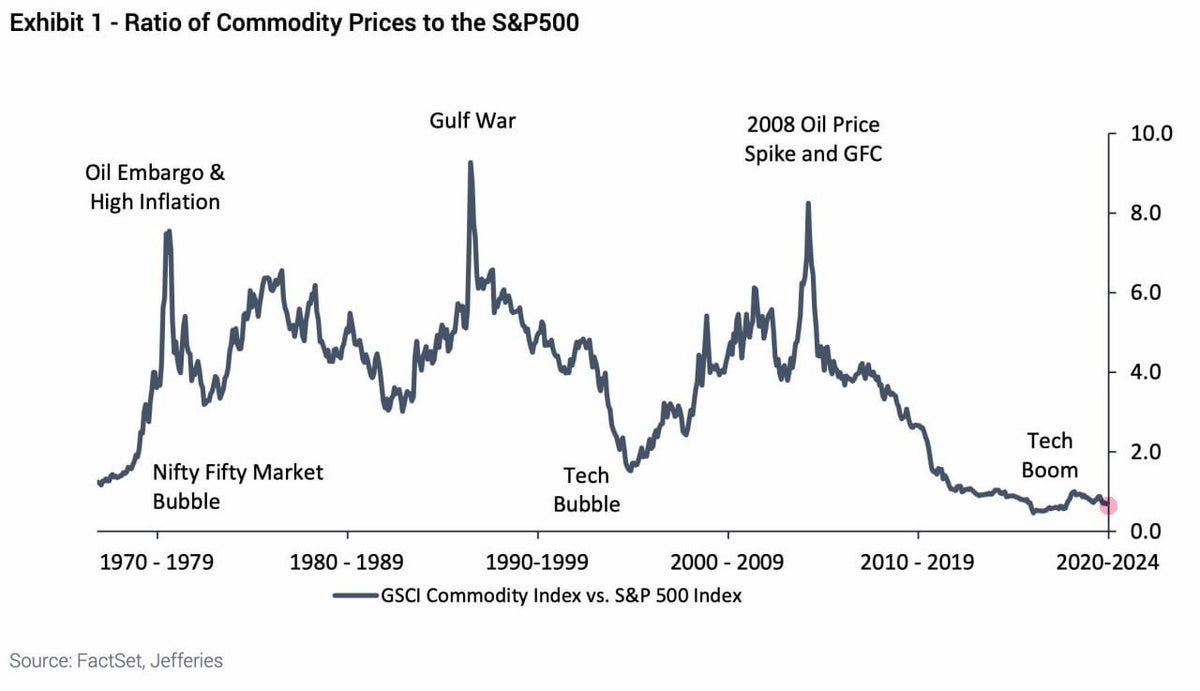
As institutional investors consider their portfolio mix, they could become a source of demand for commodities if momentum picks up. That’s especially the case since commodities are at historically cheap levels relative to equities.
The ratio of commodities to equity prices is hovering near historic lows, which in prior episodes saw a sharp mean-reversion in favor of commodities. The chart below takes the ratio back to the 1970s, with a rising line indicating commodities are outperforming stocks and vice versa. While the current ratio has traded at low levels for much of the past decade, the backdrop is becoming favorable for commodities to outperform off depressed levels.
A combination of favorable macro dynamics with a strong economy and falling short-term rates, underweight institutional managers, and a historically low price ratio relative to equities are making commodities an attractive risk/reward opportunity. A rally in commodity-related miners and producers could also further support breadth expansion.
Now What…
Following the S&P 500’s bottom in late 2022, early signs of narrow breadth had many concerned that the rally was on borrowed time…especially with the “Magnificent 7” leading the charge higher.
But since late last year, there are more signs that the rally is broadening out. Various measures of breadth thrusts (or extreme readings comparing advancing versus declining stocks) show that participation in the upside is quickly expanding and also points to institutional investors piling in.
Since the move higher in October, the rally in the S&P has seen a large number of days with strong upside volume along with momentum. The chart below plots the number of high upside volume days with the S&P’s 100-day change, showing broad strength coupled with strong momentum on this leg of the rally.

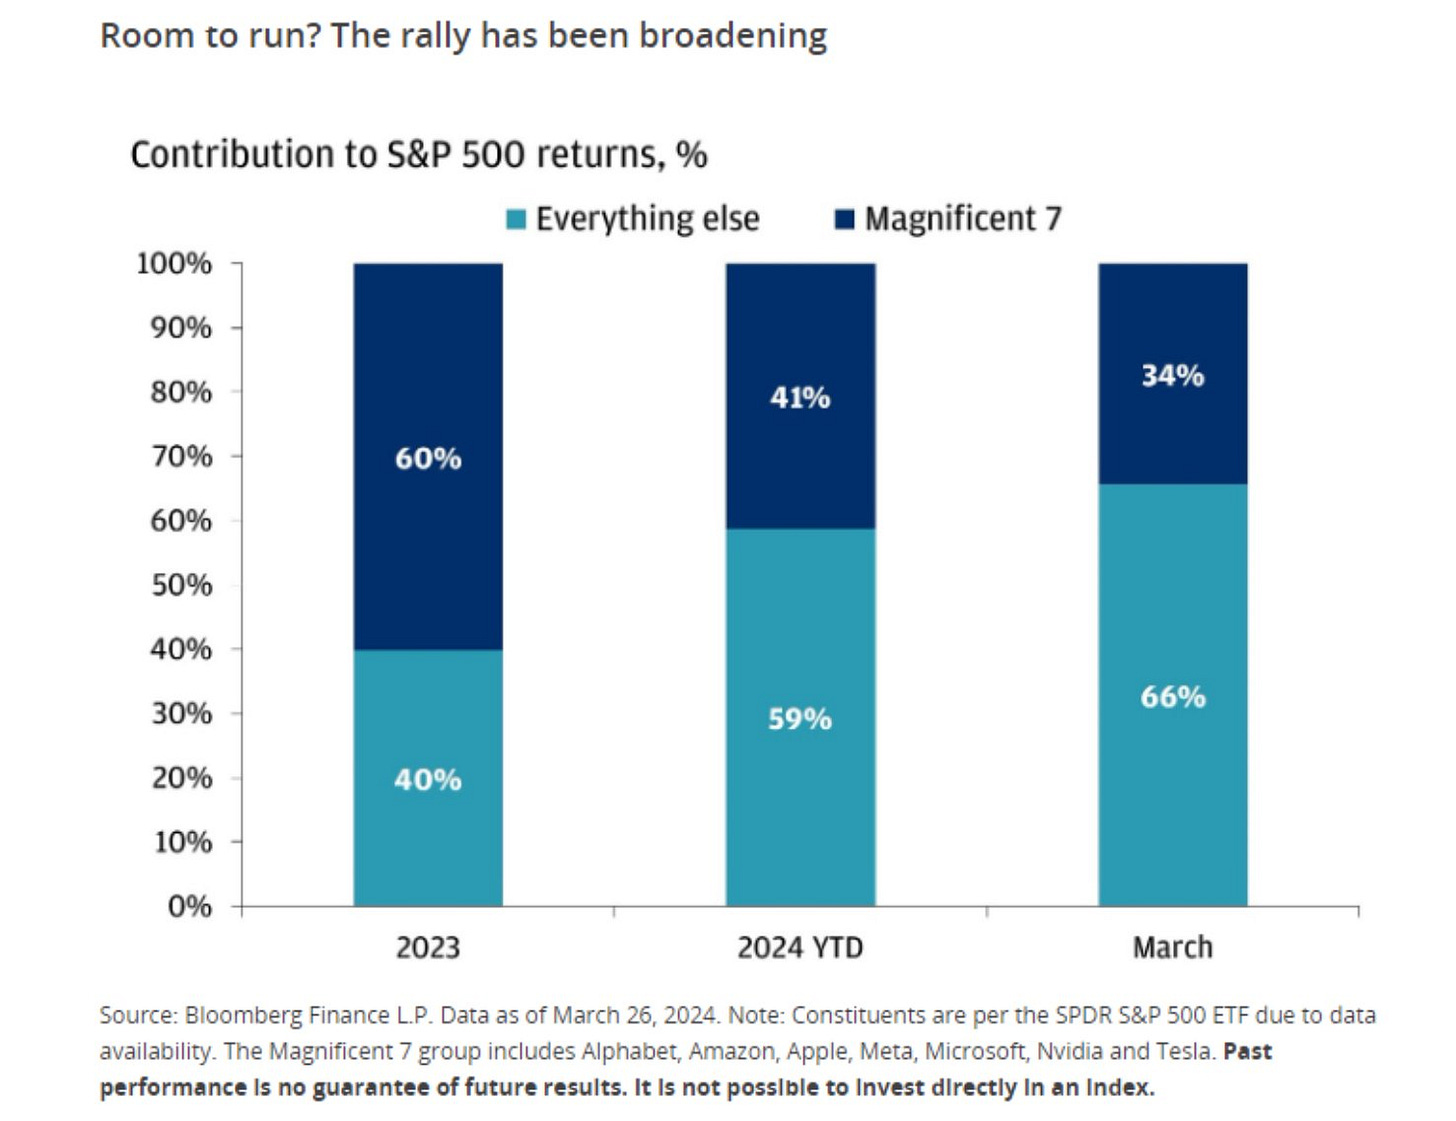
And while the Magnificent 7 still makes up nearly 30% of the S&P 500, their impact on the S&P’s gains are falling compared to last year. In the chart below, you can see that while the Magnificent 7 drove 60% of 2023’s return in the S&P, so far this year that figure is down to 41% and is shrinking further in March.
I also noted in this week’s market update that small-caps are working higher after back testing support from a key breakout over the $200 level, which served as resistance going back to early 2022. At the same time, the MACD is turning higher from the zero line while the RSI in the bottom panel is breaking above a recent range. The upside momentum is another positive development with expanding breadth.
And with the bullish catalysts lining up to support commodity prices, related miners and energy producers could be setting up the next round of breakouts to support the stock market rally. To that end, I’m watching the XME exchange-traded fund (ETF) that holds metals and mining stocks like Freeport-McMoRan (FCX) and Steel Dynamics (STLD).
After breaking out from a symmetrical triangle consolidation pattern, XME back tested price support and the resistance trendline from the triangle in the weekly chart below. Price is now testing the next resistance level around the $60 level, and is close to the high from 2022. Both the MACD and RSI are turning up from key support levels indicating an uptick in momentum.
That’s all for this week. Following inflation data, the Fed’s other mandate will be in the spotlight with the March jobs report due this week. The first quarter of 2024 also comes to a conclusion, with the next round of earnings reports starting in a couple weeks. I’ll be following how corporate outlooks evolve, but if demand trends are improving then expect that to show up in commodity prices.
I hope you’ve enjoyed The Market Mosaic, and please share this report with your family, friends, coworkers…or anyone that would benefit from an objective look at the stock market.
And make sure you never miss an edition by subscribing here:
For updated charts, market analysis, and other trade ideas, give me a follow on X: @mosaicassetco
And if you have any questions or feedback, feel free to shoot me an email at mosaicassetco@gmail.com
Disclaimer: these are not recommendations and just my thoughts and opinions…do your own due diligence! I may hold a position in the securities mentioned in this report.


