
The Market Mosaic 3.29.26
Interest Rates Loom as a Major Threat to the Stock Market.

👋Welcome back to The Market Mosaic, where I gauge the stock market’s next move by looking at macro, technicals, and market internals. I’ll also highlight trade ideas using this analysis.
If you find this report helpful please hit that “like” button, share this post, and become a subscriber if you haven’t already done so!
🚨And be sure to check out Mosaic Traders Hub. It’s a members-only platform to alert trade ideas, track a model portfolio of open positions, and further analyze the message coming from the capital markets.
Now for this week’s issue…
Uncertainty is running high around the war with Iran and if peace talks to end the conflict are even in sight. That’s leading a historic run of losses across both equity and debt markets.
While President Trump and multiple reports point to dialogue between the U.S. and Iran over the past week, Iran has mostly denied any interest in bringing the war to an end.
The ongoing tensions means that tanker traffic through the Strait of Hormuz remains limited, which continues placing strains on global energy markets along with uncertainty over access to fertilizer products for farming.
That’s weighing on the S&P 500, which has now closed out five consecutive weeks with a loss. That’s the longest streak of losses since the bear market in 2022, which also occurred alongside an energy crisis following Russia’s invasion of Ukraine.

While the situation in the Middle East is weighing on investor sentiment, the action in interest rates on both the short- and long-end of the yield curve is emerging as a key catalyst behind the drawdown in stock prices.
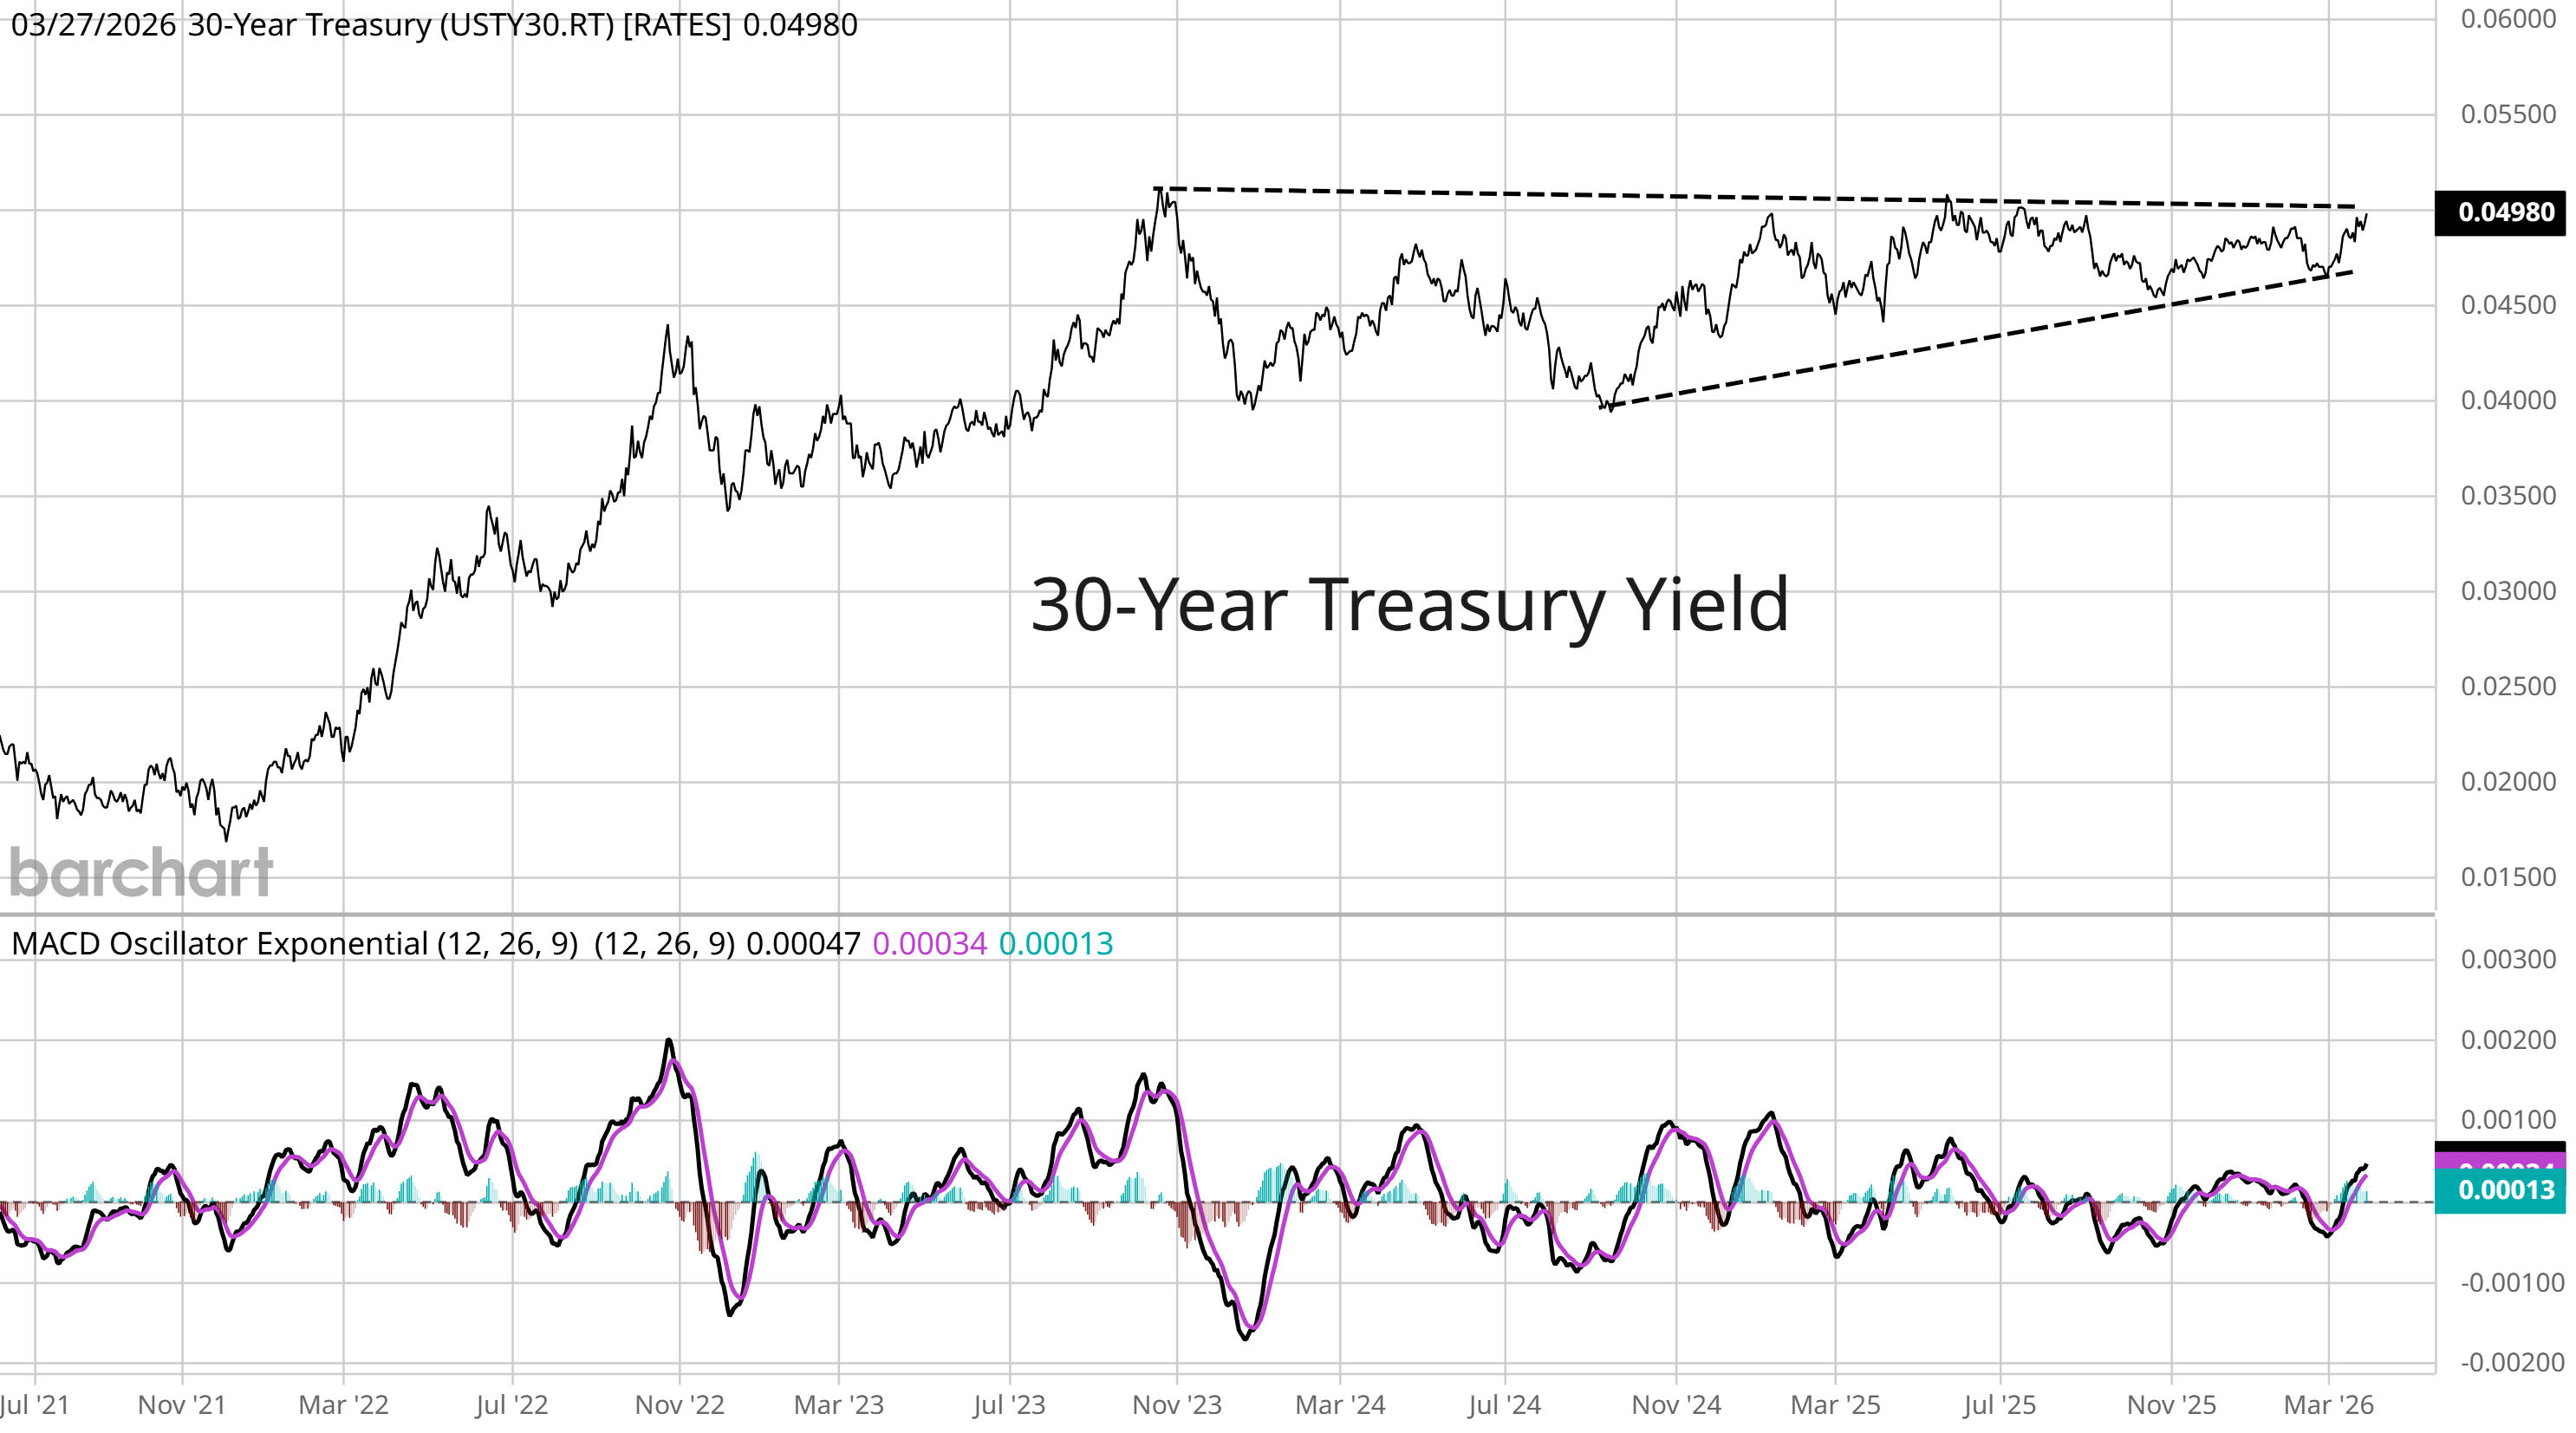
The outlook for rate cuts by the Federal Reserve is in jeopardy, while long-term rates are jumping higher as well due to uncertainty around inflation. The 30-year Treasury yield is close to breaking higher from an ominous pattern that could mean sharply higher rates ahead.
Sectors and themes with expensive valuations are particularly vulnerable to rising inflation and the rate outlook. After serving as the foundation for the bull market rally coming out of 2022’s bear market, the “Magnificent 7” are now leading the way lower and are down over 15% year-to-date.
This week, let’s look at the various catalysts threatening the outlook for higher interest rates and what that means for the stock market and artificial intelligence trade. We’ll also look at the rally in commodity prices, and why commodities could be in the early stages of a multi-year bull run.
The Chart Report
The war in the Middle East is creating a cascading impact on numerous markets through direct and indirect channels. The most direct impact is on energy prices including oil and natural gas. The growing risk of lasting damage on the global economy from high energy prices is pressuring the stocks market. But perhaps the most consequential spillover impact is on the outlook for inflation, and implications for interest rates on both the short- and long-end of the yield curve. Short-term rates are quickly rising as the market starts entertaining the thought of rate hikes, while the threat of rising inflation is causing longer-dated yields to rise as well. That’s sending the overall Treasury market to one of its worst months in the past five years (chart below).

In addition to the prospect for rising inflation to place upward pressure on interest rates, a wall of investment grade debt issuance is facing investors over the next 12 months. That includes $10 trillion of U.S. government debt that matures and needs refinanced (much of it from the pandemic era issued at much lower interest rates) and represents around a third of all Treasury debt outstanding (dark blue line in the chart below). At the same time, new borrowings totaling $4 trillion from government and corporate issuers are expected over the coming year, which means there is approximately $14 trillion in investment grade supply coming to market.

The combination of rising inflation and massive supply of investment grade debt coming to market is major threat to interest rates. The 30-year Treasury yield is already trading in a pattern that could point to a looming breakout in longer-dated rates. The chart below shows the 30-year Treasury yield, which is trading in a multi-year ascending triangle pattern with resistance at the 5.0% level (chart below). The 30-year is close to a major breakout over that level, which would put the 30-year at the highest level since 2007. Rising rates would challenge investors through a couple key avenues. Higher rates (and inflation) pressure stock market valuations, while rising rates also means falling bond prices. The combination of falling stock and bond prices hit retirement portfolios during 2022’s bear market.
The impact on valuations from rising inflation and uncertainty over the economic outlook pushed the S&P 500 to its fifth consecutive weekly loss, with the index now down 7% on the year. A key feature behind the decline is that former leaders have now become the market’s laggards. The “Magnificent 7” are all linked to the artificial intelligence (AI) trade in some way, and did much of the heavy lifting during the bull market that started alongside ChatGPT’s introduction in late 2022. But a combination of elevated valuations and questions around the sustainability of capex spending (and resulting debt issuance) is weighing on Mag 7 stock prices. The chart below shows that the Mag 7 is now down over 15% this year while the S&P 500 excluding the Mag 7 is down less than 5%.

While the sheer weight of the Mag 7 is dragging major indexes like the S&P 500 and Nasdaq lower, late-cycle sectors are experiencing strong rallies. That includes equities across energy-related sectors along with commodities. Commodities were already seeing a boost in recent years following the rally in precious metals followed by copper. The rally in commodities continues broadening, with oil prices driving the the most recent uptrend phase. But commodities could still be in the early stages of a multi-year bull market. The chart below plots a ratio of the commodity prices to the S&P 500. The ratio was pushed to historically low levels during the start of this decade and has only started to inflect higher. Past episodes of a depressed ratio led to sharp mean reversion with commodities outperforming stocks over a period lasting years.

Heard in the Hub
The Traders Hub features live trade alerts, market update videos, and other educational content for members.
Here’s a quick recap of recent alerts, market updates, and educational posts:
The key chart driving the S&P 500.
A crossover investors don’t want to see.
One trade setup that checks all the boxes.
Watch this breadth ratio if the rally has legs.
Choppy price action is here to stay in the months ahead.
You can follow everything we’re trading and tracking by becoming a member of the Traders Hub.
By becoming a member, you will unlock all market updates and trade alerts reserved exclusively for members.
Trade Idea
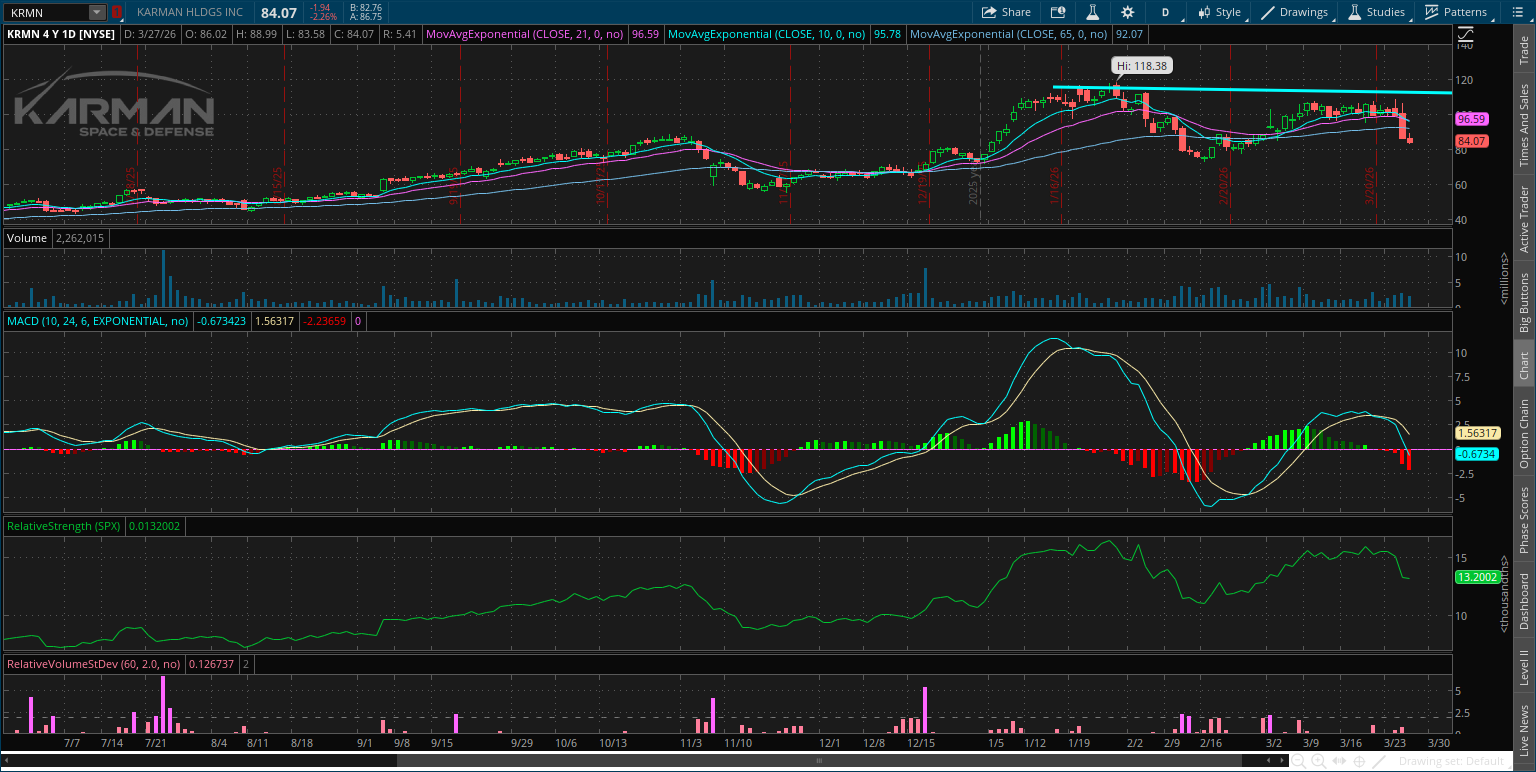
Karman Holdings (KRMN)
Karman peaked near $120 in January and started a new basing process. Following a drop into mid-February, KRMN rallied back toward resistance and is making a smaller pullback that’s resetting the MACD. I’m watching for a move over $110.
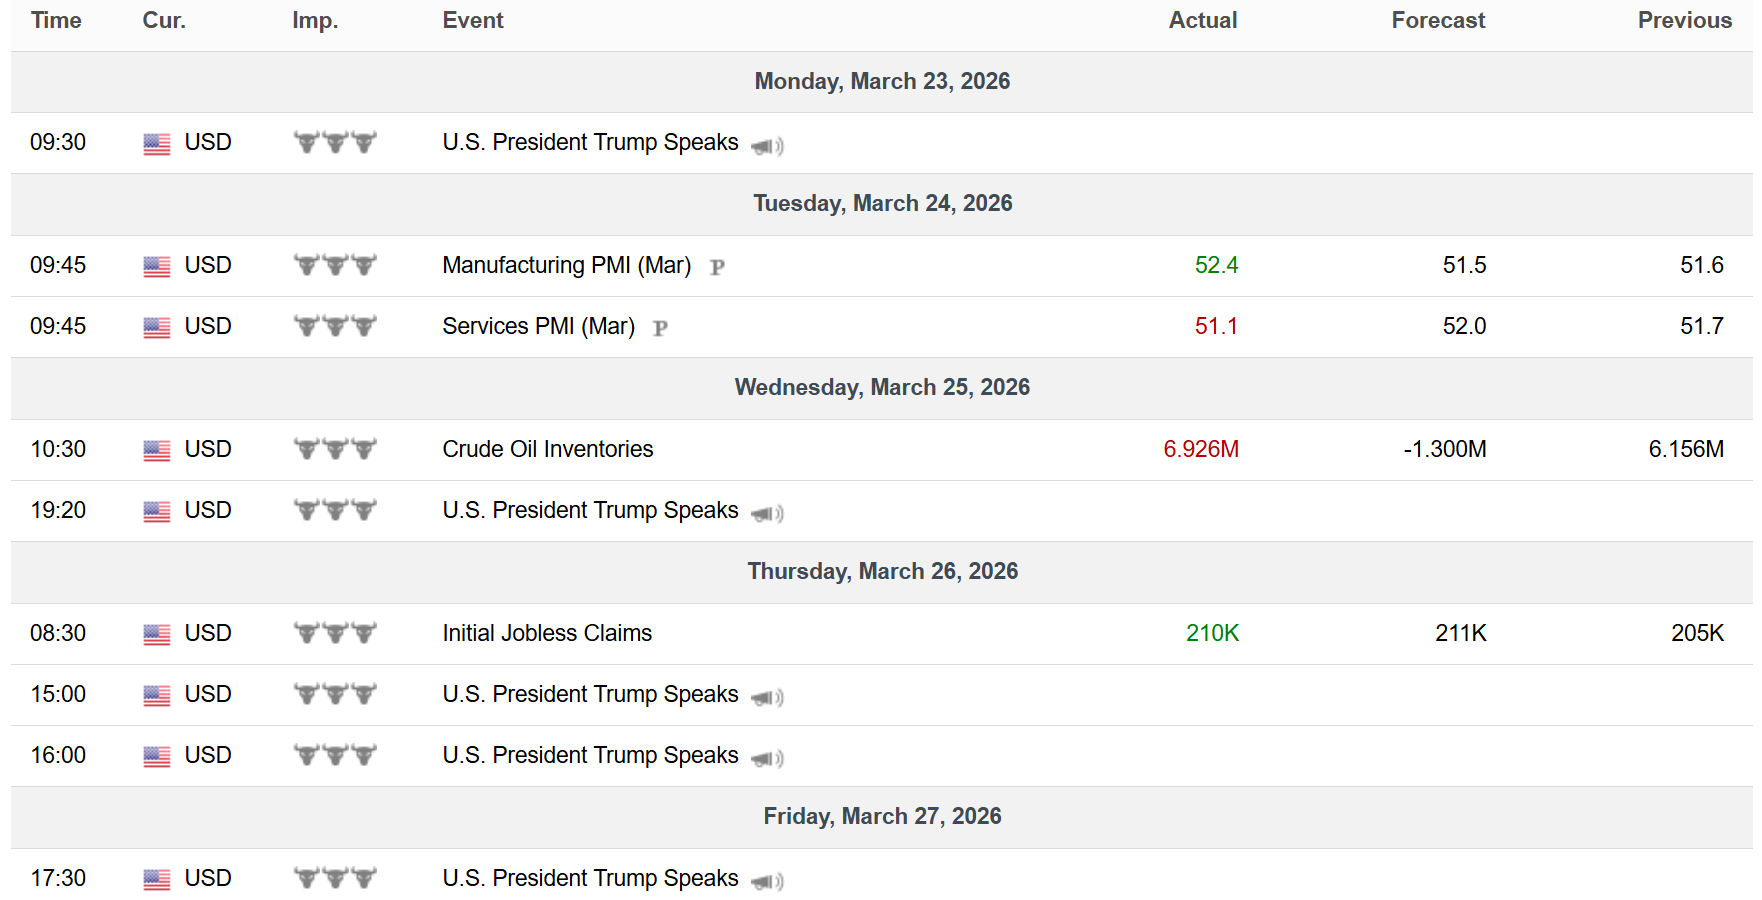
Key Upcoming Data
Economic Reports
Earnings Reports

I hope you’ve enjoyed The Market Mosaic, and please share this report with your family, friends, coworkers…or anyone that would benefit from an objective look at the stock market.
Become a member of the Traders Hub to unlock access to:
✅Model Portfolio
✅Members Only Chat
✅Trade Ideas & Live Alerts
✅Mosaic Vision Market Updates + More
Our model portfolio is built using a “core and explore” approach, including a Stock Trading Portfolio and ETF Investment Portfolio.
Come join us over at the Hub as we seek to capitalize on stocks and ETFs that are breaking out!
And if you have any questions or feedback, feel free to shoot me an email at mosaicassetco@gmail.com
Disclaimer: these are not recommendations and just my thoughts and opinions…do your own due diligence! I may hold a position in the securities mentioned in this report.