The Market Mosaic 3.26.23
The Fed's on a collision course with a liquidity crisis.
Welcome back to The Market Mosaic, where I gauge the stock market’s next move by looking at macro, technicals, and market internals. I’ll also highlight trade ideas using this analysis.
If you find this content helpful please hit that “like” button, share this post, and become a subscriber to this always free newsletter if you haven’t already done so!
And be sure to check out Mosaic Chart Alerts. It’s a midweek update covering my best chart setups among long and short ideas in the stock market, along with levels that could trigger a trade.
Now for this week’s issue…
Coming just days after the collapse of Credit Suisse, all eyes were on the Federal Reserve’s latest rate-setting meeting and Chair Jerome Powell’s message amidst the worst banking crisis since 2008.
After all, the central bank is stuck in a no-win situation. Pause the rate hiking campaign to help the financial sector, and the Fed risks looking soft on inflation. But continuing to increase interest rates threatens to make problems facing the bank sector even worse.
In the end, Powell delivered a hawkish surprise to the market last week. Not only did the Fed hike rates by another 0.25%, the meeting statement made it clear that more rate hikes are on the way.
An updated forecast of Fed members shows they expect the fed funds rate to end the year at 5.1%, implying at least another 0.25% increase. The chart below shows the Fed’s “dot plot”, which represents each voting member’s projection for the fed funds rate.
Not only are more rate hikes projected before year-end, but the balance sheet reduction via quantitative tightening will continue as planned. That removes another source of liquidity from the capital markets.
In other words, the Fed has no intention of easing up in the fight against inflation…but the market thinks otherwise.
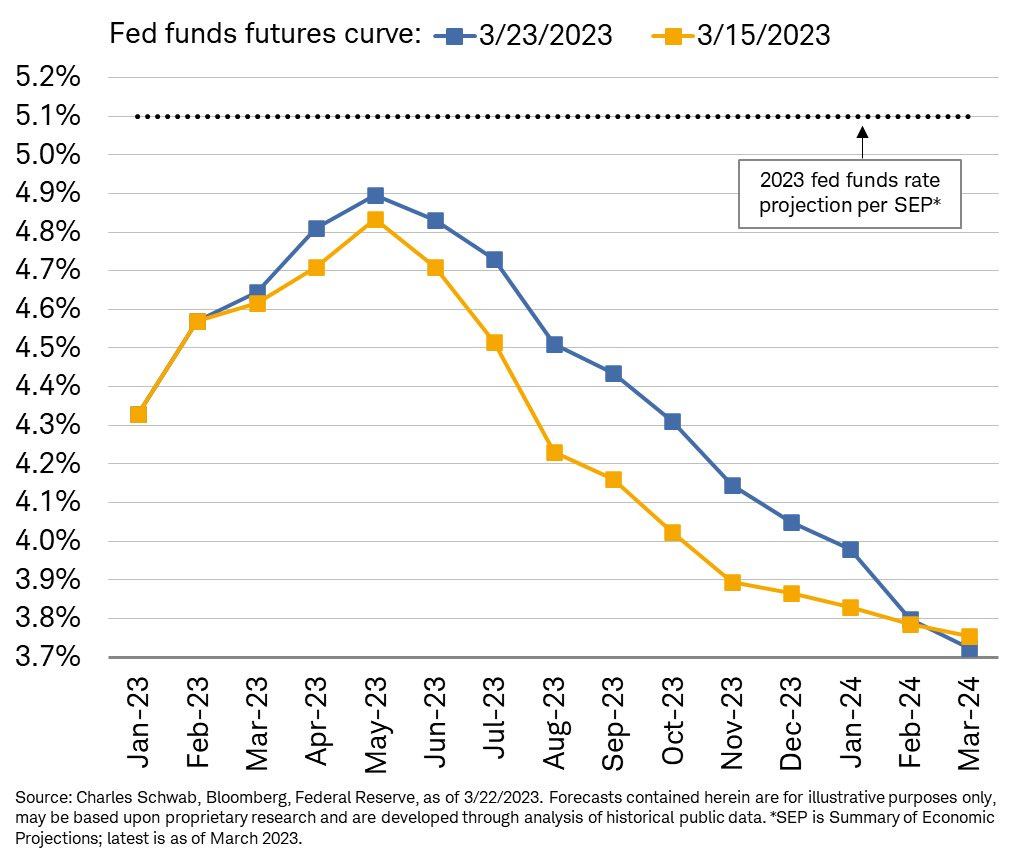
Market implied odds suggest a rate cut as soon as the Fed’s June meeting, with more before year end. You can see in the chart below that the market expects fed funds to end the year around 4.0%, which is a full percentage point below the Fed’s dot plot estimate.
That means there’s a massive gulf between what the Fed intends to do, and what the market thinks will actually happen. Here’s why such a large divide has developed, and what it could mean for the stock market outlook.
Financial Conditions Will Force A Pivot
During his post-meeting press conference, Powell acknowledged one critical outcome of the banking crisis that will boost the Fed’s inflation fight.
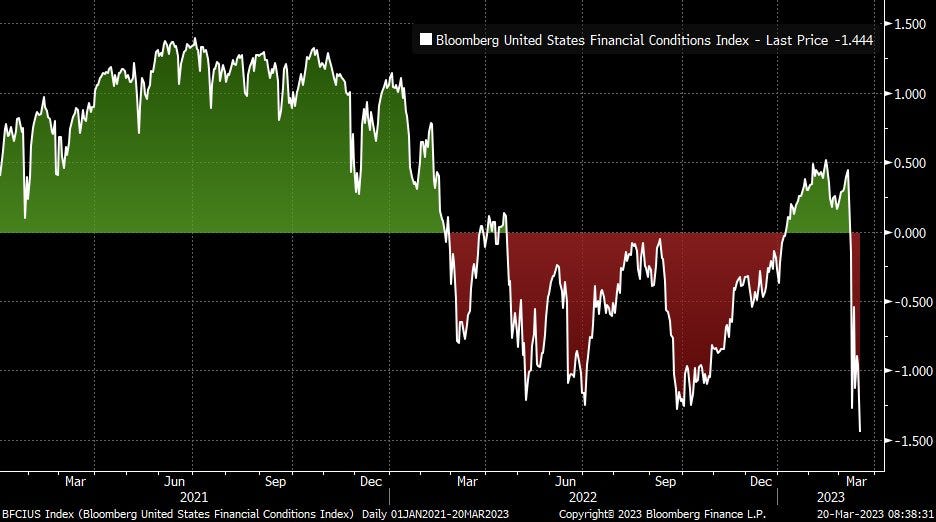
And that’s with financial conditions, which is a way to monitor how stress across the capital markets could impact economic activity. By Powell’s estimate, recent tightening in financial conditions could be the equivalent of an extra 0.25% rate hike…but that view may prove too conservative.
One economist put the estimated cost of bank sector volatility at an additional 1.5% in higher rates, or six times Powell’s estimate. That’s because some measures of financial conditions have worsened to levels not seen since the onset of the pandemic in early 2020 as you can see in the chart below.
Here’s one example of tighter financial conditions in action. With the turmoil in the bank industry, many financial firms are being forced to curtail lending activity and adopt a more conservative approach to shore up balance sheets and liquidity.
That broadly translates to less credit availability across the economy, which in turn slows activity. You’re already seeing that show up with tightening lending standards across small and large banks alike. The chart below shows the percentage of banks with stricter lending terms for commercial and industrial loans. At about 45%, that metric is hitting levels that have historically accompanied recessions (shaded areas).
Plus other signs of stress across the capital markets are not abating. Just look at borrowings from the Fed’s discount window. This is meant to provide access to funds during emergencies, and is supposed to be a last resort for banks facing liquidity strains. You can see in the chart below that banks are flocking to the discount window at a rate rivaling even the 2008 financial crisis, with over $150 billion tapped in recent weeks.
Much tighter financial conditions and ongoing signs of bank stress are major reasons why the market thinks the Fed will be forced to abandon their plans.
And while it may seem like a good thing if the Fed does an about face on rate hikes, you should consider the historical precedent of policy pivots and what it means for the stock market.
Now What…
The market clearly thinks the Fed is not placing enough weight on worsening financial conditions, which will lead to a policy pivot sooner than expected.
If the Fed does pause the rate hiking campaign, it will signal growing concerns that the central bank is breaking something in the capital markets. But also consider that the Fed has a track record of adjusting policy only when it’s too late.
As a result, in past bear markets the steepest stock market declines happened after the Fed pivots to a pause or outright rate cuts as I posted about below.
While the big picture backdrop highlights the negative implications of a pivot and risks of further contagion from the bank crisis, I’m not adopting a very bearish outlook in my own positioning just yet.
As always, the goal is to stay objective in our analysis while reading and reacting to conditions as they evolve. I’m still maintaining a heavy cash position, and that will remain the case until I start to see an expansion in breakouts from my long watchlist shared in Mosaic Chart Alerts.
But in last week’s Market Mosaic, I gave you three conditions that would signal a spillover of bank sector woes into the broader economy and stock market. So far, those metrics are not warning of broadening deterioration.
Plus market internals remain in a state that would favor a rally, including extremely oversold breadth and bearish sentiment. We’re also in the midst of a positive seasonal period, while it’s also encouraging that the percent of stocks trading above their 20-day moving average is finally turning higher off a depressed level as you can see below.
If we can see better traction in the markets, several stocks remain on my focus list for a long position. That includes GFS that I’ve posted about frequently, while my scans have turned up favorable setups in a couple new trade ideas. Such as SKY, where you can see the stock trading just under the $72 resistance level while the MACD has reset at the zero line and relative strength is hovering near the highs.
I also posted this about the ascending triangle setup in SFM, which is trading just under resistance at $35:
Even if I see a scenario to add new positions, I will continue to position size more conservatively as has been the case since last year. That will remain a core component of my risk management strategy until the backdrop becomes more favorable to support a new bull market.
That’s all for this week. While I believe market internals favor a tactical bounce in stocks, the big picture backdrop remains challenging for equities. This trading environment continues to favor a flexible approach, where quickly adapting to evolving conditions will help keep you on the right side of the trade.
I hope you’ve enjoyed this edition of The Market Mosaic, and please share this newsletter with your family and friends…or anyone that would benefit from an objective look at the stock market.
And make sure you never miss an edition by subscribing here:
For updated charts, market analysis, and other trade ideas, give me a follow on Twitter: @mosaicassetco
And if you have any questions or feedback, feel free to shoot me an email at mosaicassetco@gmail.com
Disclaimer: these are not recommendations and just my thoughts and opinions…do your own due diligence! I may hold a position in the securities mentioned in this newsletter.


