
The Market Mosaic 3.2.25
Cracks in the economic growth outlook?

👋Welcome back to The Market Mosaic, where I gauge the stock market’s next move by looking at macro, technicals, and market internals. I’ll also highlight trade ideas using this analysis.
If you find this content helpful please hit that “like” button, share this post, and become a subscriber if you haven’t already done so!
And be sure to check out Mosaic Traders Hub. It’s a members-only platform to alert trade ideas, track a model portfolio of open positions, and further analyze the message coming from the capital markets.
🚨You can start a 7-day free trial to the Hub by clicking here. By starting a trial, you will unlock all market updates and trade alerts reserved exclusively for members.
Now for this week’s issue…
A week mostly void of any major economic report saw more stock market volatility nonetheless.
And while the S&P 500 is only 3% off the high, uncertainty over geopolitical events are leading to a surge in investor pessimism.
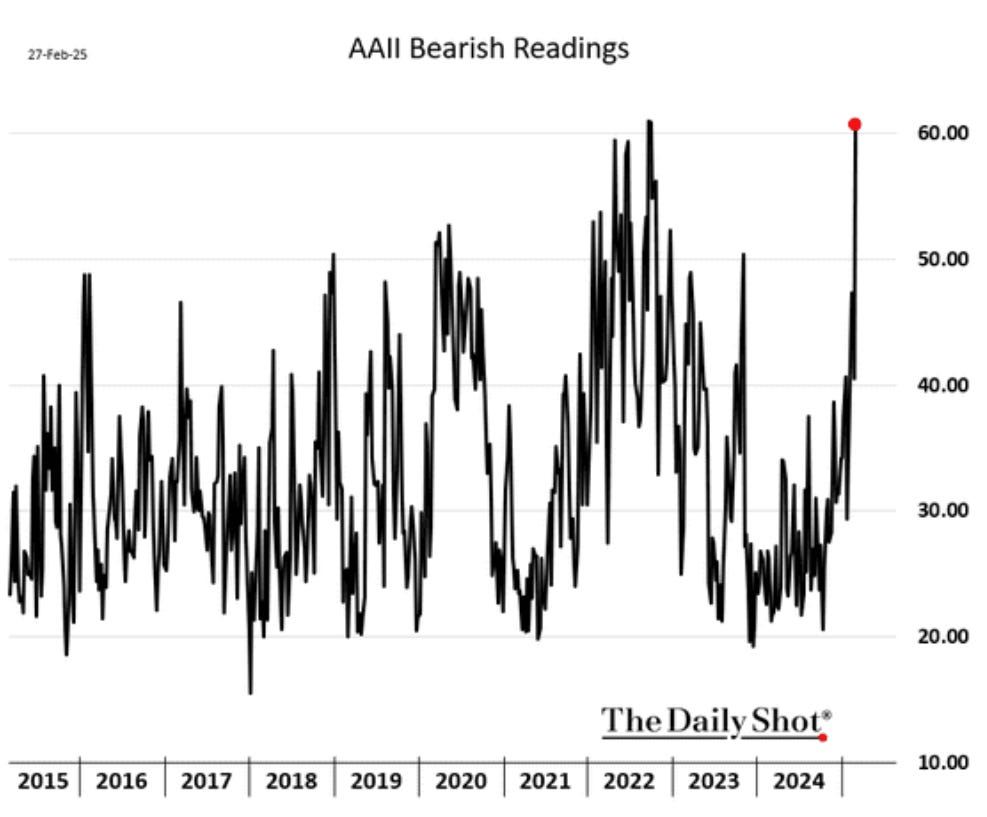
Last week’s AAII survey of retail investors saw the percentage of bearish views jump to 60.6% from 40.5% the week before. That’s the largest number of bears since 2022’s market decline, and is the seventh highest level since the survey began in 1987.
That same uncertainty is also helping lead to more sharp swings in the S&P 500. The index fell below the 50-day moving average last week, and is testing that support level from below following a late-day rally on Friday.
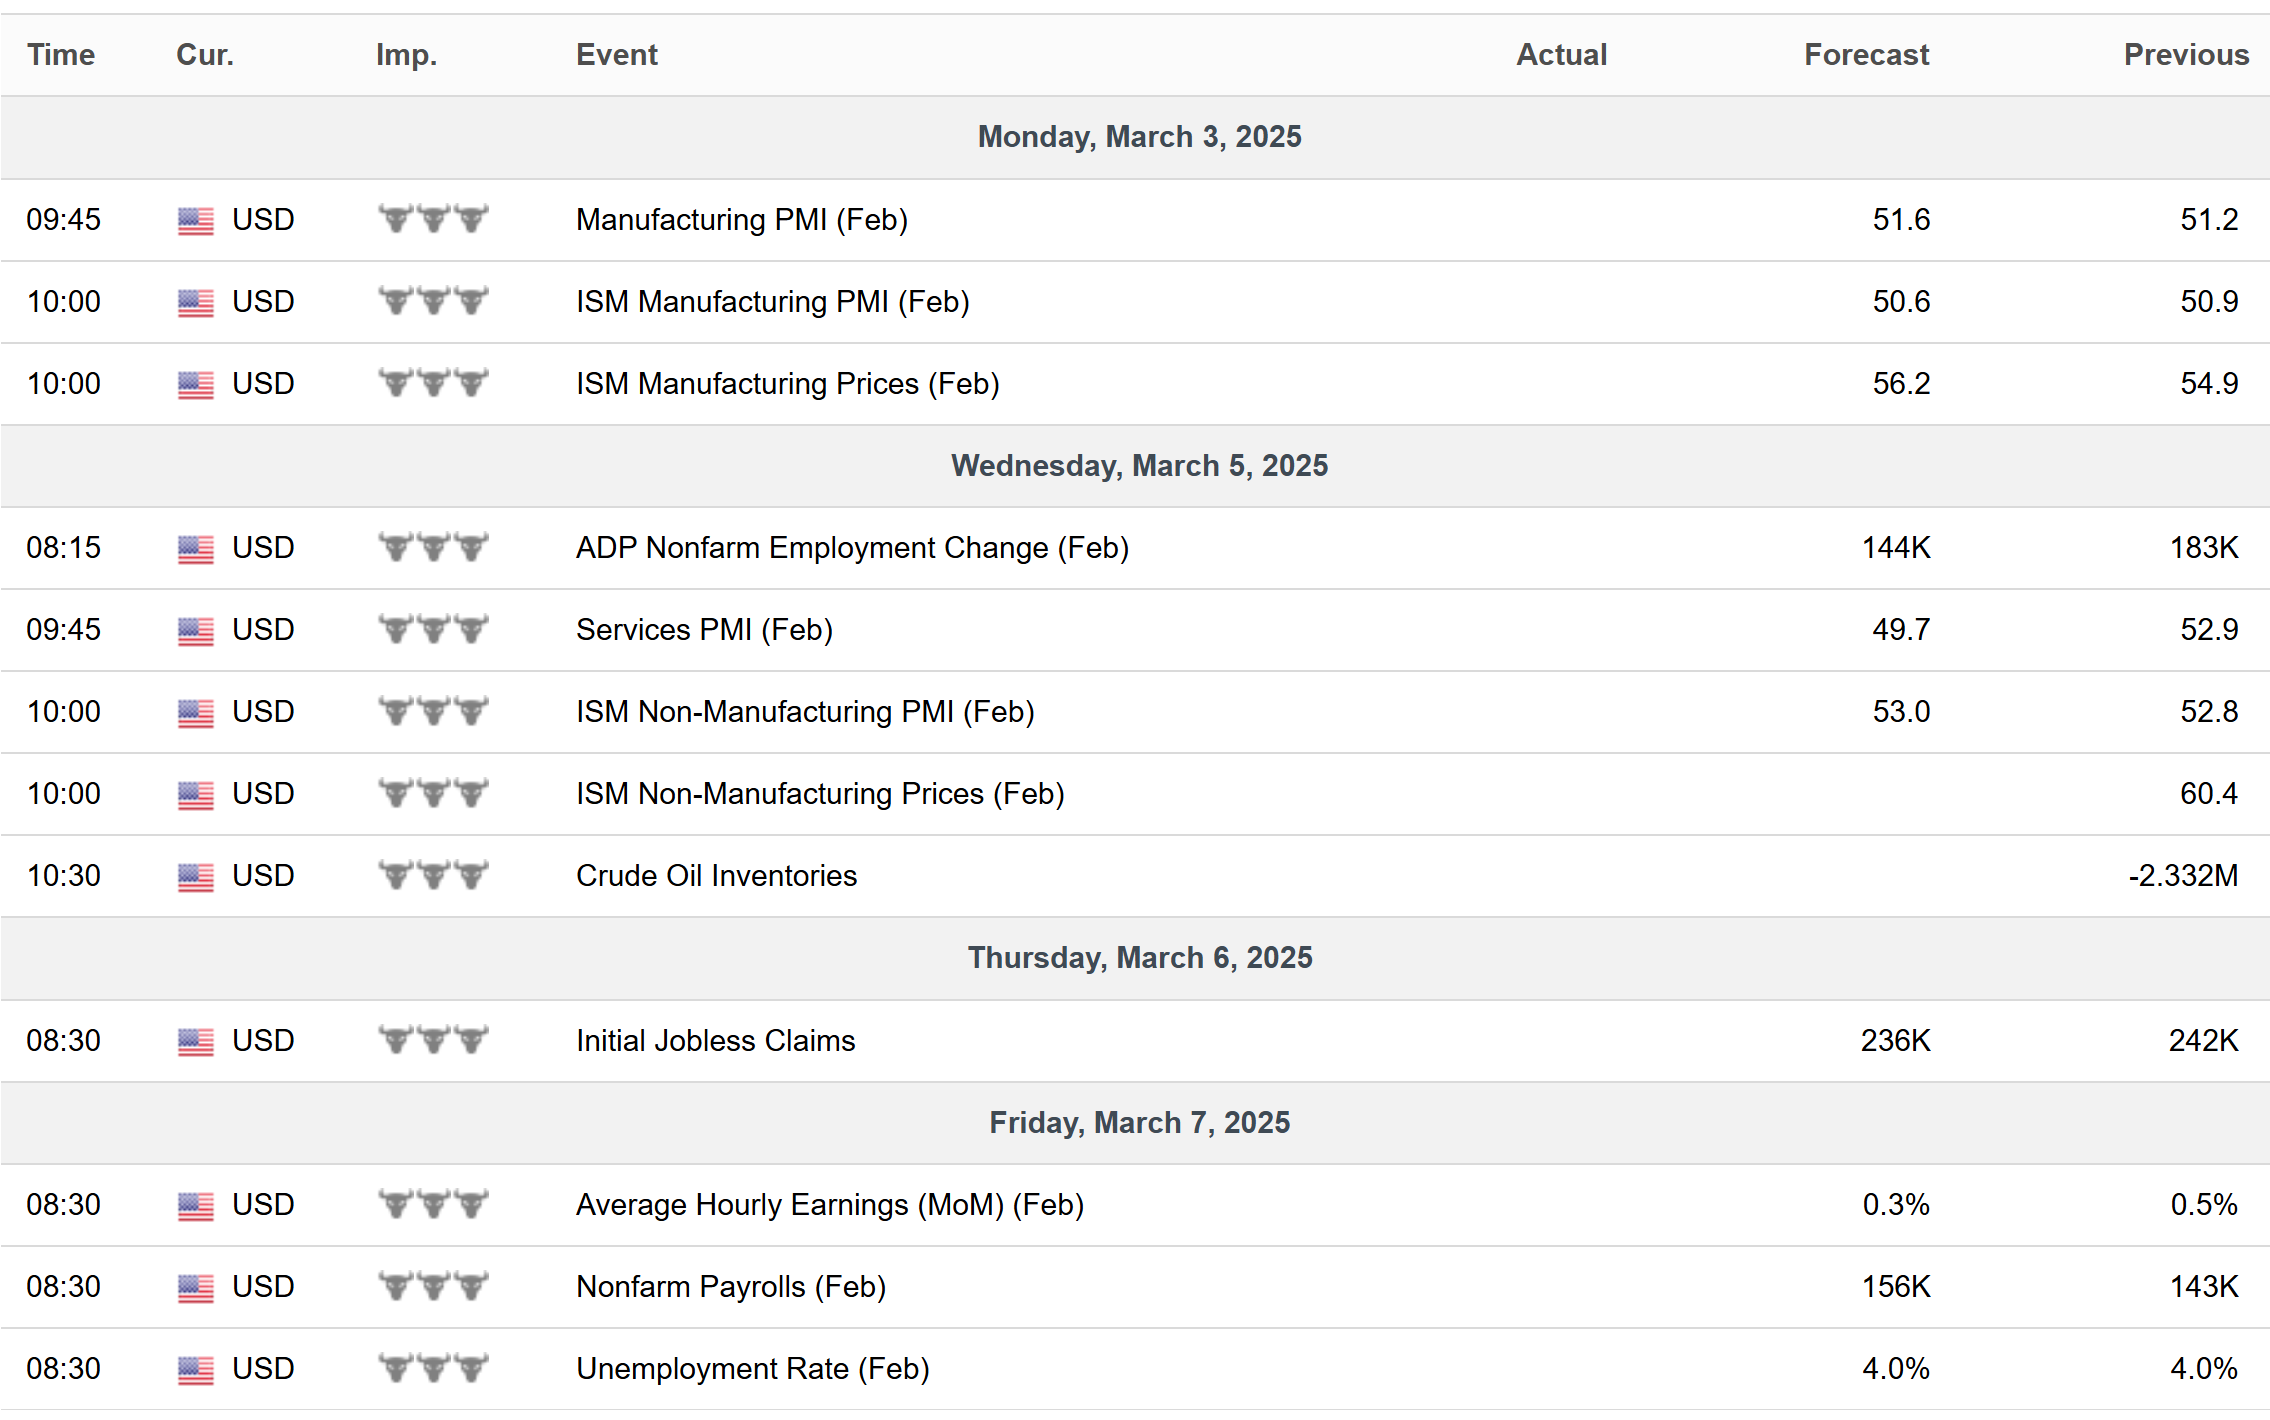
Investors are digesting developments around the situation in Ukraine, while also preparing for a big week ahead with reports covering manufacturing and service sector activity along with the February payrolls figure.
Another closely followed gauge of economic activity is deteriorating sharply, showing that the economy is contracting during the first quarter.
Yet conditions are evolving that could support a rally. At the same time, the calendar becomes more favorable in March, which has been the best month during the first half of the year on average for the past 15 years.
This week, let’s look at factors that could help point the S&P 500 back higher. I also want unpack charts tracking the state of the economy and what it could mean for the outlook for monetary policy.
The Chart Report
The Atlanta Fed’s GDPNow model of estimated current quarter GDP growth is deteriorating sharply. After pointing to an annualized growth rate of 2.3% just a week ago, the current estimate fell to -1.5%. But looking further into the details, it appears a surge in imports ahead of any tariffs are likely to blame for the drop (which impacts net exports). While retail sales data is weakening recently and impacting estimates of consumer spending, net exports are to blame for most of the recent drop in growth estimates. The chart below plots the contributions by component of the GDPNow estimate.

Rising uncertainty over the economic outlook might put more rate cuts by the Fed back on the table. The chart below overlays the 2-year Treasury yield (black line) with the fed funds rate (blue line). The 2-year has a history of leading changes in the fed funds rate, and recently rose back toward the current level of fed funds as disinflation stalled out. But with the growth outlook in question, the 2-year is now trading 0.51% below fed funds. That suggests the market is pricing two quarter point rate cuts ahead.

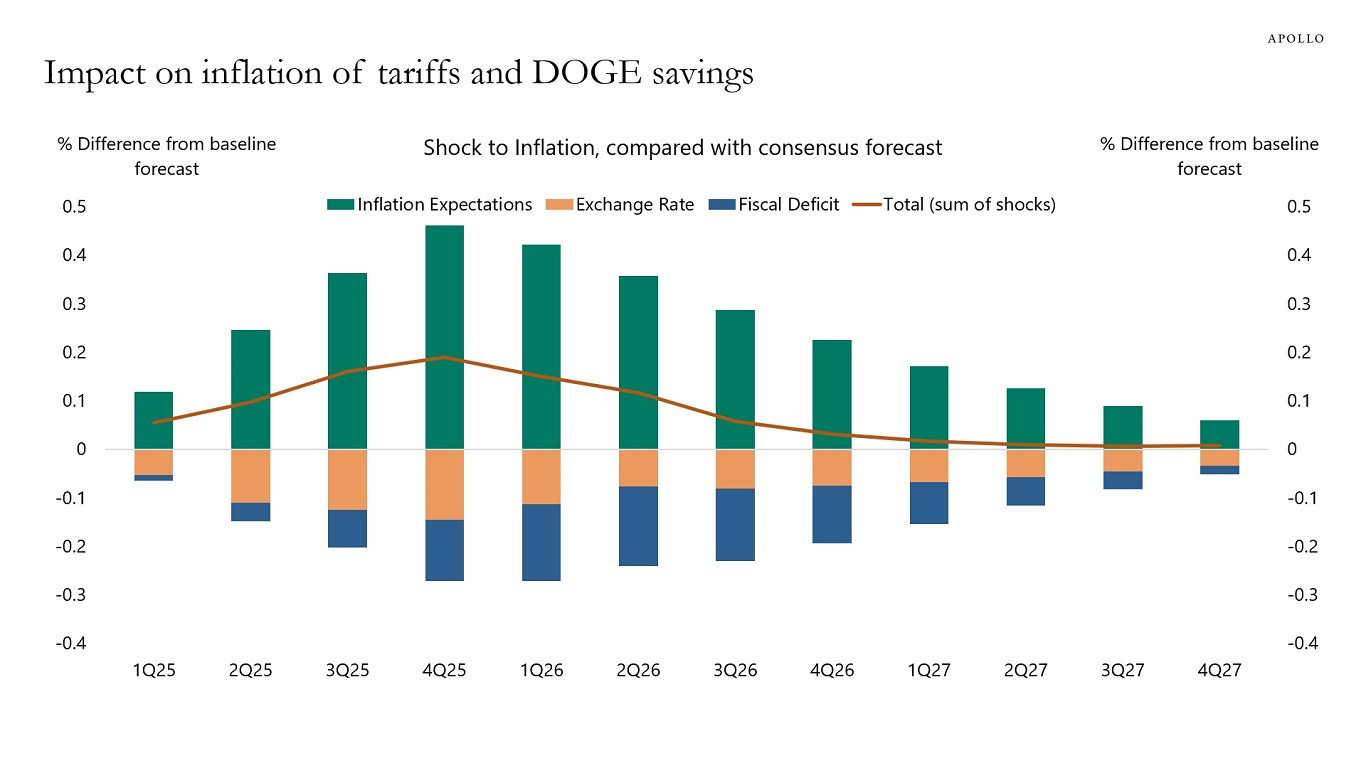
Inflation could still complicate plans for the Fed to cut interest rates much further. The Fed’s preferred inflation gauge, which is the personal consumption expenditures (PCE) price index, fell to 2.5% in January and was in line with estimates. But the cumulative net impact of expected inflation, known tariff policies, and efforts to reduce government spending could still boost inflation over the coming quarters. The chart below plots the impact to inflation relative to forecasts by factoring estimates from various shocks (inflationary and deflationary). You can see the net impact is higher that estimated inflation through the end of next year.
Investors are confronting economic policy uncertainty on numerous fronts, which is sending an index tracking policy uncertainty to record levels even surpassing the pandemic. But looking back, extreme levels of uncertainty are associated with positive forward returns in the S&P 500. The chart below plots the percentile readings (bottom panel) of the US Economic Policy Uncertainty News Index. When the index jumps into the 90th percentile, the S&P 500’s forward return three months out is 8.5% with a 77% win rate historically.

Economic uncertainty is also driving extreme levels of bearishness among investors as noted above. As a contrarian signal, that’s a positive condition to help see a rally unfold. At the same time, stock market breadth is nearing oversold territory. The chart below shows the percent of stocks across the market trading above their 20-day moving average. This metric originally flashed a negative breadth divergence as the S&P 500 was making a new high in late February. But now the pullback has this measure at 27% last week (arrow on the chart). While that’s not quite to the 20% or lower threshold that serves as a reliable oversold indicator, it’s within range of oversold levels that have seen a bounce unfold on several occasions since last summer.

Bearish investor sentiment and oversold breadth are conditions that can help see a rally unfold. Near-term, seasonality and cycle trends for the S&P 500 can become a tailwind as well. The last two week’s of February are historically among the most negative for the S&P 500, but March is the best month during the first half of the calendar year for the past 15 years on average. The chart below also plots the S&P 500 according to various cycles. The first half of March tends to be strong followed by a weaker second half. After that, trends are strong from April into the summer months.

Heard in the Hub
The Traders Hub features live trade alerts, market update videos, and other educational content for members.
Here’s a quick recap of recent alerts, market updates, and educational posts:
A fundamental metric that can help drive gold stocks higher.
The chart that matters most following Nvidia’s earnings report.
Using cyclical sectors to spot key inflection points in the S&P 500.
What “supercore” inflation says about the outlook for commodities.
You can follow everything we’re trading and tracking by becoming a member of the Traders Hub.
By becoming a member, you will unlock all market updates and trade alerts reserved exclusively for members.
👉You can click here to join now👈
Trade Idea
Futu Holdings (FUTU)
China-based brokerage stock tested the $125 level in October then started a new consolidation phase. FUTU pulled back into January, then rallied to test $125 again. The stock is making a smaller decline off resistance that’s resetting the MACD above the zero line. I’m watching for a move over $125.

Key Upcoming Data
Economic Reports
Earnings Releases

I hope you’ve enjoyed The Market Mosaic, and please share this report with your family, friends, coworkers…or anyone that would benefit from an objective look at the stock market.
Become a member of the Traders Hub to unlock access to:
✅Model Portfolio
✅Members Only Chat
✅Trade Ideas & Live Alerts
✅Mosaic Vision Market Updates + More
Our model portfolio is built using a “core and explore” approach, including a Stock Trading Portfolio and ETF Investment Portfolio.
Come join us over at the Hub as we seek to capitalize on stocks and ETFs that are breaking out!
And if you have any questions or feedback, feel free to shoot me an email at mosaicassetco@gmail.com
Disclaimer: these are not recommendations and just my thoughts and opinions…do your own due diligence! I may hold a position in the securities mentioned in this report.