
The Market Mosaic 3.22.26
Investors Brace for Seismic Shift in the Rate Outlook.

👋Welcome back to The Market Mosaic, where I gauge the stock market’s next move by looking at macro, technicals, and market internals. I’ll also highlight trade ideas using this analysis.
If you find this report helpful please hit that “like” button, share this post, and become a subscriber if you haven’t already done so!
🚨And be sure to check out Mosaic Traders Hub. It’s a members-only platform to alert trade ideas, track a model portfolio of open positions, and further analyze the message coming from the capital markets.
Now for this week’s issue…
As the war in the Middle East drags on, spillover effects are being felt across various segments of the capital markets which is threatening catalysts behind the bull market.
Oil prices are hovering near their highs following the outbreak of the conflict and closed the week trading at nearly $98 per barrel. Other distortions are being felt in energy markets around the world, especially following Iran’s attack on the largest liquified natural gas facility in the world.
The prospect of a sustained increase in energy prices is being felt at a time when inflation is already inflecting higher. The latest headline Producer Price Index (PPI) jumped by 3.4% in February compared to last year while the core figure that excludes food and energy prices increased by 3.9%.
PPI inflation will often lead changes in consumer inflation measures, with inflation reports not yet reflecting the breakout of war in the Middle East and ensuing impact on energy prices.
At the same time, the Federal Reserve elected to keep interest rates steady at a range of 3.50-3.75% at their meeting last week, while also increasing forecasts for inflation. Fed chair Jerome Powell acknowledged the economic impact of the war on Iran is uncertain while also reiterating the Fed’s long-term inflation target is 2%.
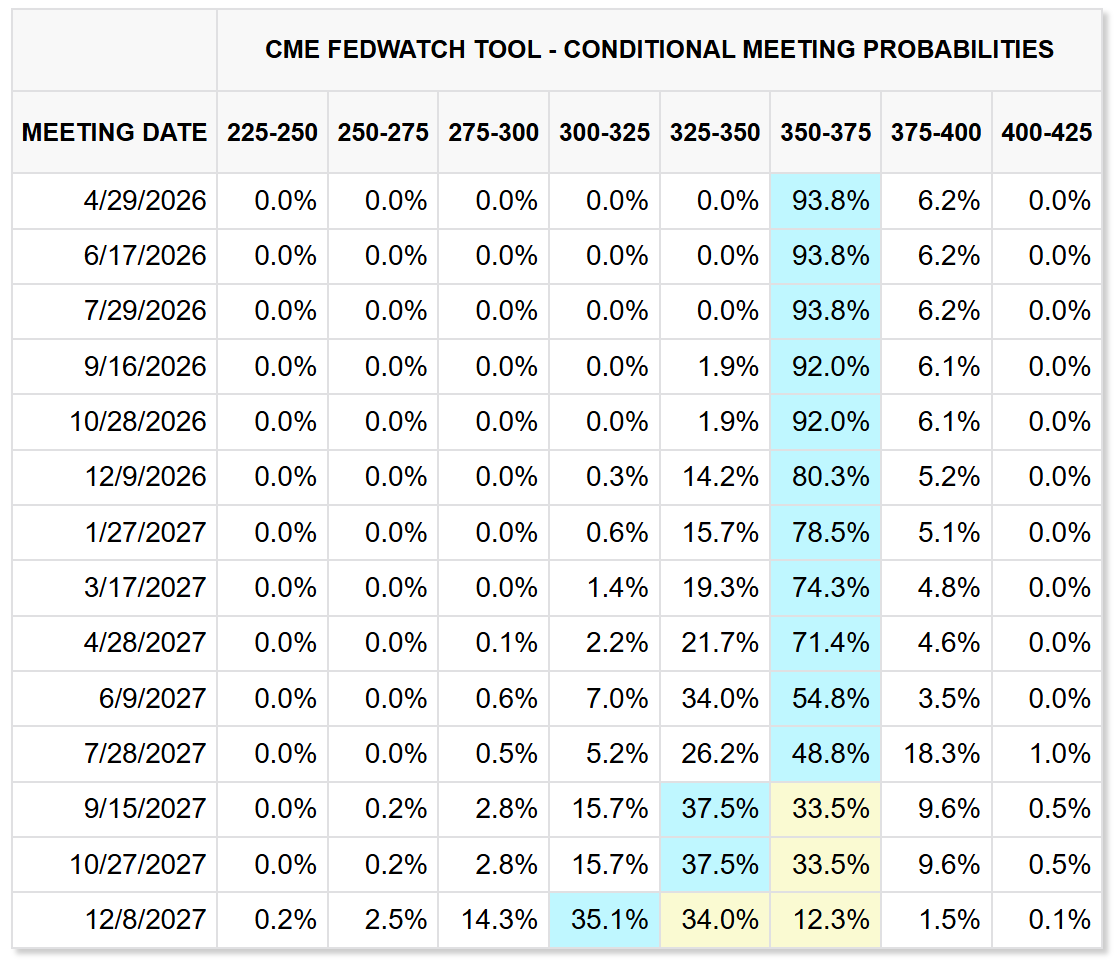
But the problem is that the Fed’s preferred inflation gauge hasn’t been below 2% since February 2021, with the threat that inflation could inflect sharply higher in the months ahead. As a result, market-implied odds aren’t pointing to another rate cut until September 2027 (chart below).
The outlook for monetary policy is quickly turning bearish for equity markets, with one key leading indicator for rates crossing a threshold pointing to tighter policy ahead.
This week, let’s look at the link between surging oil prices and recessions, along with the massive shift in the outlook for monetary policy that’s underway. While challenges to the market outlook are growing, conditions favor a short-term rally for the S&P 500.
The Chart Report
Developments in the Middle East continue unfolding at a quick and unpredictable pace. Shortly following the stock market close on Friday, President Trump posted that the military operation against Iran could soon wind down. That was followed by threats to take out Iran’s power generation facilities if it didn’t reopen the Strait of Hormuz. Iran threatened to respond by targeting energy infrastructure across the region. That’s keeping upside pressure on oil prices, which is recently crossing a key threshold historically associated with recession. Oil prices have jumped 50% above trend, which has been seen before or during nearly every recession over the past 50 years (chart below).

Oil prices are directly correlated to headline inflation, where a $10 increase per barrel can push inflation higher by 0.20% or more. And even before the outbreak of conflict in the Middle East, there are growing signs that inflation is already inflecting higher. Core PPI, which tends to lead consumer inflation, jumped to 3.9% in February while the Fed’s preferred core PCE inflation gauge gained 3.1% in January and was the highest level in over two years. With inflation already accelerating and set to receive another boost from energy prices, the inflation cycle from the 1970s continues tracking closely. The chart below overlays the 1970s cycle (blue line) with CPI inflation (red line), along with 1-year inflation breakeven rates (dashed brown line). If this cycle continues tracking, then consumer inflation could be starting another wave higher following the wave into mid-2022.

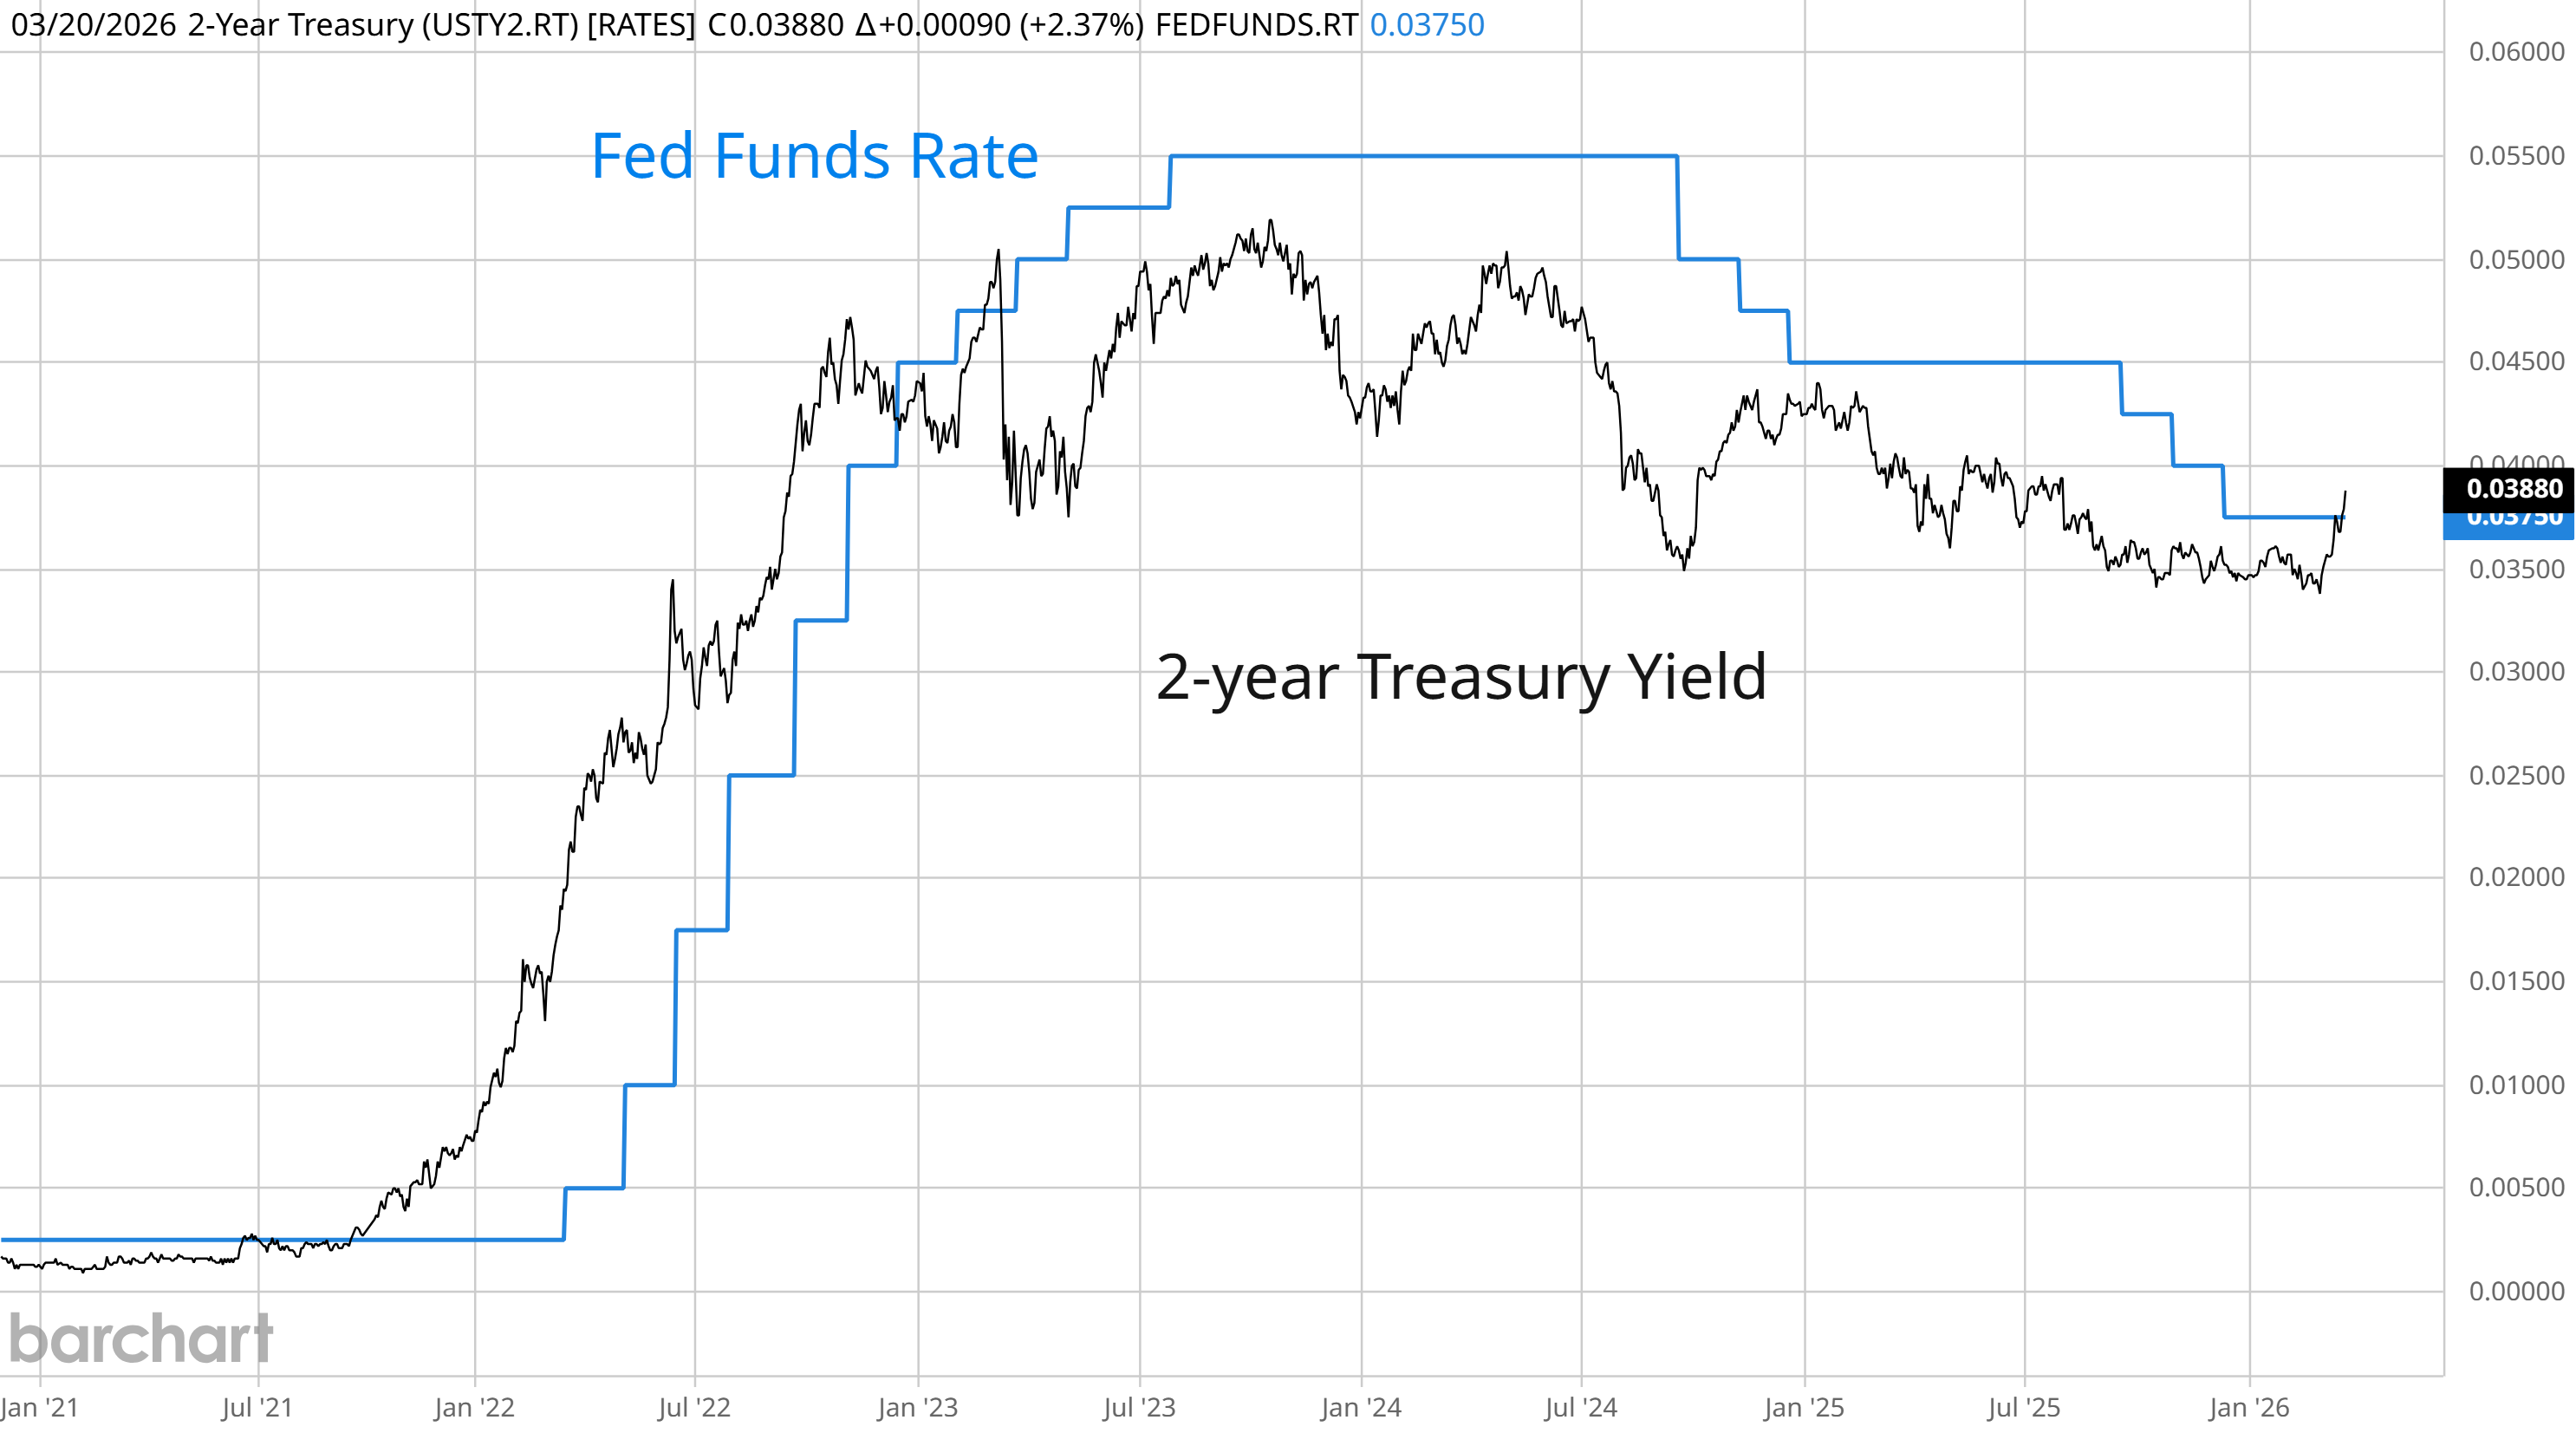
Despite recent weakening in labor market data, the Fed is executing a hawkish shift in policy stance toward the inflation outlook. That move was already underway before hostilities broke out in the Middle East, which is injecting yet more uncertainty into the outlook for inflation. As a result, the market is quickly repricing the outlook for rate cuts. While market-implied odds don’t point to another rate cut for over a year, another key indicator is suggesting that rate hikes could be in store. The 2-year Treasury yield historically leads changes in the fed funds rate. For the first time since 2023, the 2-year yield is crossing above the upper bound of the current fed funds target. If the move is sustained, the bond market is cautioning that rate hikes by the Fed are becoming more likely.
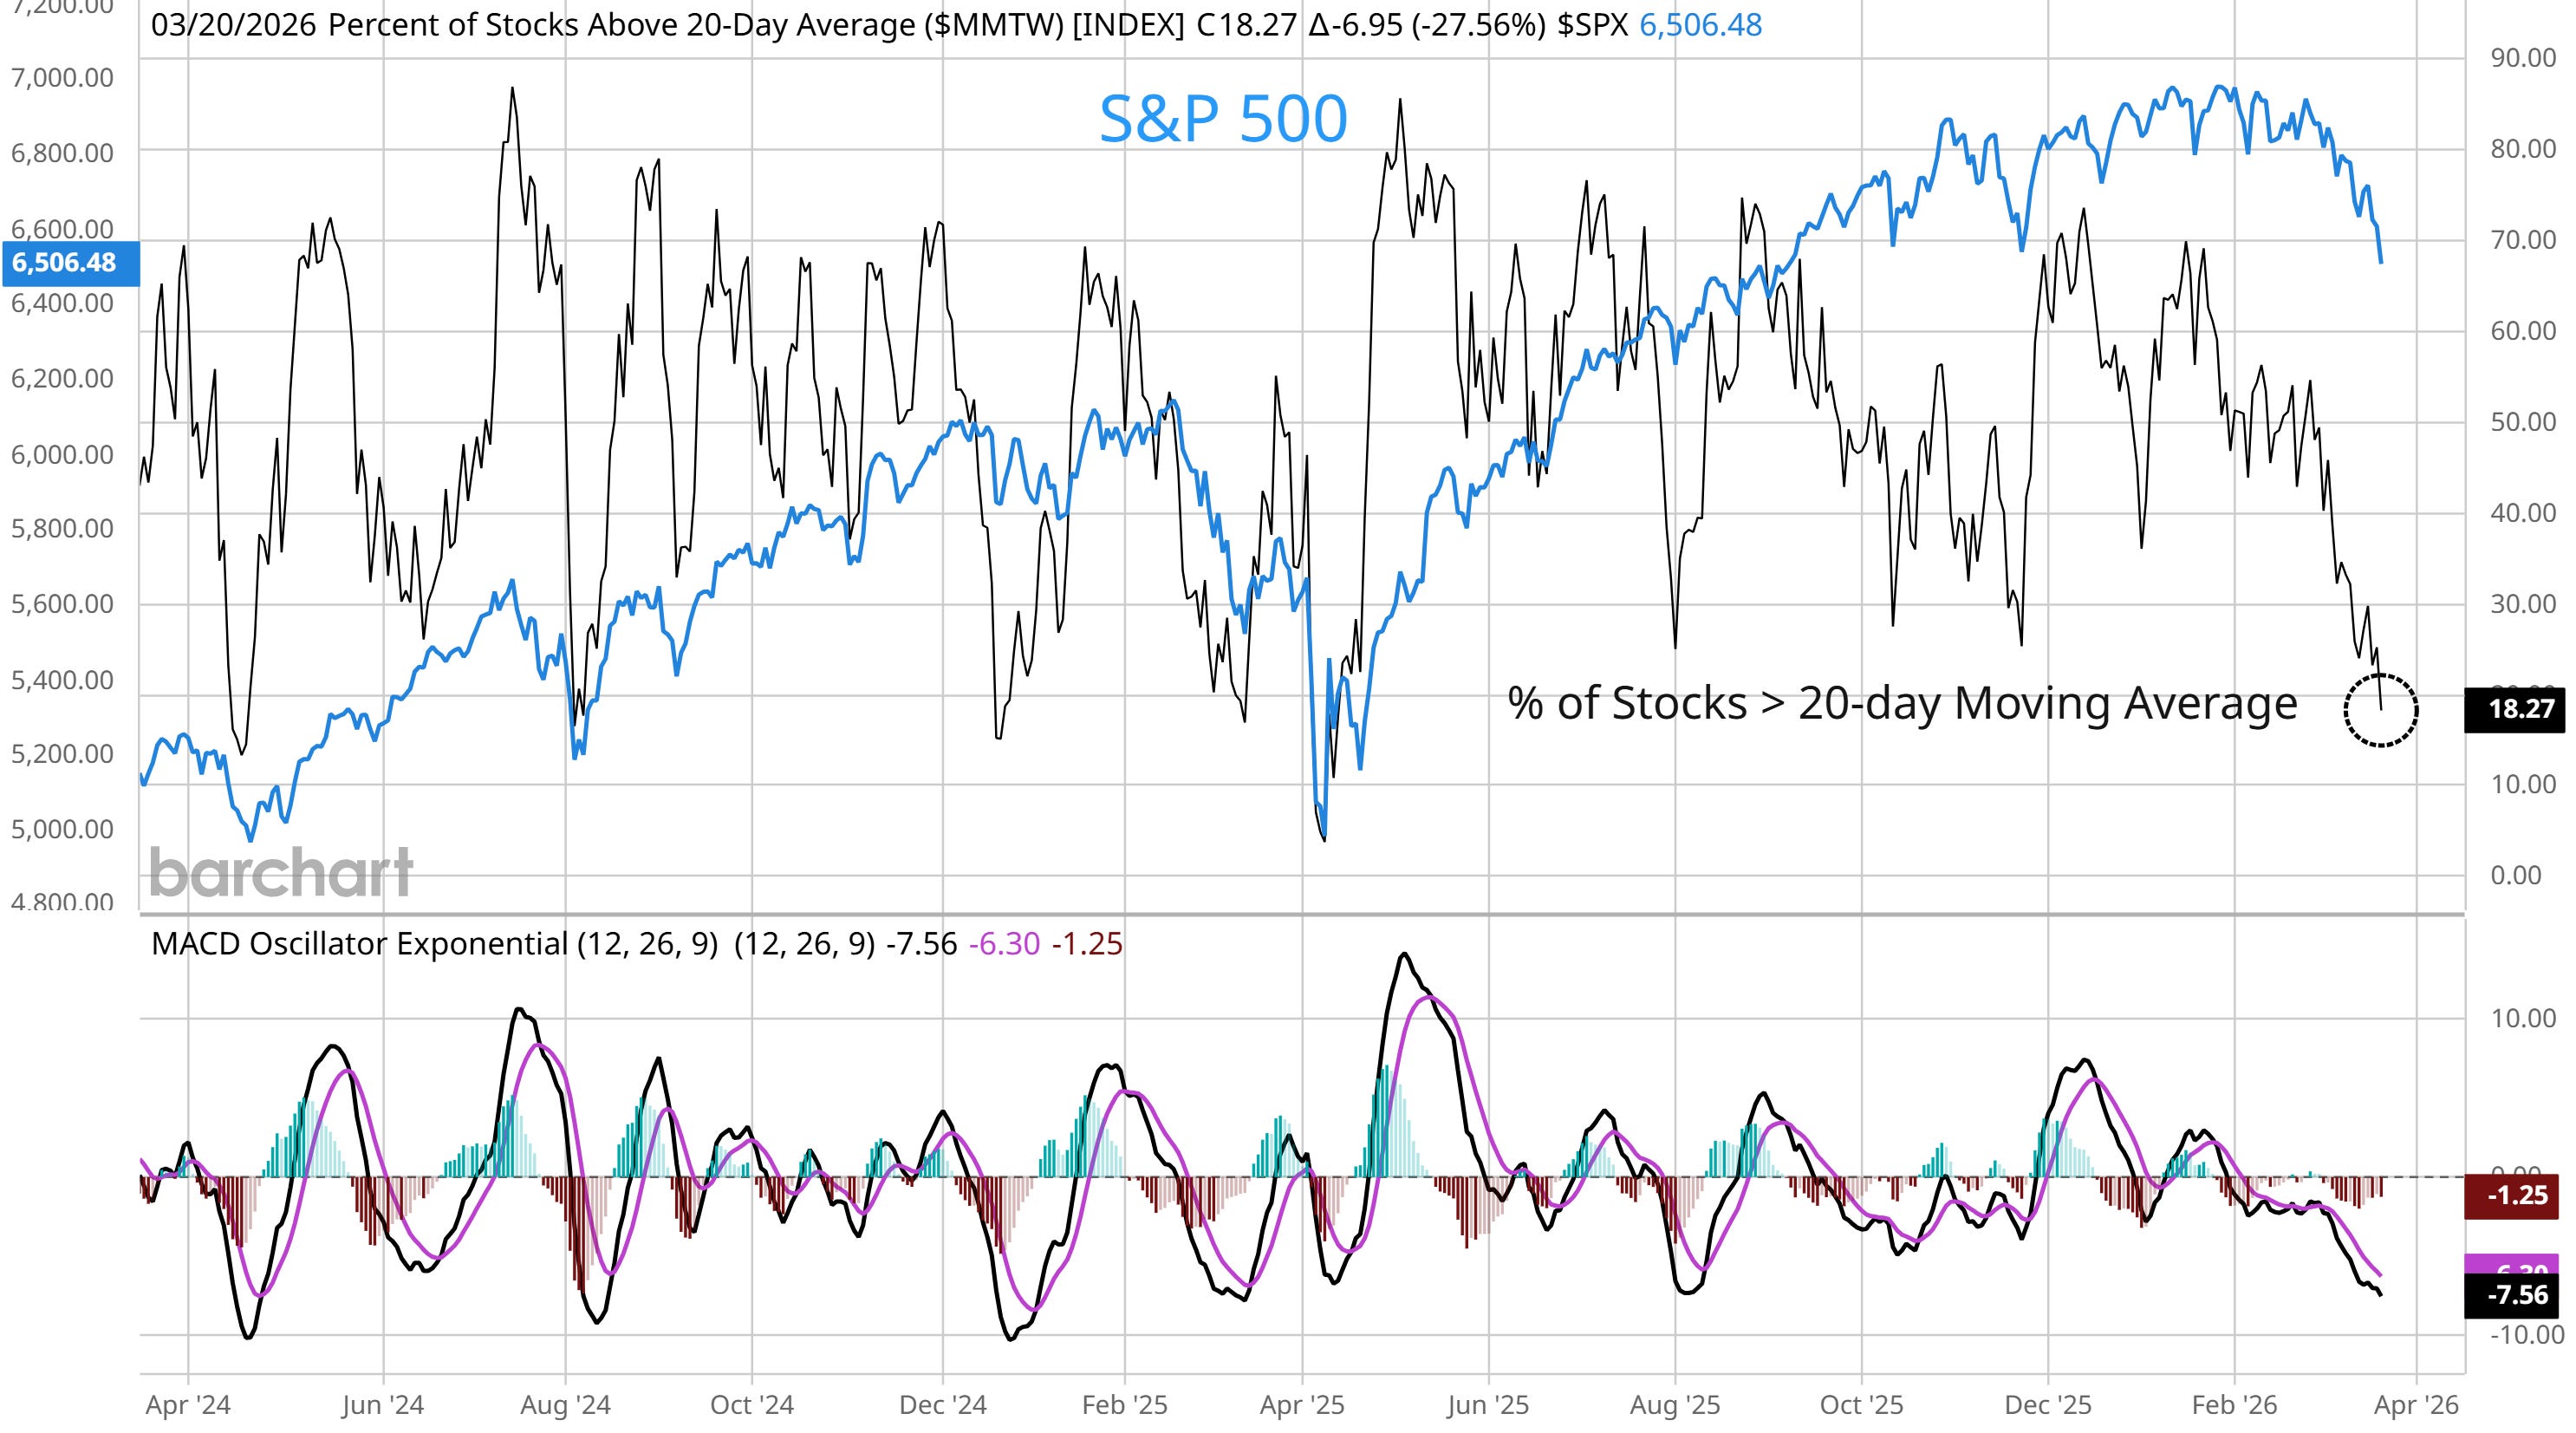
Equity markets are experiencing a sharp pullback with the S&P 500 down as much as 7% from its peak. While the uncertainty over inflation and the outlook for monetary are broadly weighing across the market, conditions are very favorable to see at least a short-term rally unfold. Various measures of investor sentiment and positioning are pointing to excessive bearishness in the market while breadth metrics are extending to extremely oversold levels. The chart below shows the percent of stocks across major exchanges trading above their 20-day moving average (MA). At just 18%, the figure hit the lowest level since the selloff around the trade war about a year ago, with readings below 20% pointing to extremely oversold conditions.
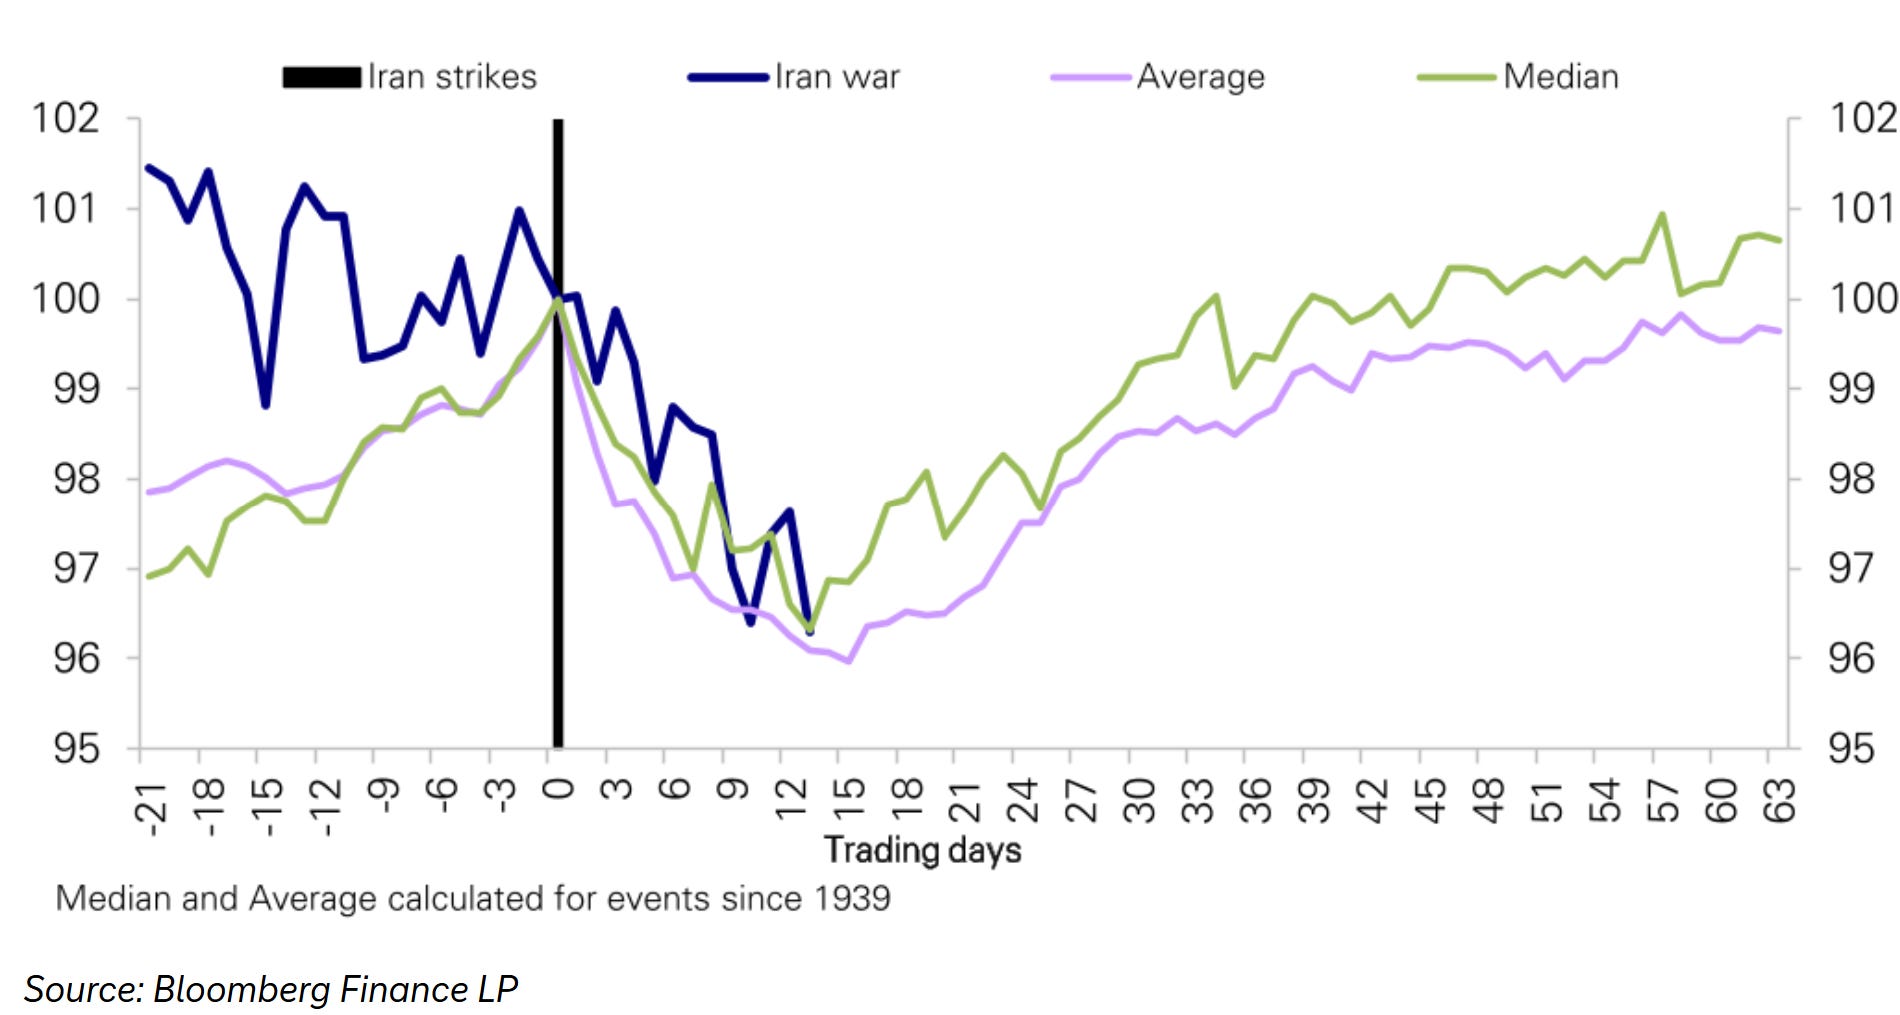
Conditions across breadth and sentiment are evolving to support a rally in the S&P 500. At the same time, historic precedent for market movements around major geopolitical events also hint that a rebound could be in store for the stock market. The chart below plots how the S&P 500 traded on average (purple line) before and after 30 major geopolitical events since 1939. If the S&P continues tracking the previous cycle on average (blue line), then the market could be in close proximity to a significant low heading into next week.
Heard in the Hub
The Traders Hub features live trade alerts, market update videos, and other educational content for members.
Here’s a quick recap of recent alerts, market updates, and educational posts:
Breadth and seasonality aligning for a rally.
The S&P 500’s path during past geopolitical events.
The key ingredient that could boost the stock market.
Why PCE inflation is going to give the Fed nightmares.
Data center infrastructure stocks keep showing relative strength.
You can follow everything we’re trading and tracking by becoming a member of the Traders Hub.
By becoming a member, you will unlock all market updates and trade alerts reserved exclusively for members.
Trade Idea
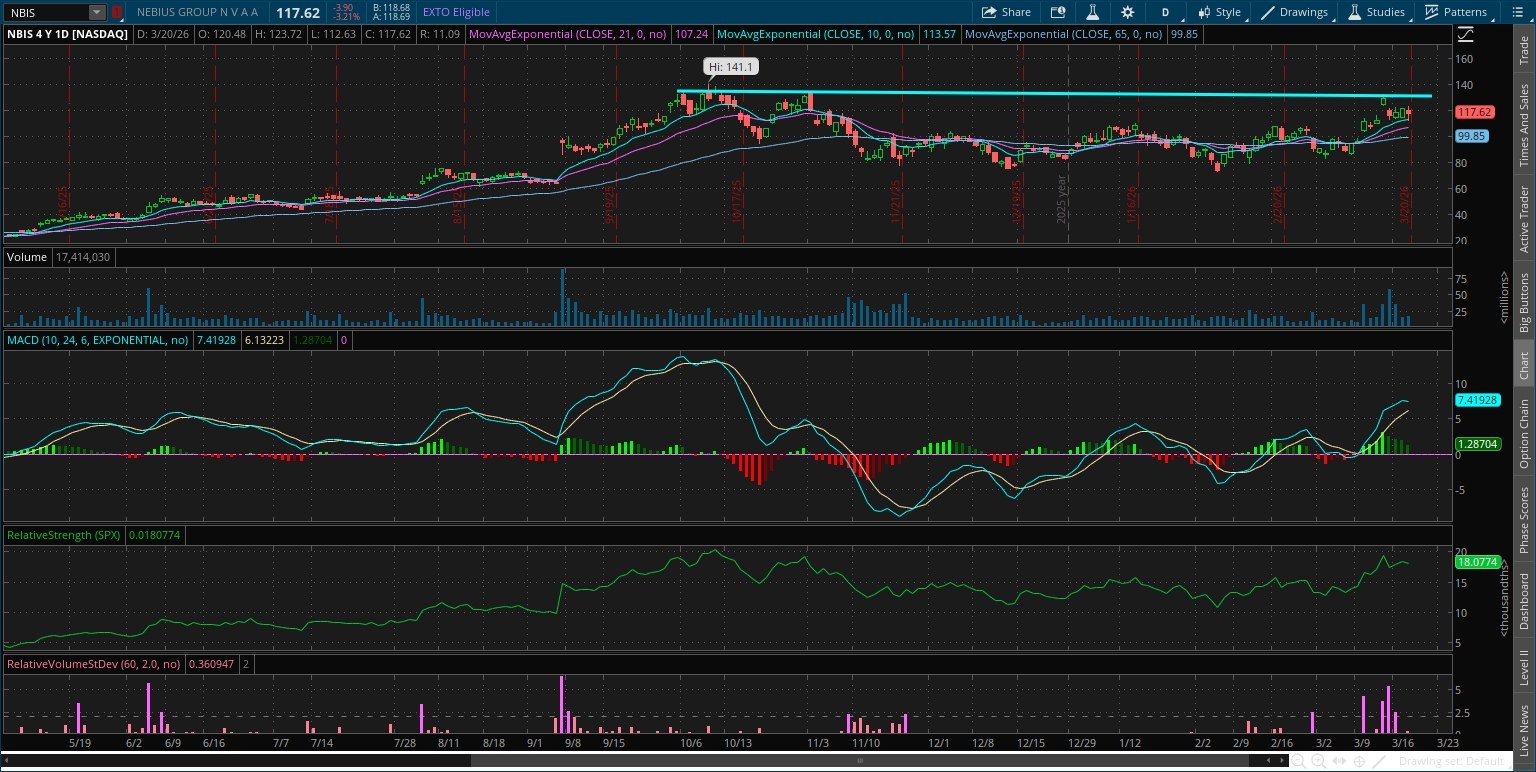
Nebius Group (NBIS)
AI infrastructure stock that rallied to the $140 level in October and is forming a new basing pattern. A recent test of resistance follows a couple smaller pullbacks off the $80 support level. I’m watching for a move over $140.
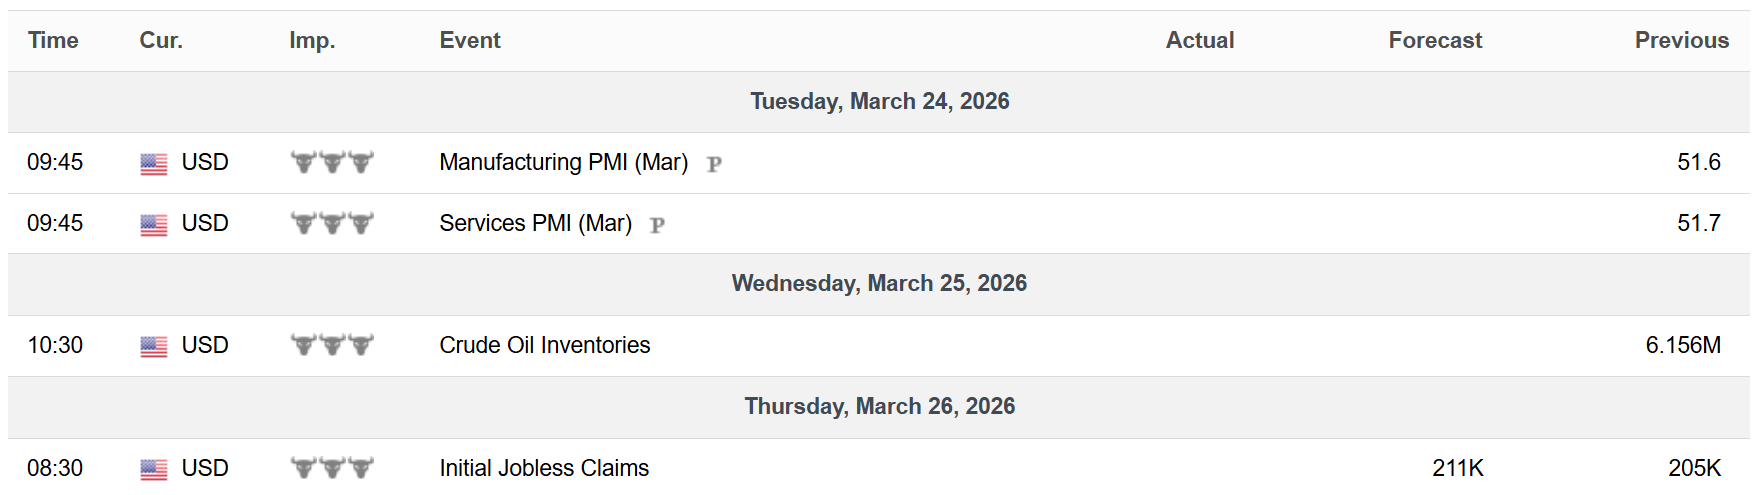
Key Upcoming Data
Economic Reports
Earnings Reports

I hope you’ve enjoyed The Market Mosaic, and please share this report with your family, friends, coworkers…or anyone that would benefit from an objective look at the stock market.
Become a member of the Traders Hub to unlock access to:
✅Model Portfolio
✅Members Only Chat
✅Trade Ideas & Live Alerts
✅Mosaic Vision Market Updates + More
Our model portfolio is built using a “core and explore” approach, including a Stock Trading Portfolio and ETF Investment Portfolio.
Come join us over at the Hub as we seek to capitalize on stocks and ETFs that are breaking out!
And if you have any questions or feedback, feel free to shoot me an email at mosaicassetco@gmail.com
Disclaimer: these are not recommendations and just my thoughts and opinions…do your own due diligence! I may hold a position in the securities mentioned in this report.