The Market Mosaic 3.19.23
Will the bank crisis tank the stock market?
Welcome back to The Market Mosaic, where I gauge the stock market’s next move by looking at macro, technicals, and market internals. I’ll also highlight trade ideas using this analysis.
If you find this content helpful please hit that “like” button, share this post, and become a subscriber to this always free newsletter if you haven’t already done so!
And be sure to check out Mosaic Chart Alerts. It’s a midweek update covering my best chart setups among long and short ideas in the stock market, along with levels that could trigger a trade.
Now for this week’s issue…
Following a week that featured two of the three largest bank failures in U.S. history, the crisis facing the financial system remains fluid and uncertain.
Not only are big banks trying to coordinate a rescue package to prevent First Republic Bank (which has $205 billion in assets and once sported a $39 billion market capitalization) from becoming the next failure, but the turmoil is now crossing the Atlantic and into Europe.
Speculation is rampant that Credit Suisse is facing its own liquidity crisis, with news emerging over the weekend that UBS is preparing an offer to save the bank. The cost to insure against a Credit Suisse default is skyrocketing to levels even greater than the 2008 financial crisis.
Perhaps it’s no surprise that the uncertainty is driving a flight to safety as investors seek shelter in assets like U.S. Treasury securities. The 10-year Treasury yield has fallen 58 basis points to 3.39%, and is at the bottom of a range extending back to September.
But I believe the most notable action is taking place in the 2-year Treasury yield. That’s because the 2-year (red line) reflects anticipated changes in the Federal Reserve’s interest rate policy (blue line), and thus historically leads Fed pivots as you can see in the chart below.
And during the last seven days, the 2-year yield has fallen from 5.05% to 3.81%. A similar drop in magnitude was seen during the October 1987 stock market crash.
So while investors may cheer signs that the Fed will be forced to abruptly stop its hiking campaign, pauses can actually be a bad sign. It’s a signal that the Fed has tightened to the point of breaking something, and must back off to prevent a calamity.
But given the sudden bank failures and more on the brink, is it too late to avoid a systemic impact? Here are three key signals I’m monitoring to know if the banking crisis will spread to the broader economy and stock market.
Bank Crisis Contagion: 3 Signals to Watch
The past week has featured plenty of troubling moves across the capital markets that reflect poorly on the outlook. In addition to the flight to quality, cyclically-sensitive areas like oil prices and small-cap stocks have sold off hard.
But there are other positive surprising moves taking place under the hood. So to make sense of the conflicting messaging in different corners of the market, I want to highlight three areas that I’m monitoring.
Bitcoin and technology stocks. One big surprise over the past week has been the action in cryptocurrencies and growth/tech stocks. Many will argue that bitcoin’s rally is a reflection of fears over the banking system, and that growth stocks are simply getting a boost from falling interest rates.
I don’t fully buy into either argument. They are certainly tailwinds, but if we’re staring down a true risk-off environment complete with margin calls then I would expect everything to sell off hard.
Instead, bitcoin is crossing above a key resistance level as you can see in the chart below. After a successful test of the 200-day moving average (MA - green line), bitcoin is taking out the $25,000 resistance level while the 50-day MA (black line) has crossed back above the 200-day MA.
I also posted this about the setup in the tech-heavy QQQ Nasdaq 100 ETF, which is breaking out from a bull flag pattern. If these breakouts can hold, that would signal the issues plaguing the bank sector can stay contained.
Liquidity trends. As I’ve written about frequently, liquidity is the lifeblood of asset prices…especially risky assets like stocks.
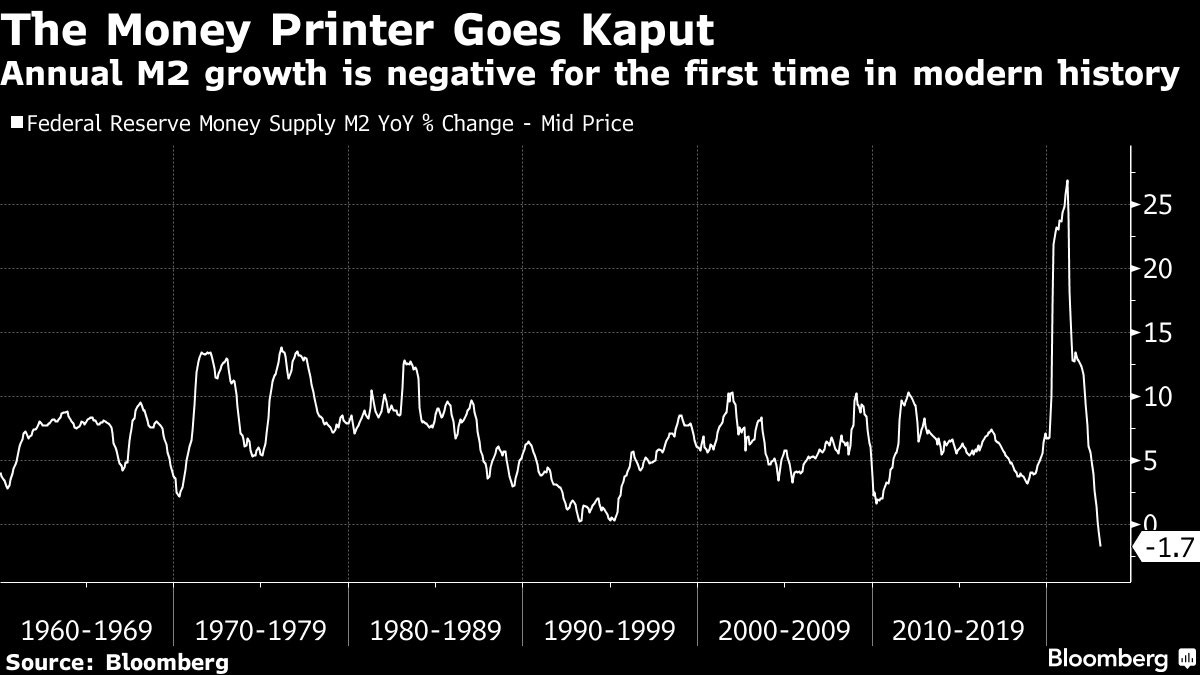
Ever since the Fed set about hiking rates and shrinking their balance sheet with quantitative tightening, liquidity has been drained from capital markets. That’s evidenced by the year-over-year growth rate in the M2 money supply measure, which is negative for the first time since the depression.
But the issues facing banks is forcing the Fed to make major cash injections to stabilize the markets. A new Fed lending program could ultimately inject $2 trillion into the U.S. banking system, while the Fed’s balance sheet assets jumped $300 billion last week (chart below).
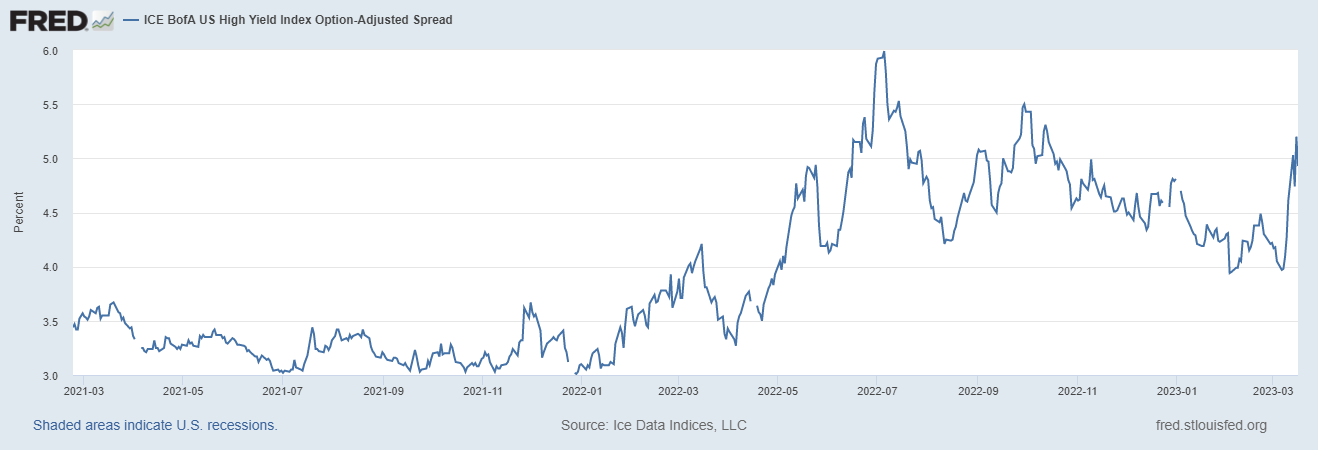
Signs of stress. If the bank crisis is going to spill over into the broader economy, then I would expect to see a surge in high yield spreads. That’s a way to measure how much extra compensation investors are demanding to lend to lower quality companies. That cost is measured as an interest rate spread over safer assets like Treasuries, where a rising spread shows investors are becoming more concerned about getting their money back.
Right now that spread is moving higher, but is still below the peak from last year. A move in spreads to new highs would be a concerning signal that the bank crisis is spilling over to the broader economy.
So while the headlines will be coming fast and furious next week, I’ll be keying on the charts above to track the evolution of the banking crisis. And at the same time, market internals are hitting key extremes.
Now What…
While I’ll be closely following the variables mentioned above, I will note that market internals favor a bounce. Breadth is becoming extremely oversold, with the percent of stocks trading above their 20-day MA touching historically low levels at 12% last week.
That’s also showing up in more intermediate-term measures, like the percent trading above their 50-day MA. Here’s my recent post of that metric going back three years:
At the same time, investor sentiment has become quite bearish. CNN’s Fear & Greed Index has fallen into extreme fear territory while the AAII survey of retail investors shows bullish sentiment at just 19%, which is the lowest since the late September lows in the stock market.
With the ongoing volatility in the market, we’re seeing more short setups highlighted in Mosaic Chart Alerts playing out. That’s especially been the case in solar stocks with RUN and SPWR, where I posted this update below:
But given the oversold conditions and bearish sentiment, I’m keeping my long watchlist ready to go. I’m focusing on stocks showing relative strength against the broader market decline since the start of February.
Like with GFS that has seen its relative strength line keep rising (green line in the bottom panel) even as price consolidates over the past month. That could be a sign of stealth buying, or shows holders are reluctant to give up their shares.
That’s all for this week. Expect plenty more headline-inducing volatility over the coming days as the situation in the banking system evolves and another Fed rate-setting meeting concludes. But I will be staying focused on the metrics covered in today’s report to tip the next bigger move in the stock market.
I hope you’ve enjoyed this edition of The Market Mosaic, and please share this newsletter with your family and friends…or anyone that would benefit from an objective look at the stock market.
And make sure you never miss an edition by subscribing here:
For updated charts, market analysis, and other trade ideas, give me a follow on Twitter: @mosaicassetco
And if you have any questions or feedback, feel free to shoot me an email at mosaicassetco@gmail.com
Disclaimer: these are not recommendations and just my thoughts and opinions…do your own due diligence! I may hold a position in the securities mentioned in this newsletter.


