
The Market Mosaic 3.16.25
S&P 500: Did the stock market make a major low?

👋Welcome back to The Market Mosaic, where I gauge the stock market’s next move by looking at macro, technicals, and market internals. I’ll also highlight trade ideas using this analysis.
If you find this content helpful please hit that “like” button, share this post, and become a subscriber if you haven’t already done so!
And be sure to check out Mosaic Traders Hub. It’s a members-only platform to alert trade ideas, track a model portfolio of open positions, and further analyze the message coming from the capital markets.
🚨You can start a 7-day free trial to the Hub by clicking here. By starting a trial, you will unlock all market updates and trade alerts reserved exclusively for members.
Now for this week’s issue…
Developments around tariffs and trade wars along with a large spike in announced job cuts are clouding the economic outlook.
Inflation expectations are surging higher as well. An updated consumer sentiment report from the University of Michigan showed consumers' 12-month inflation expectations jumped to 4.9%. That’s the highest level since November 2022.
Growing questions around the economy and earnings outlook sent the S&P 500 into correction territory for the first time since 2023. While the index dropped as much as 10% from the all-time high set on February 19, the pullback in the average stock has been even worse.
At one point last week, nearly half of all the stocks in the S&P 500 fell into their own bear market with a drop of 20% or more from their 52-week high as you can see in the chart below.

But just as the S&P 500 was tipping into correction, several conditions are emerging for a rally to unfold. That include extreme bearish investor sentiment across numerous surveys, and oversold breadth levels that we’ve been tracking over the past week.
And right on cue, the S&P 500 saw its largest one-day percent gain since early November. The question now focuses on the ultimate path forward, and if we’re going to see just a dead cat bounce or a more durable bottom form.
This week, let’s look at the historic path forward for the S&P 500 following a 10% correction. I also want to show you a key metric to watch in the week ahead that increases the odds we’ve seen the end of the correction, and how inflation concerns are driving a major breakout.
The Chart Report
As the S&P 500 dropped into correction territory last week, more signs of extreme fear and capitulation were emerging. I’ve previously covered the inverted VIX term structure, extreme pessimism in the AAII bull-bear spread, and the Investors Intelligence advisor survey showing bears outnumbering bulls for the first time since 2022’s bear market. Another metric showing how investors are betting with their own money is showing heightened fear as well. That’s with the CBOE equity put/call volume ratio that rose above .90 last week, which is a level that has marked prior lows during pullbacks over the past year.

In less than a month, the S&P 500 fell into correction territory after setting an all time high on February 19. That’s the fifth fastest correction in history, with other past instances resulting in a quick rebound and higher index levels three- and six-months out. A rally from here would also line up with historical seasonal patterns. Over the past 20 years on average, the S&P 500 has pulled back from mid-February into March. The S&P tends to see its low for the year during the second week of March, with bullish seasonal trends now persisting into May.

The correction in the S&P 500 is being driven by a decline in valuation measures (like the price-to-earnings ratio) up to this point. But the forward path for the S&P 500 will now come down to the potential for a recession and impact to the earnings outlook. The chart below shows how the S&P performs following a correction, and is conditional on the occurrence of a recession within 12 months. As long as a recession is avoided and the earnings outlook stays intact, forward returns are strong for the S&P 500 following a correction as you can see with the dark blue bars. The light blue bars show average returns if a recession hits within the next 12 months.

Institutional demand for stocks is needed to support a bottom and help the rally resume. Breadth thrusts are a way to track institutional activity through extreme levels of advancing stocks relative to declining issues. On Friday’s rally, the NYSE advance/decline (A/D) ratio nearly hit 9/1 (chart below). That’s at the low end of what I would consider a breadth thrust, but still points to elevated institutional involvement. A cluster of strong A/D ratios in the coming weeks would deliver more evidence that institutions are scooping up shares and signal that the lows are in.

The past week featured a mixed bag of news on the inflation front. Updated reports on consumer and producer inflation were less than expected in February. The Consumer Price Index rose by 2.8% compared to estimates for 2.9%. The Producer Price Index gained by 3.2% versus estimates for 3.3%. Core measures for the CPI and PPI were less than expected as well. But a consumer sentiment survey by the University of Michigan showed consumers’ inflation expectations rising to 4.9%, which is the highest since November 2022. The chart below plots inflation expectations overlaid with CPI, and hints at higher inflation levels ahead.

Sectors sensitive to inflation are building on recent breakouts, or staging rebounds above key levels. Gold prices touched $3,000/oz for the first time ever, and silver prices are hovering near the highest levels in over a decade. There are also signs that mining sector stocks are set to join the breakout in precious metals. After hitting the $43 level in 2020, GDX spent the next five years below that level (chart below). But in recent months, GDX is testing that level again and is finally starting to push above resistance. Historically, mining stocks are one of the best performing sectors during high and rising inflationary environments.

Heard in the Hub
The Traders Hub features live trade alerts, market update videos, and other educational content for members.
Here’s a quick recap of recent alerts, market updates, and educational posts:
A detailed look at why we could’ve seen the lows.
My top four trade ideas to take advantage of a rebound.
A panic signal coming from volatility markets pointing to a bottom.
Trading the breakout in gold mining stocks from a five-year basing pattern.
You can follow everything we’re trading and tracking by becoming a member of the Traders Hub.
By becoming a member, you will unlock all market updates and trade alerts reserved exclusively for members.
👉You can click here to join now👈
Trade Idea
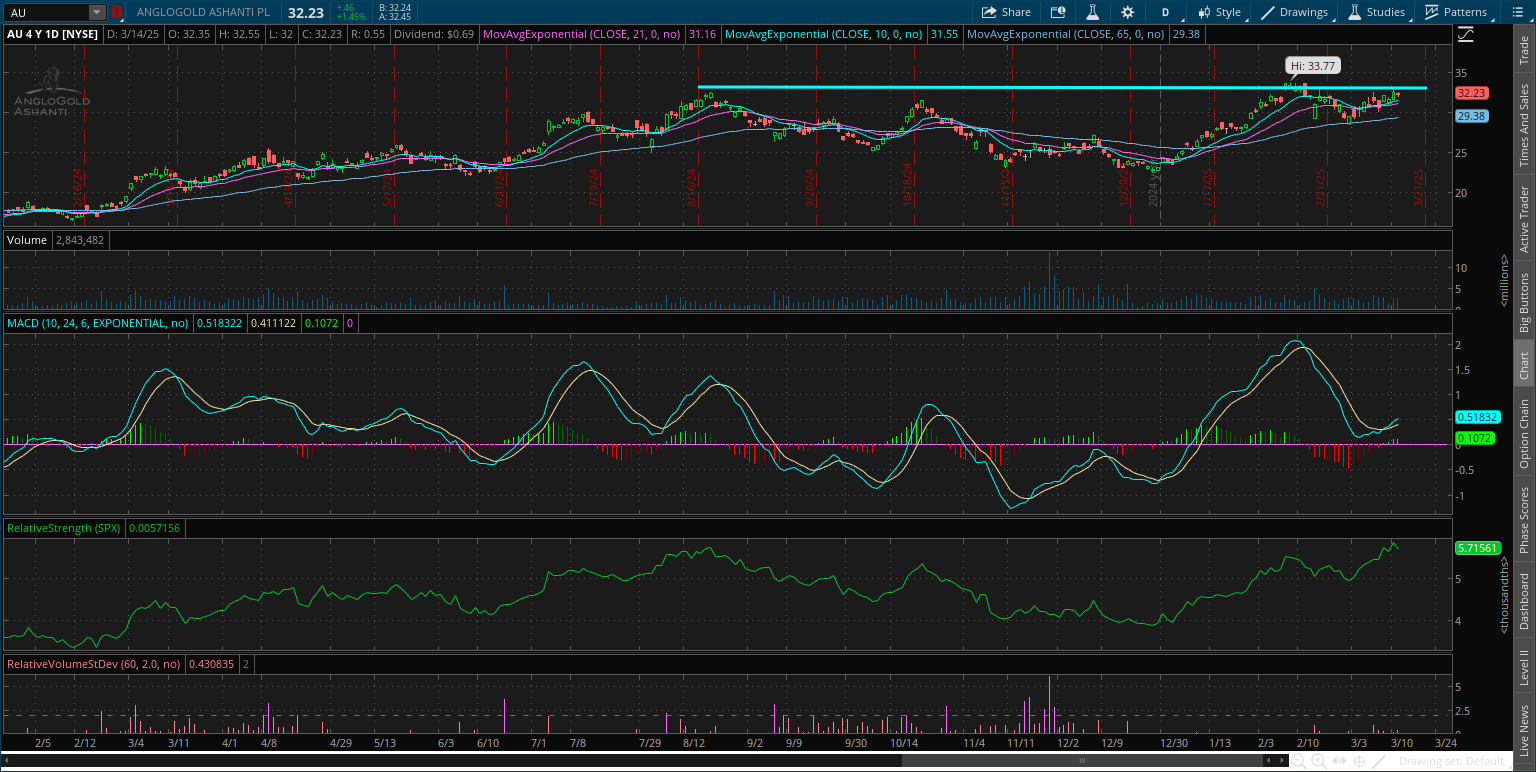
Anglogold Ashanti (AU)
Gold miner forming a basing pattern after hitting the $33 level last August. Recently testing that resistance level again, and making a smaller pullback. That’s resetting the MACD at the zero line, while price is near its 52-week high. I’m watching for a breakout over $34.
Key Upcoming Data
Economic Reports

Earnings Releases

I hope you’ve enjoyed The Market Mosaic, and please share this report with your family, friends, coworkers…or anyone that would benefit from an objective look at the stock market.
Become a member of the Traders Hub to unlock access to:
✅Model Portfolio
✅Members Only Chat
✅Trade Ideas & Live Alerts
✅Mosaic Vision Market Updates + More
Our model portfolio is built using a “core and explore” approach, including a Stock Trading Portfolio and ETF Investment Portfolio.
Come join us over at the Hub as we seek to capitalize on stocks and ETFs that are breaking out!
And if you have any questions or feedback, feel free to shoot me an email at mosaicassetco@gmail.com
Disclaimer: these are not recommendations and just my thoughts and opinions…do your own due diligence! I may hold a position in the securities mentioned in this report.