
The Market Mosaic 3.15.26
Market Forces Converging to Ignite a Rally.

👋Welcome back to The Market Mosaic, where I gauge the stock market’s next move by looking at macro, technicals, and market internals. I’ll also highlight trade ideas using this analysis.
If you find this report helpful please hit that “like” button, share this post, and become a subscriber if you haven’t already done so!
🚨And be sure to check out Mosaic Traders Hub. It’s a members-only platform to alert trade ideas, track a model portfolio of open positions, and further analyze the message coming from the capital markets.
Now for this week’s issue…
The outlook for the S&P 500 is coming down to one factor: the duration of the conflict in the Middle East and impact on oil prices.
Oil prices spiked to nearly $120 per barrel and remain near $100 as oil faces the biggest disruption ever (chart below). That’s impacting the outlook for economic activity, inflation, and ultimately monetary policy.

Market-implied odds for interest rate cuts by the Federal Reserve are being pared back over fears of inflationary pressures from the war against Iran. Oil and natural gas prices are holding their gains, while food prices could be impacted by fertilizer shortages since the Middle East accounts for as much as 50% of key fertilizer ingredients.
Although investor fears are shifting to the inflation outlook and prospect for rate hikes, the labor market is showing signs of stalling following the February payrolls report showing a loss of 92,000 jobs during the month.
Betting markets are showing a rising chance of recession in 2026 as a stalling labor market is colliding with fears that rising inflation will limit any accommodation from monetary policy.
Those stagflation concerns are weighing on the major indexes, with the S&P 500 putting in its third consecutive weekly decline and trading at the lowest level in four months.
But the pullback is creating extremely oversold breadth conditions across the market while bearish sentiment spikes higher. Any signs of easing tensions in the Middle East could spark a massive reversal higher given the technical backdrop.
This week, let’s look at why the conflict in the Middle East could drive a sharp rise in food inflation and cloud the outlook for monetary policy. We’ll also look at signs that the selloff in the stock market has gone too far, with several conditions aligning to spark a rally.
The Chart Report
The conflict in the Middle East could place upward pressure on inflation via multiple transmission channels. Most focus is being placed on the surge in oil prices, where every $10 per barrel increase can add 0.2% to headline inflation. Oil prices spiked to their highest level since 2022, back when an inflation wave took the Consumer Price Index as high as 9%. Food prices could become another key contributor to inflation since the Middle East is a critical producer of farm fertilizers. In addition to being a key oil conduit, the Strait of Hormuz sees about one-third of the world’s fertilizer ingredients transit through. The chart below overlays an index of food prices (red line) against oil prices (black line) where the two series tends to be very positively correlated.

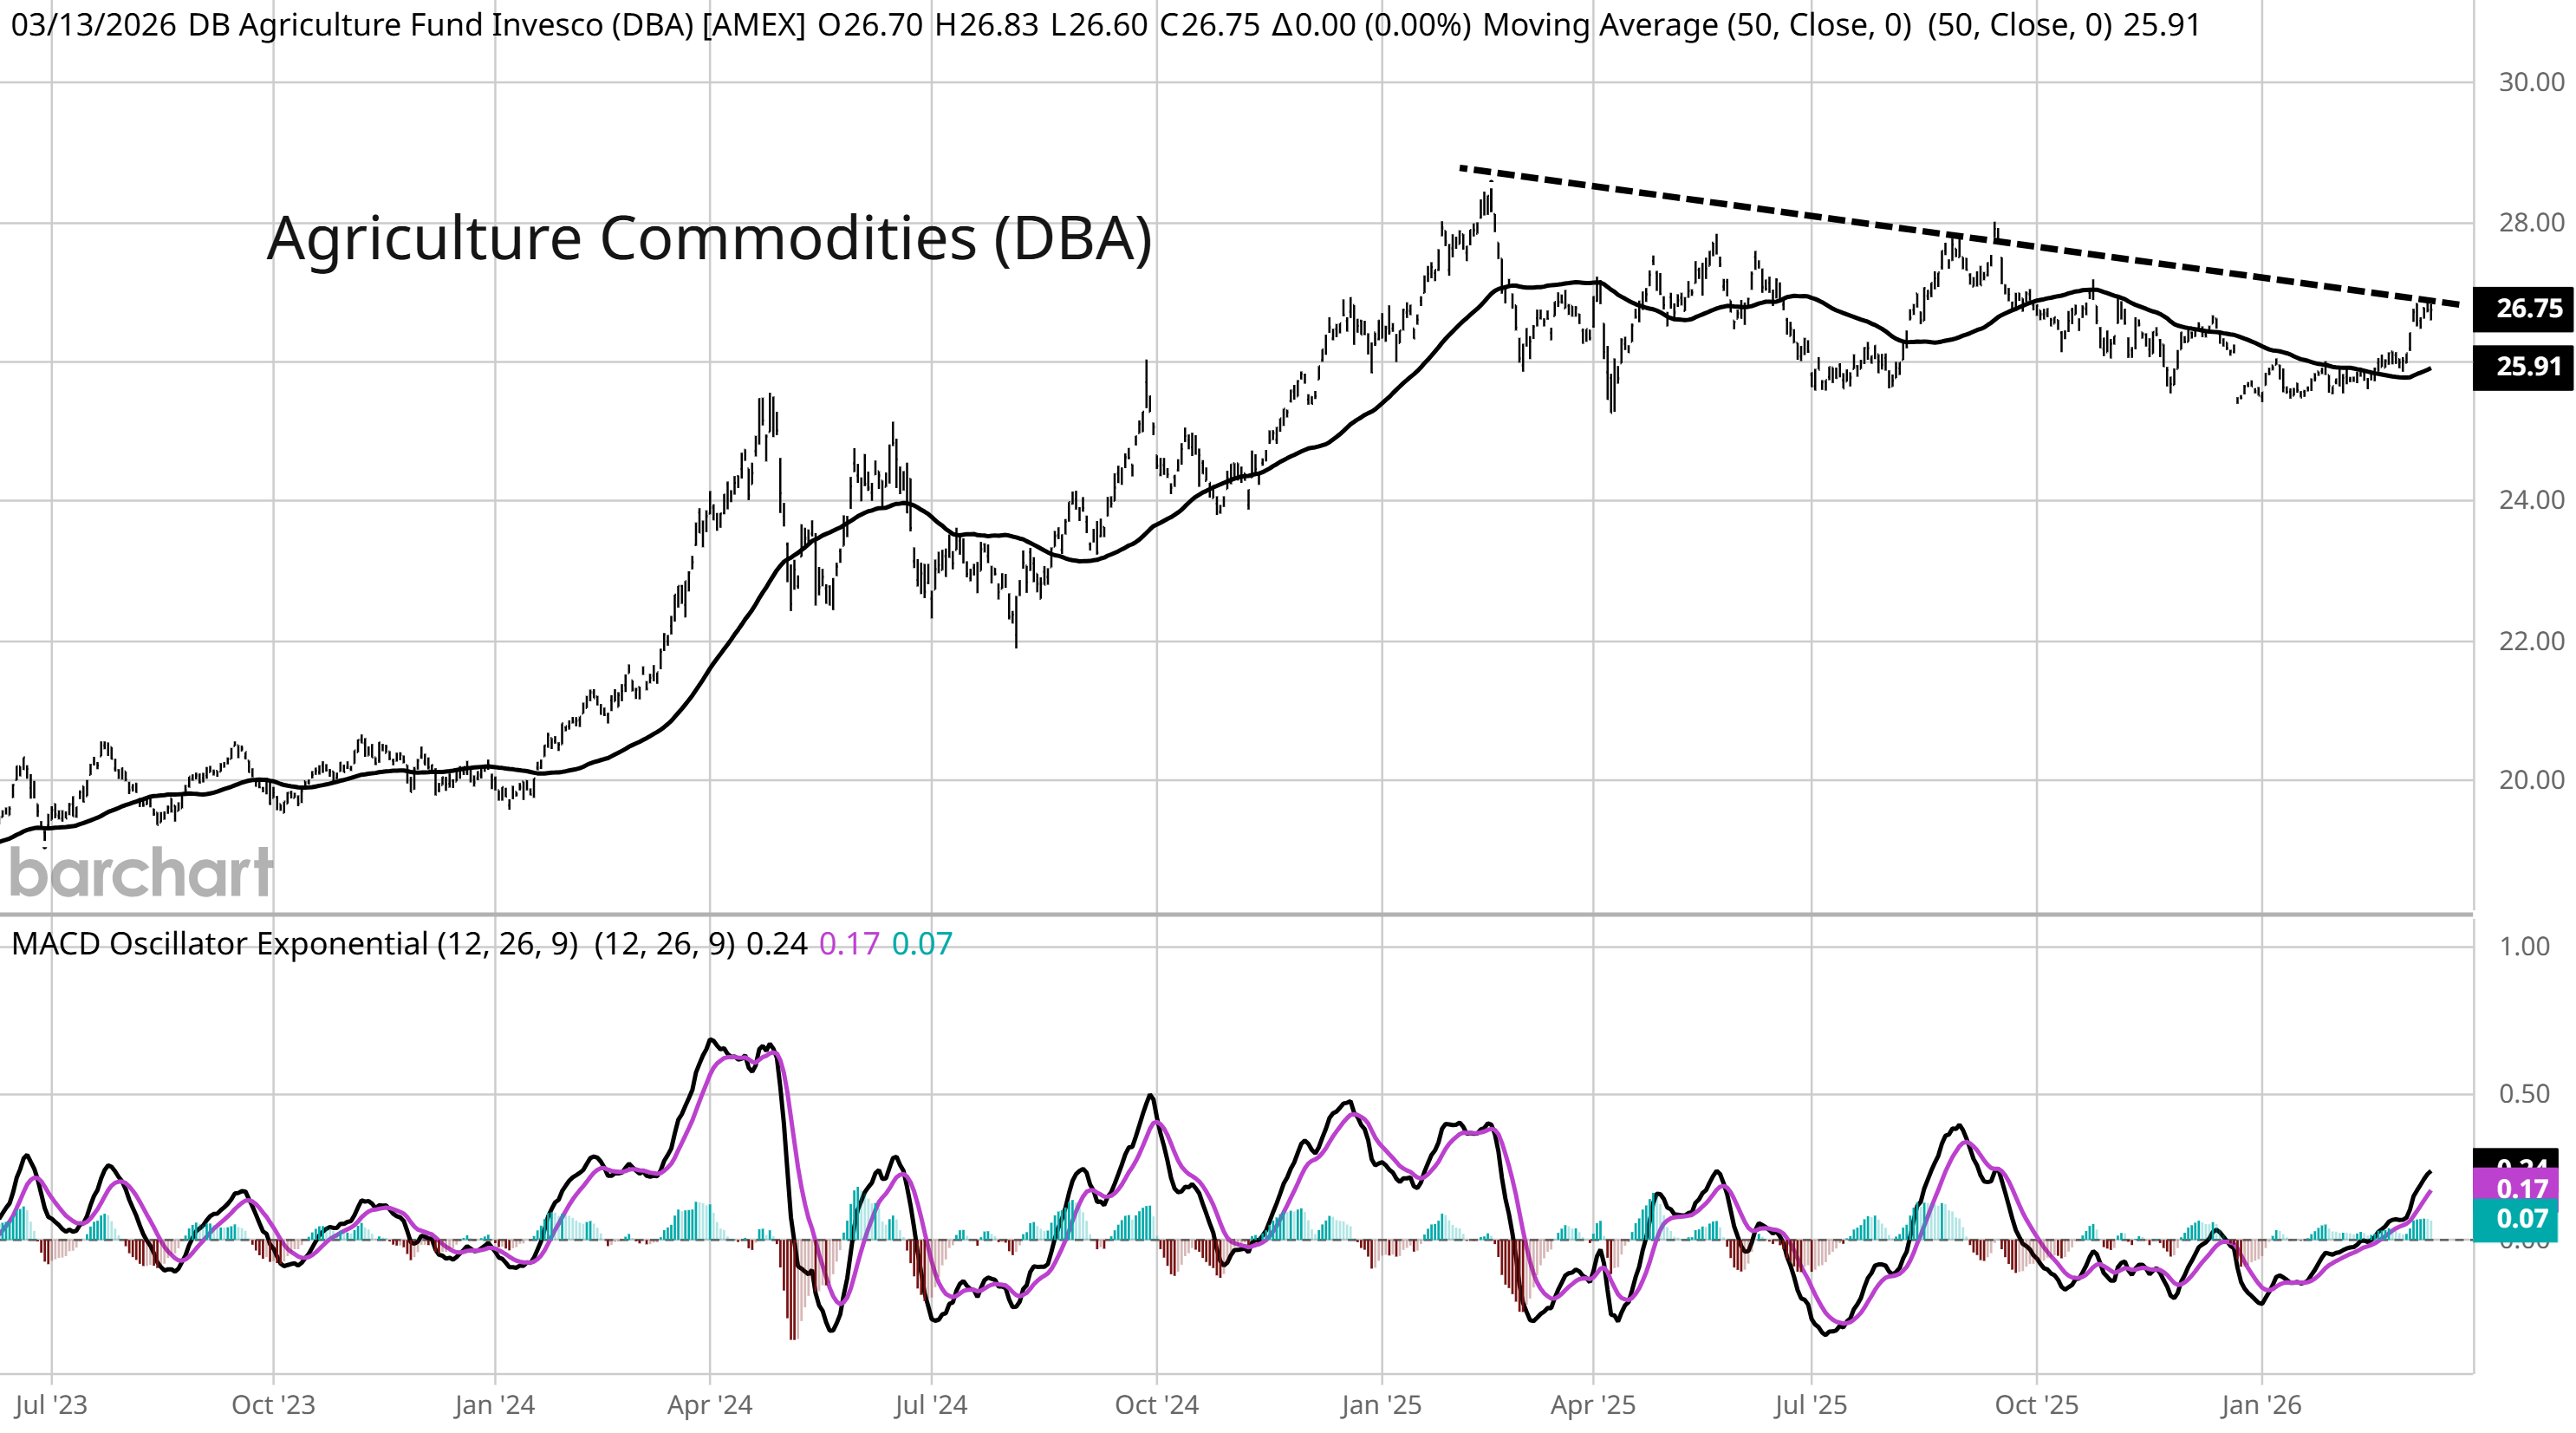
Key fertilizer ingredients are being impacted near the start of the U.S. spring planting season. One estimate suggests that the U.S. could face a 25% shortfall of key fertilizer products, where it relies heavily on imports. A shortage of fertilizer could drive prices higher and place upward pressure on food prices, or could push crop yields lower and result in shortages. One way to track and trade a rally in food prices is with the Invesco DB Agriculture Fund (DBA) in the chart below. DBA made a recent peak in early 2025 and is making lower highs since then while finding price support around the $25 level. Price is back near trendline resistance off the 2025 high, where a breakout could point to higher prices for agricultural products.
The labor market is showing signs of stalling since the start of 2025, with payrolls averaging just 10,000 jobs per month. With the Federal Reserve expressing concerns over the health of the labor market last year, that seemed to open the door for more rate cuts in 2026. But the conflict in the Middle East is promising to stoke inflation, while more recently the Fed is making a hawkish pivot due to the lack of progress in bringing inflation lower. Market-implied odds point to just one rate cut this year and not until the December meeting. A lack of accommodation from monetary policy to support the labor market coupled with the impact of high energy prices on inflation and consumer spending is causing recession odds to spike. The chart below shows odds of a U.S. recession in 2026 currently stands at 30% and spiked higher following the outbreak of war in the Middle East.

The conflict in the Middle East threatens the stock market through two primary catalysts. One is with inflation, where higher levels of inflation are associated with lower valuation multiples on average. The negative impact on the economy also threatens the earnings outlook. The S&P 500 has seen consecutive losses for three weeks in a row, while the average stock is also pulling back sharply following a strong start to the year. But the broad selloff is seeing measures of breadth hit extremely oversold levels. The chart below plots a composite of breadth metrics and is hitting oversold levels last seen during the stock market plunge following last year’s trade war.

Several measures of market breadth and investor sentiment are hitting levels that could spark a bullish reversal in the stock market. At the same time, the S&P 500 is coming up to a positive stretch of seasonality that tends to see the market make a low for the year in mid-March and rally into the end of April. The historical path of the S&P 500 around geopolitical conflict is also reaching a key inflection point. The chart below shows how the S&P traded before and after several major geopolitical conflicts. If the S&P is going to follow a similar path, then the market should be nearing a key inflection point. With breadth extremely oversold, investor bearishness on the rise, and stock market seasonals becoming more positive, the conditions are present to see a rally unfold.

Heard in the Hub
The Traders Hub features live trade alerts, market update videos, and other educational content for members.
Here’s a quick recap of recent alerts, market updates, and educational posts:
Bitcoin as a leading sentiment indicator.
Why the 1970s inflation cycle matters right now.
Broad commodities rally increasing inflation risks.
A rare VIX signal pointing to a stock market bottom.
A biotech trade setup that’s showing relative strength.
You can follow everything we’re trading and tracking by becoming a member of the Traders Hub.
By becoming a member, you will unlock all market updates and trade alerts reserved exclusively for members.
Trade Idea
Solaris Energy Infrastructure (SEI)
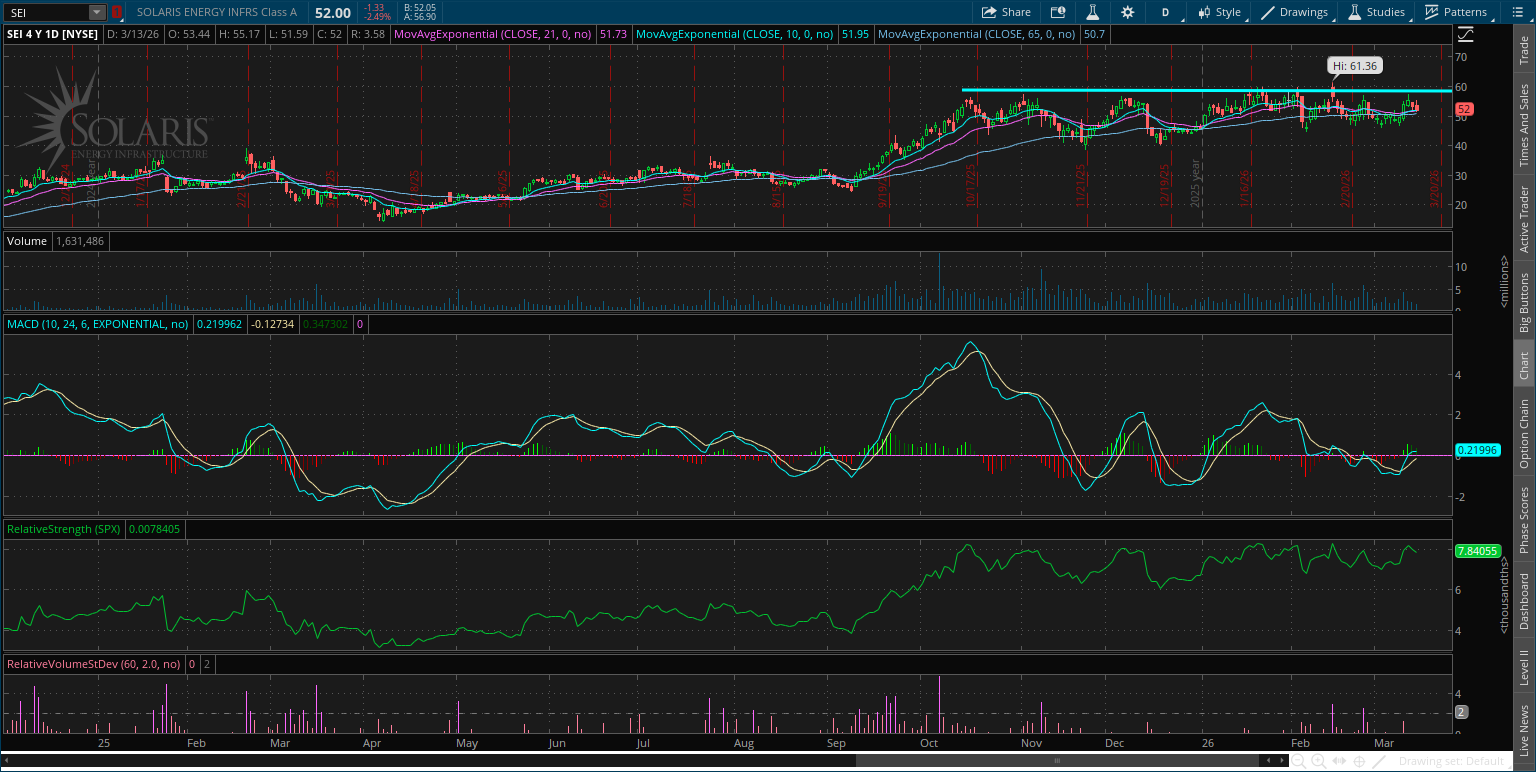
The stock is trading in a sideways range since October with price action recently firming up. SEI is making a smaller pullback off resistance at the $60 level. I want to see the MACD cross above zero and make a bullish reset before breaking out.
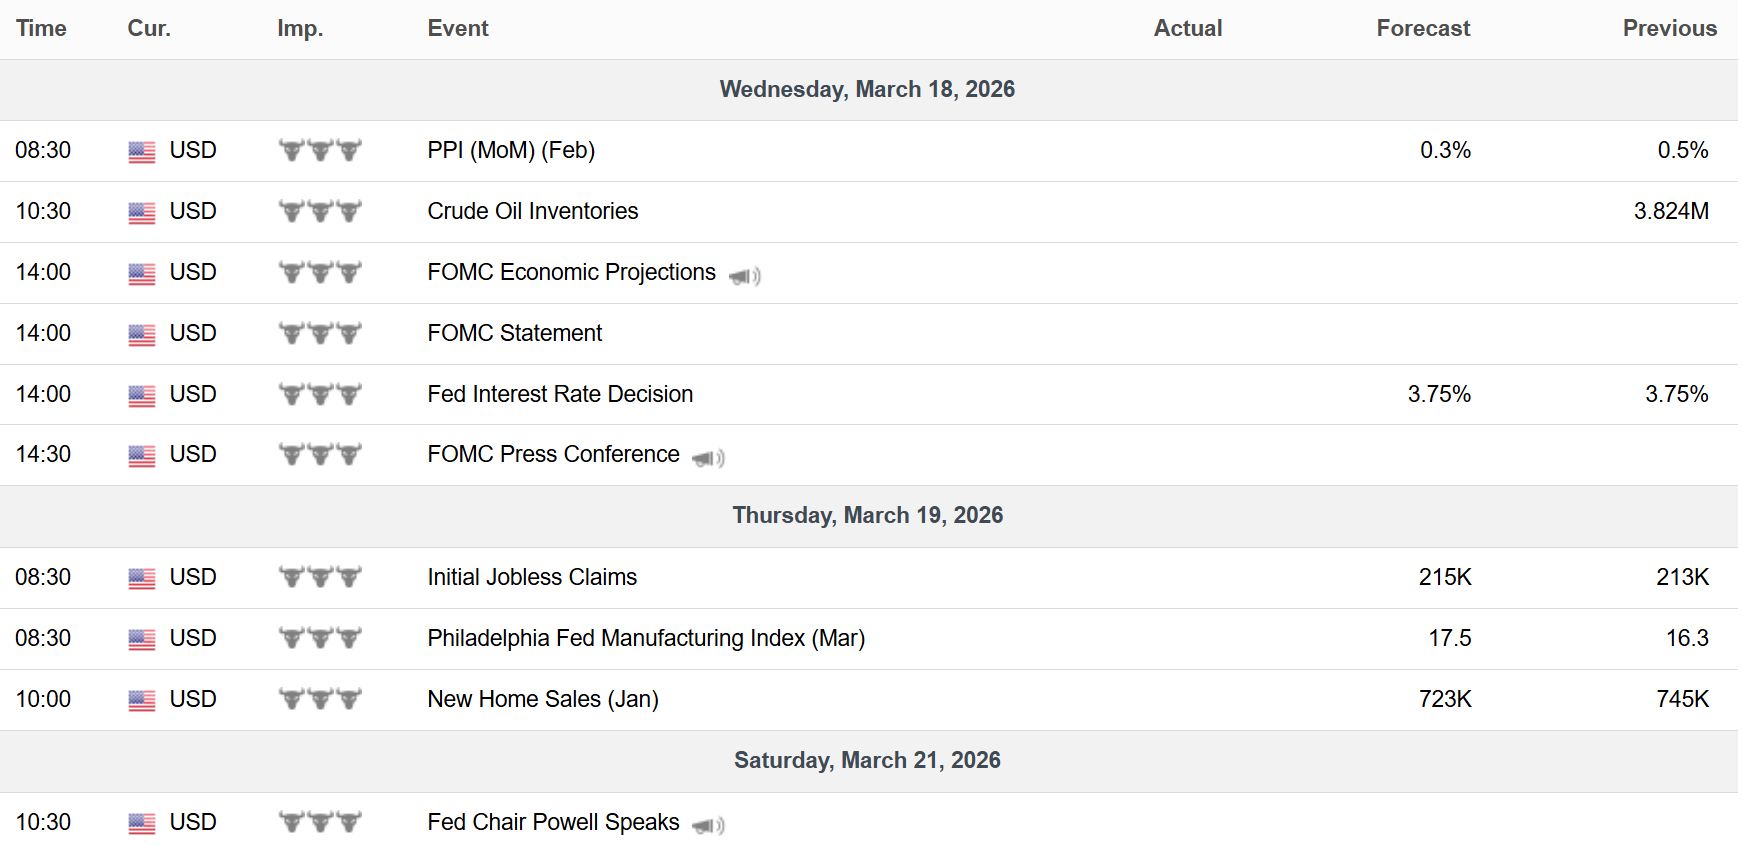
Key Upcoming Data
Economic Reports
Earnings Reports

I hope you’ve enjoyed The Market Mosaic, and please share this report with your family, friends, coworkers…or anyone that would benefit from an objective look at the stock market.
Become a member of the Traders Hub to unlock access to:
✅Model Portfolio
✅Members Only Chat
✅Trade Ideas & Live Alerts
✅Mosaic Vision Market Updates + More
Our model portfolio is built using a “core and explore” approach, including a Stock Trading Portfolio and ETF Investment Portfolio.
Come join us over at the Hub as we seek to capitalize on stocks and ETFs that are breaking out!
And if you have any questions or feedback, feel free to shoot me an email at mosaicassetco@gmail.com
Disclaimer: these are not recommendations and just my thoughts and opinions…do your own due diligence! I may hold a position in the securities mentioned in this report.