
The Market Mosaic 3.1.26
Geopolitical Turmoil Could Jolt Inflation.

👋Welcome back to The Market Mosaic, where I gauge the stock market’s next move by looking at macro, technicals, and market internals. I’ll also highlight trade ideas using this analysis.
If you find this report helpful please hit that “like” button, share this post, and become a subscriber if you haven’t already done so!
🚨And be sure to check out Mosaic Traders Hub. It’s a members-only platform to alert trade ideas, track a model portfolio of open positions, and further analyze the message coming from the capital markets.
Now for this week’s issue…
Fears that a growing U.S. military presence in the Middle East meant an imminent strike on Iran are being realized.
A series of attacks that took out key Iranian leadership and retaliatory strikes against U.S. targets and its allies are still ongoing. While events and reactions are still unfolding, the developments will have major repercussions for the capital markets.
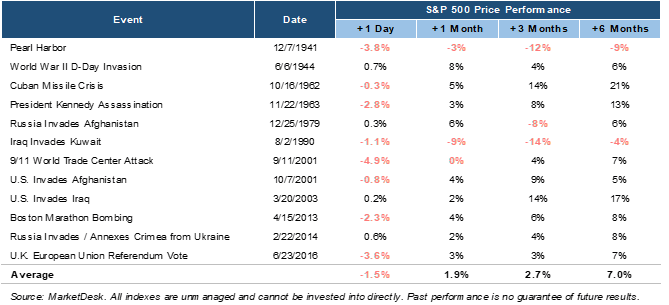
For investors, the primary focus is how the stock market will respond in the aftermath of escalating hostilities. While the immediate reaction is expected to pressure stock prices and drive a spike in volatility, military conflicts (and their stimulative spending effects) tends to boost stock prices historically (table below).
The bigger risk for investors is the impact on oil prices and what it means for the inflation outlook. The Strait of Hormuz off Iran’s coast sees more than 14 million barrels of oil pass through, or about a third of global exports.
Along with the ongoing rally in other commodity prices like copper, that should present upward pressure on headline inflation at a time when the Federal Reserve is already making a hawkish pivot.
Even before this weekend’s events, the Producer Price Index (PPI) was reported at 2.9% in January compared to last year. The core figure that excludes food and energy prices jumped by 3.6% compared to expectations for an increase of 3.0%.
That’s important because the PPI tends to lead changes in consumer inflation, and is showing signs of acceleration even before the potential pressures from rising oil prices.
This week, let’s look at the major breakout in oil prices that could be underway and what that means for inflation and the outlook for rate cuts. We’ll also look at evidence that inflation risks are already building, and the key level you need to watch on the U.S. dollar.
The Chart Report
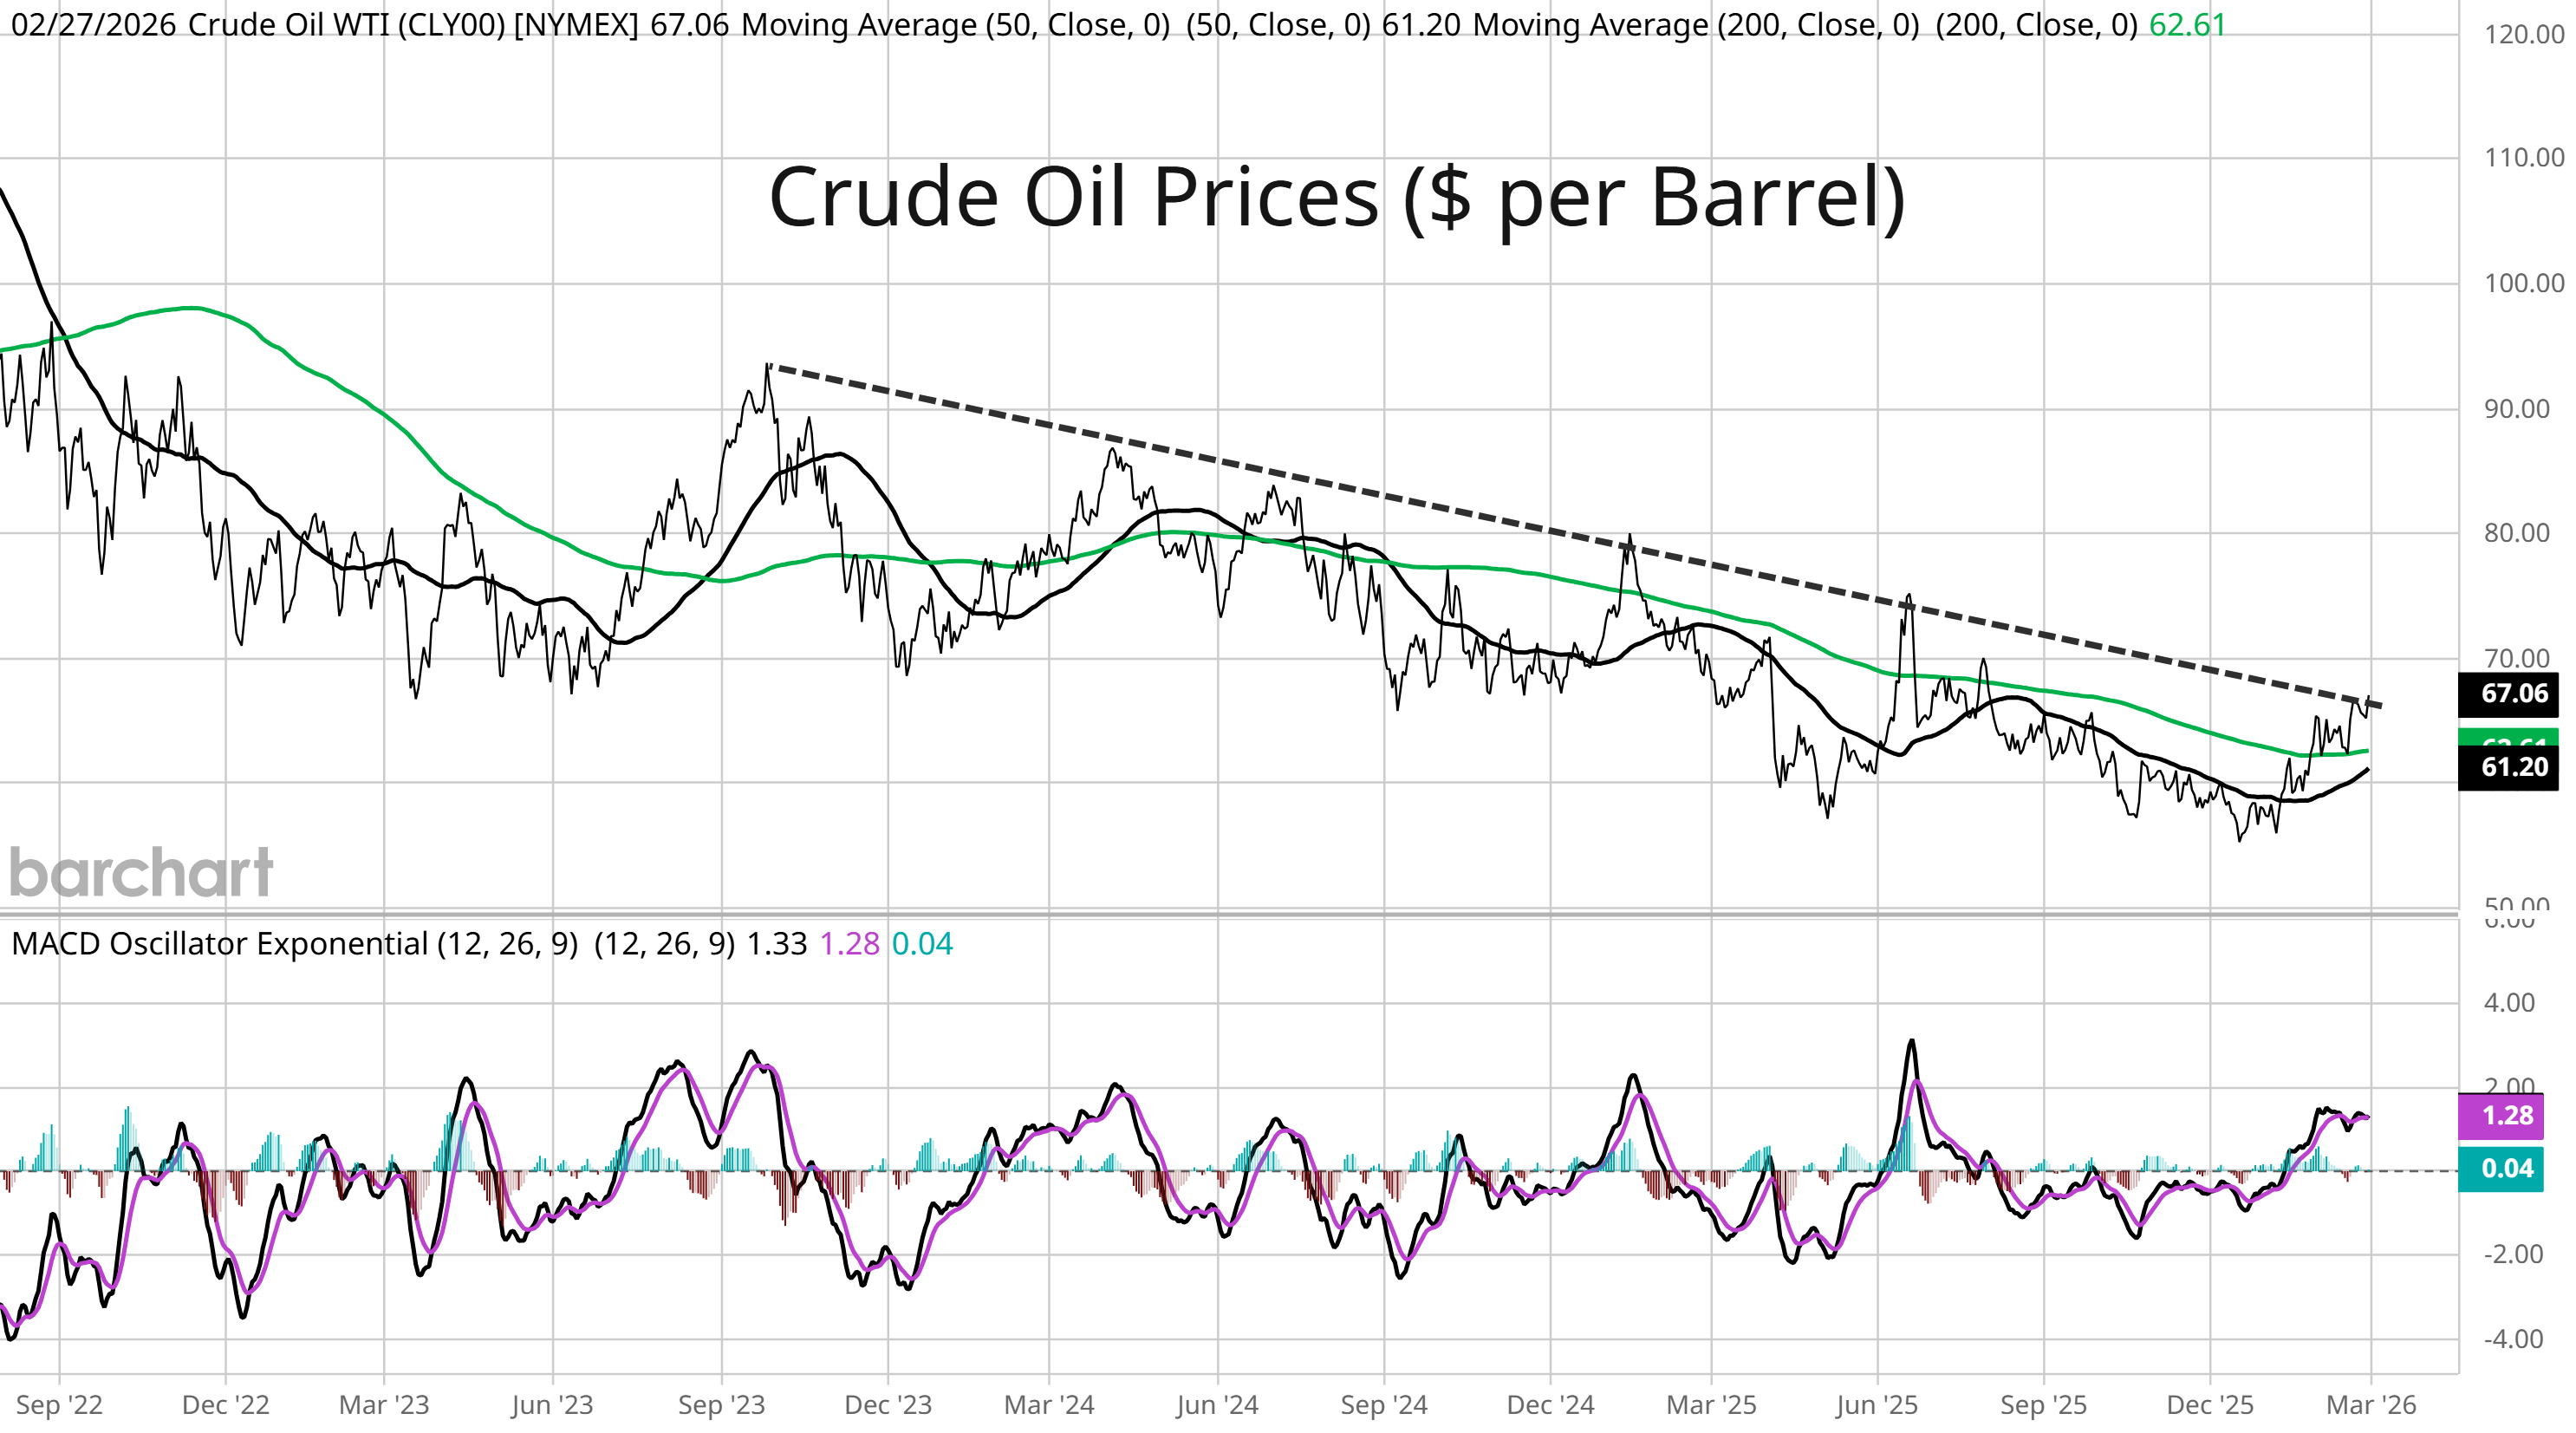
The ongoing conflict in the Middle East is causing a significant disruption to global energy exports. Reports suggest that tanker activity going through the Strait of Hormuz has slowed significantly while numerous ships have also come under attack. Oil prices have been steadily rising since December on fears over a U.S strike on Iran, and has brought the price of oil to a key level. The chart below shows the primary downtrend in oil prices since late 2023 with lower highs and lower lows in price along the way. But the recent gains has brought oil right back to the downtrend line, which could be broken to the upside following this weekend’s events. A major breakout in oil prices could be underway.
A jump in oil prices could have major implications on the outlook for inflation. Changes in energy prices can drive fluctuations in headline inflation, with a study by the Federal Reserve estimating that every $10 increase in the price of oil adds 0.20% headline inflation. Prices are already up $12 per barrel since December and look poised to jump following developments in the Middle East. The chart below shows the spike in Brent crude prices (a better global benchmark of oil prices) coming out of the pandemic and during the start of the Russia/Ukraine war in 2022 and the resulting impact on headline consumer inflation. Energy prices were a major contributor to an inflation wave that peaked in 2022 at the highest level in over 40 years.

While the conflict in the Middle East will be a major catalyst for movement in energy prices, a prolonged period of underinvestment in various energy and industrial commodities was already setting the stage for a rally. The chart below tracks a ratio capital expenditures to assets across various commodities. You will notice a sharp drop in the ratios starting around 2013, with capex running at below average levels since then in everything from industrial metals to oil and agriculture. Structural commodity deficits are already emerging in areas like copper, and could persist for an extended period as bringing more supply to market can require significant amounts of capital and time.

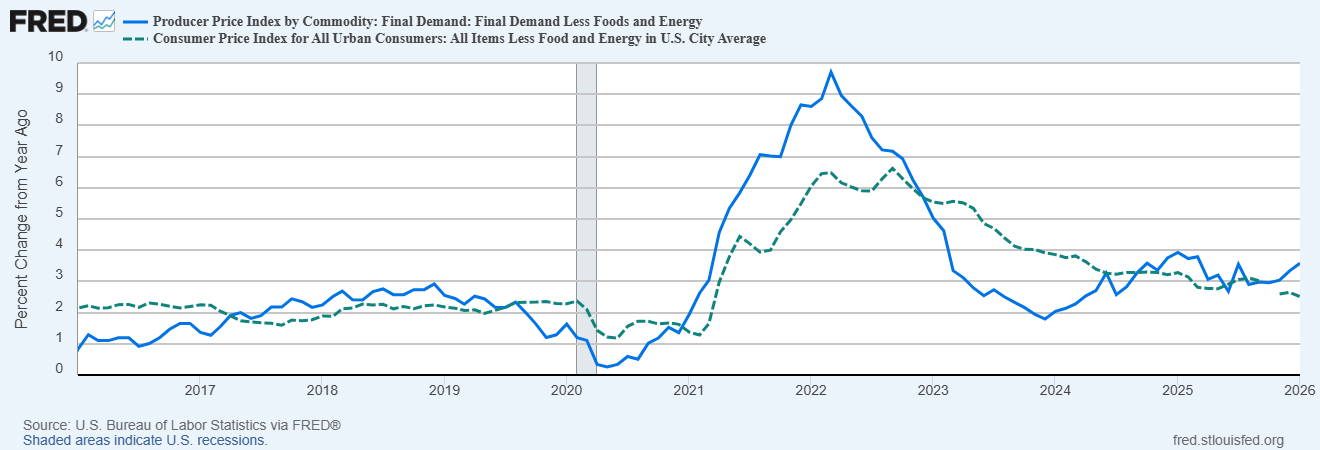
Even before this weekend’s event and potential impact on energy markets and inflation, a hawkish shift was already underway at the Fed. At a time when there is intense political pressure on the Fed to lower interest rates, the minutes of the most recent rate-setting meeting showed that several Fed officials entertained the idea of hiking rates if progress on lowering inflation continued stalling out. Inflationary pressures remain, with key core categories of consumer inflation continuing to run at elevated levels. Leading indicators of inflation are warning of an inflection higher as well. The most recent Producer Price Index (PPI) was reported at a gain of 2.9% in January year-over-year. But the core measure that excludes food an energy prices came in at 3.6% versus estimates for 3.0%. The chart below plots core PPI (blue line) and core CPI (dashed green line), where you can see that PPI often leads key inflection points in consumer inflation.
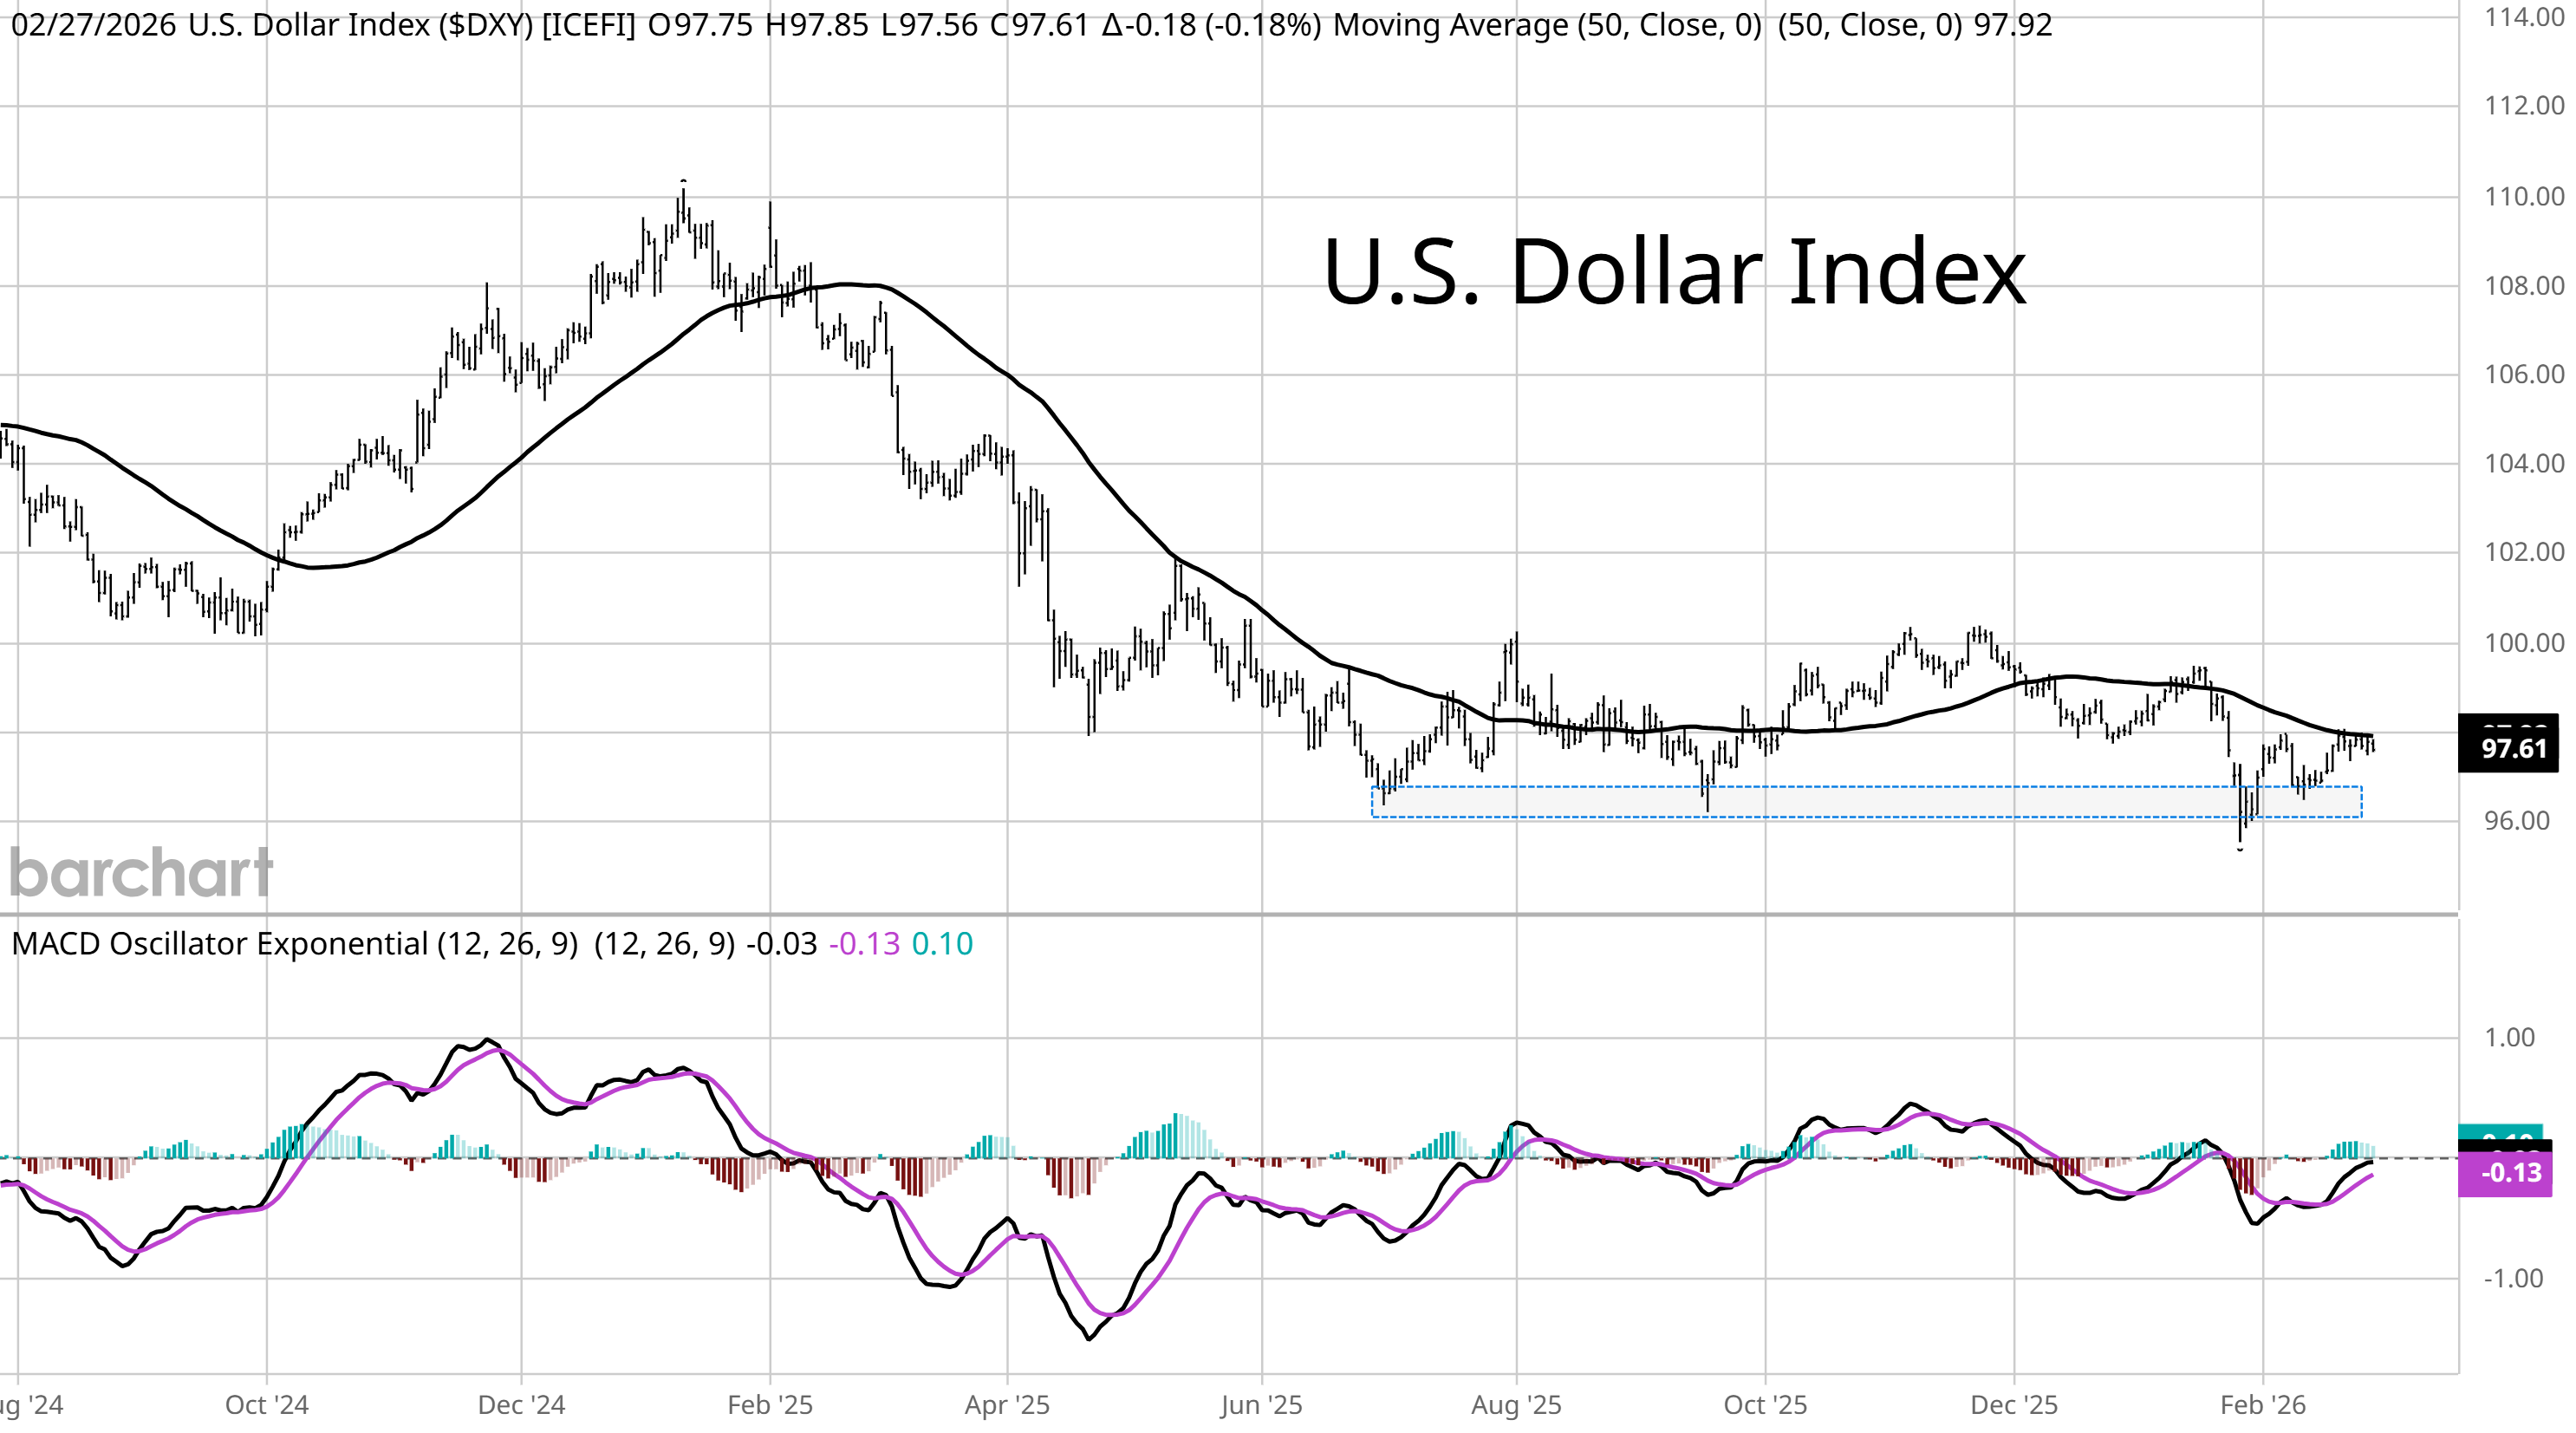
While investor attention will turn toward energy markets and the impact on stock prices this week, there are key levels on the U.S. dollar coming into play. The U.S. Dollar Index (DXY) rallied from a failed breakdown at the 96 support level in late January, and is stalling at a key level. DXY is struggling to push above the 50-day moving average (black line) while price is forming a bearish flag pattern as the MACD resets below the zero line. If DXY is rejected lower, keep close watch of the 96 level that’s held as support going back to mid-2025. A new low in the dollar would be another tailwind for commodities and precious metals and add another risk to the inflation outlook.
Heard in the Hub
The Traders Hub features live trade alerts, market update videos, and other educational content for members.
Here’s a quick recap of recent alerts, market updates, and educational posts:
The Fed’s hawkish pivot is here to stay.
S&P 500 return dispersion running at extremes.
What the rally in energy stocks says about inflation.
The level on the U.S. dollar that could ignite several trades.
Why we might get a chance to boost exposure to gold mining stocks.
You can follow everything we’re trading and tracking by becoming a member of the Traders Hub.
By becoming a member, you will unlock all market updates and trade alerts reserved exclusively for members.
Trade Idea
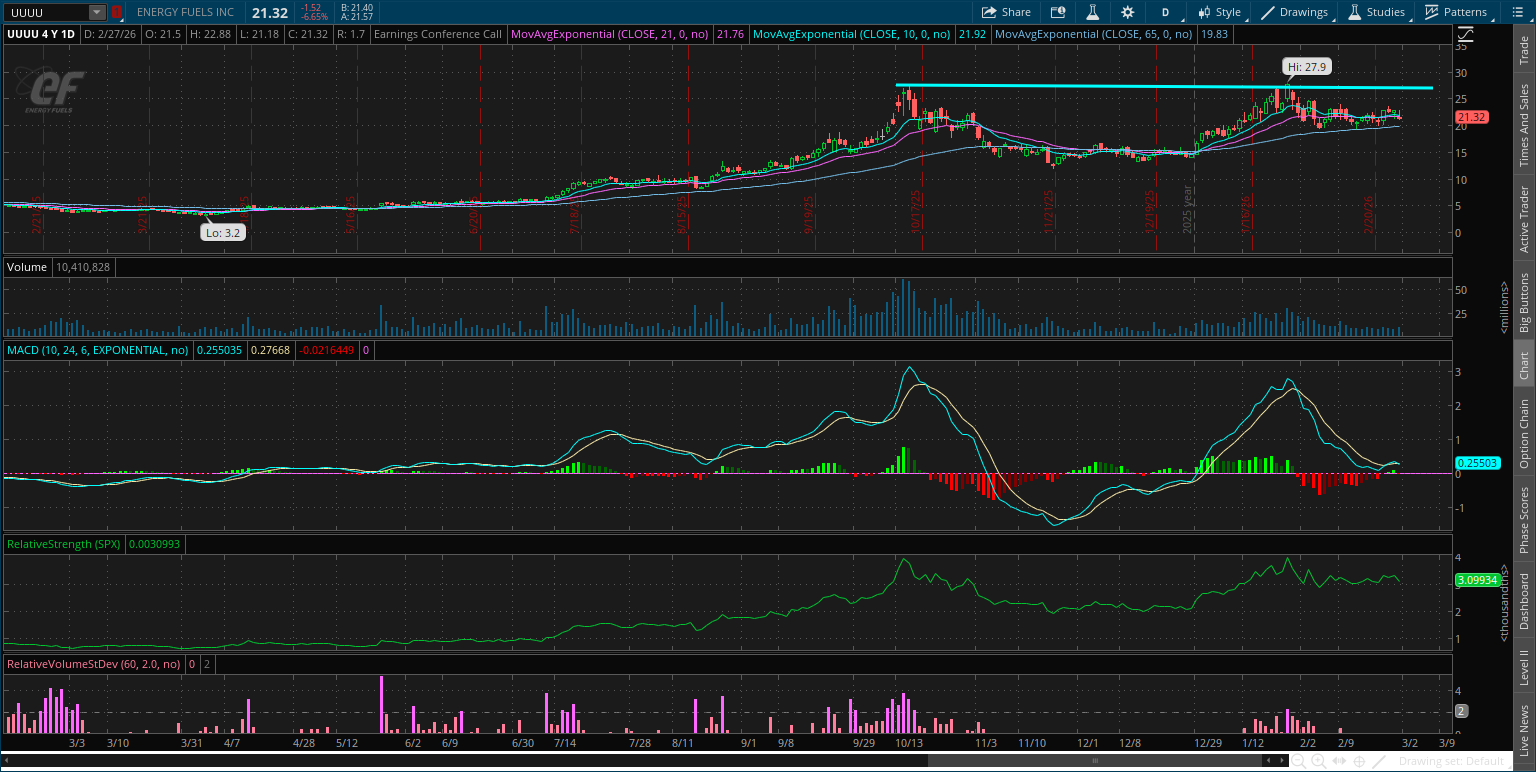
Energy Fuels (UUUU)
Uranium and rare earths stock that peaked near $25 in October and is forming a new pattern. UUUU is making a smaller pullback and bullish MACD reset since late January after a test of resistance. I’m watching for a move over $25.
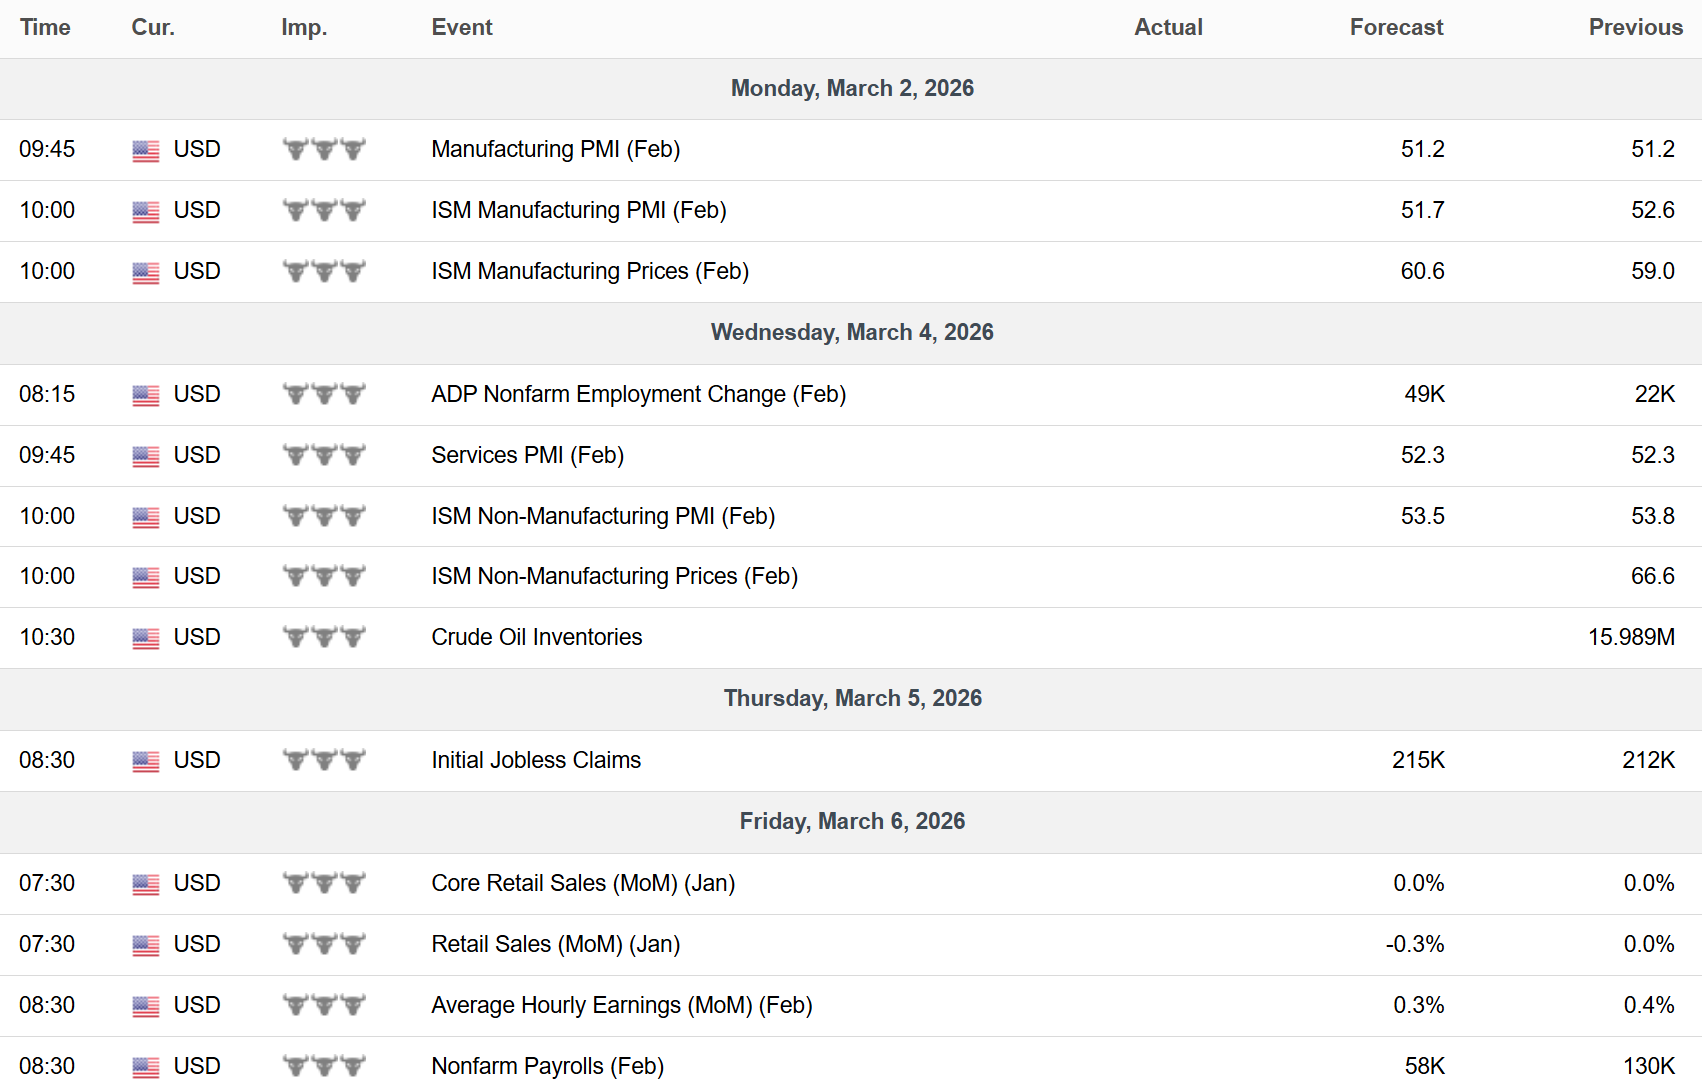
Key Upcoming Data
Economic Reports
Earnings Reports
, Rigetti Computing #RGTI, Norwegian Cruis Line #NCLH, BigBear.ai #BBAI, Marvell Technology #MRVL, and Veeva Systems #VEEV.")
I hope you’ve enjoyed The Market Mosaic, and please share this report with your family, friends, coworkers…or anyone that would benefit from an objective look at the stock market.
Become a member of the Traders Hub to unlock access to:
✅Model Portfolio
✅Members Only Chat
✅Trade Ideas & Live Alerts
✅Mosaic Vision Market Updates + More
Our model portfolio is built using a “core and explore” approach, including a Stock Trading Portfolio and ETF Investment Portfolio.
Come join us over at the Hub as we seek to capitalize on stocks and ETFs that are breaking out!
And if you have any questions or feedback, feel free to shoot me an email at mosaicassetco@gmail.com
Disclaimer: these are not recommendations and just my thoughts and opinions…do your own due diligence! I may hold a position in the securities mentioned in this report.