
The Market Mosaic 2.9.25
Tariff talk igniting the inflation outlook.

👋Welcome back to The Market Mosaic, where I gauge the stock market’s next move by looking at macro, technicals, and market internals. I’ll also highlight trade ideas using this analysis.
If you find this content helpful please hit that “like” button, share this post, and become a subscriber if you haven’t already done so!
And be sure to check out Mosaic Traders Hub. It’s a members-only platform to alert trade ideas, track a model portfolio of open positions, and further analyze the message coming from the capital markets.
🚨You can start a 7-day free trial to the Hub by clicking here. By starting a trial, you will unlock all market updates and trade alerts reserved exclusively for members.
Now for this week’s issue…
The last two week’s have featured plenty of headline volatility to drive the S&P 500 and the stock market’s biggest names.
Fresh off the DeepSeek news that jolted artificial intelligence (AI) stocks and saw Nvidia (NVDA) lose $600 billion in market value in a single day, President Trump decided to shake things up with tariffs.
Trump followed through on a campaign promise, announcing 25% tariffs on all goods coming from Canada and Mexico along with a 10% tariff on China. The move potentially impacts $1.3 trillion worth of goods, although the tariffs on Canada and Mexico are delayed for 30 days.
That’s driving volatility in the stock market, with the S&P 500 repeating a pattern over the past couple weeks in the chart below. You can see weekend headlines driving a gap lower in the S&P followed by recovery during the week. But since late January, the S&P 500 is also making a series of lower highs that you can see with the arrows.

Tariffs and DeepSeek aren’t the only news moving markets. Encouraging economic data on the manufacturing sector and a miss on January payrolls kept investors guessing about the health of the economic outlook.
Today, let’s take a look at several key charts I’m watching for the economy and capital markets, and how it’s impacting the outlook along with trading opportunities in the making.
After that, you can find a bonus trade idea on a chart setup that I’m monitoring along with key events for the week ahead.
The Chart Report
The January jobs report came in weaker than expected. There were 143,000 jobs created during the month compared to expectations for 169,000. The unemployment rate dipped to 4.0%, which is the lowest level since last May. While there are questions around the impact of snowstorms in the south and the California wildfires on the figures, it nonetheless represents a sharp deceleration from recent monthly reports. The chart below shows the monthly change in payrolls, along with the three- and six-month moving average. Strength in payrolls in recent months have seen the averages inflect higher before this month’s report.

While the payrolls report came in weaker than expected, another key report showed a large improvement in a metric known for leading economic activity. For the month of January, the ISM Manufacturing PMI climbed above 50 for the first time since October 2022. A reading above 50 points to growing activity in the manufacturing sector while below 50 suggests contraction. But it’s the underlying components of the report that are even more encouraging. New orders are considered a leading indicator of activity, and jumped three points to 55.1 during the month. At the same time customer inventories are running below 50. A growing gap between the figures (chart below) is historically positive for forward economic activity.

Small-cap companies in particular could benefit from a rebound in domestic economic activity. Small-caps receive a larger portion of revenues and earnings from the domestic economy relative to large-caps. And earnings growth projections for small-caps are surging higher. The chart below shows the year-over-year change in revenue, net income, and earnings for the Russell 2000 Index of small-cap stocks. Earnings growth hit positive territory in the second quarter last year, and is projected to accelerate sharply throughout this year.

Another potential tailwind impacting small-cap stocks and the market overall are loose financial conditions. Financial conditions reflect the availability and cost of credit. When credit is cheap and plentiful, that tends to be a tailwind for economic activity (and can help the earnings picture as well). The Fed’s Chicago district keeps an index of financial conditions that takes into account money market, debt, and equity market indicators. Helped by a Federal Reserve rate-cutting cycle that started last September, financial conditions remain much looser than average (the zero line marks the average) as you can see in the chart below.

If the January payrolls report did contain an upside surprise, it was linked to the inflation picture. Average hourly earnings are a way to track wage inflation, and showed a year-over-year gain of 4.1% in the payrolls report which was higher than expected. The chart below shows the annual change in average hourly earnings. Looking past the sharp moves around the pandemic, you can see falling wage gains during the disinflation trend that started in mid-2022. But most recently, wage inflation bottomed out last July and is trending higher since.

Developments on the tariff front are igniting surveys of consumer inflation expectations. The chart below shows consumers’ inflation expectations for 1- and 5-years ahead based on a survey by the University of Michigan. Both outlooks for inflation have been trending higher, but the year ahead figure (green line) jumped a point higher as tariff announcements fell within the survey period. The risk is that such views become a self-fulfilling prophecy. Consumers expecting high inflation down the road bring forward future purchases. That creates a feedback loop of higher consumer demand subsequently pushing up inflation.

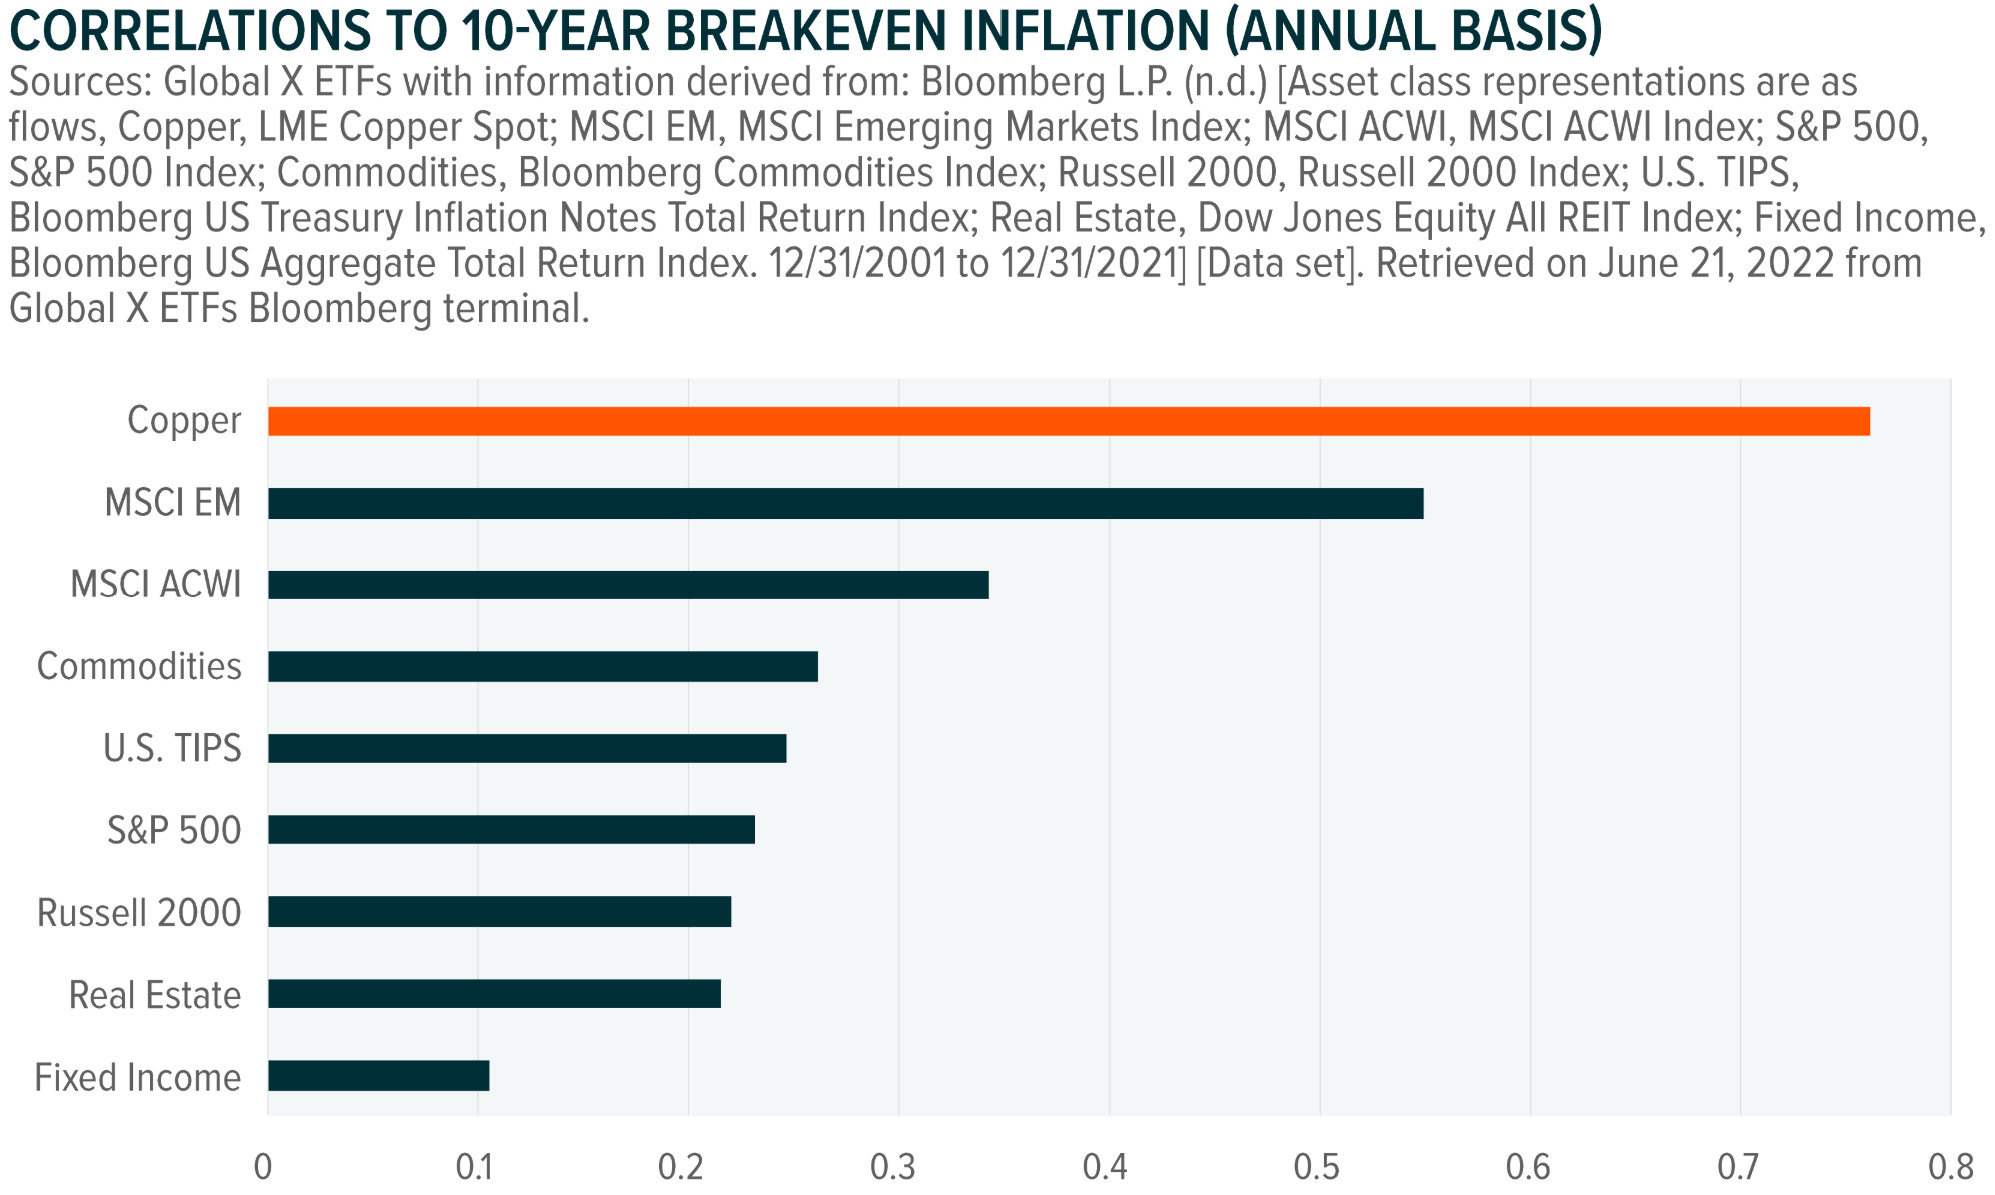
A breakout in one corner of the market is delivering further evidence that inflation could accelerate. Last week, I talked about the setup in base metals with the Invesco DB Base Metals Fund (DBB). Copper is a big component of that fund, and is breaking out of a triangle pattern (similar to the DBB setup) this past week. Given copper prices as an input for all sorts of construction materials, it’s among the first costs to be felt and passed along through supply chains. That makes copper highly correlated to inflation breakeven rates as you can see in the chart below.
Heard in the Hub
The Traders Hub features live trade alerts, market update videos, and other educational content for members.
Here’s a quick recap of recent alerts, market updates, and educational posts:
A crypto chart setup back on our focus list for a trade.
The link (and evidence) between tariffs and commodities.
A commodity trade to capitalize on the breakout in base metals.
How understanding price action can cut through noisy headlines.
You can follow everything we’re trading and tracking by becoming a member of the Traders Hub.
By becoming a member, you will unlock all market updates and trade alerts reserved exclusively for members. 👉You can click here to join now!
Trade Idea
Atour Lifestyle Holdings Ltd - ADR (ATAT)
Rallied back to the post-IPO highs near the $30 level and now trading sideways since the start of October. Now seeing the MACD recover back above zero following a smaller pullback. Support at $24 should hold on any further pullbacks. Watching for a move over $30.

Key Upcoming Data
Economic Reports

Earnings Releases

I hope you’ve enjoyed The Market Mosaic, and please share this report with your family, friends, coworkers…or anyone that would benefit from an objective look at the stock market.
Become a member of the Traders Hub to unlock access to:
✅Model Portfolio
✅Members Only Chat
✅Trade Ideas & Live Alerts
✅Mosaic Vision Market Updates + More
Our model portfolio is built using a “core and explore” approach, including a Stock Trading Portfolio and ETF Investment Portfolio.
Come join us over at the Hub as we seek to capitalize on stocks and ETFs that are breaking out!
And if you have any questions or feedback, feel free to shoot me an email at mosaicassetco@gmail.com
Disclaimer: these are not recommendations and just my thoughts and opinions…do your own due diligence! I may hold a position in the securities mentioned in this report.
Always packed with value 🔮