
The Market Mosaic 2.8.26
Bullish Breakouts in Cyclical Stocks.

👋Welcome back to The Market Mosaic, where I gauge the stock market’s next move by looking at macro, technicals, and market internals. I’ll also highlight trade ideas using this analysis.
If you find this report helpful please hit that “like” button, share this post, and become a subscriber if you haven’t already done so!
🚨And be sure to check out Mosaic Traders Hub. It’s a members-only platform to alert trade ideas, track a model portfolio of open positions, and further analyze the message coming from the capital markets.
Now for this week’s issue…
A plunge in stocks leveraged to the artificial intelligence (AI ) trade along with cryptocurrencies couldn’t stop the Dow Jones Industrial Average from jumping to a record high above 50,000.
To many investors, it probably appeared that a significant “risk off” move was underway across the capital markets. High profile AI stocks like Palantir (PLTR) and Microsoft (MSFT) saw steep losses and are now 34% and 28% off the highs, respectively.
At the same time, Bitcoin dropped to its lowest level since October 2024, wiping out the entire rally following President Trump’s election win and his administration’s crypto-friendly policies.
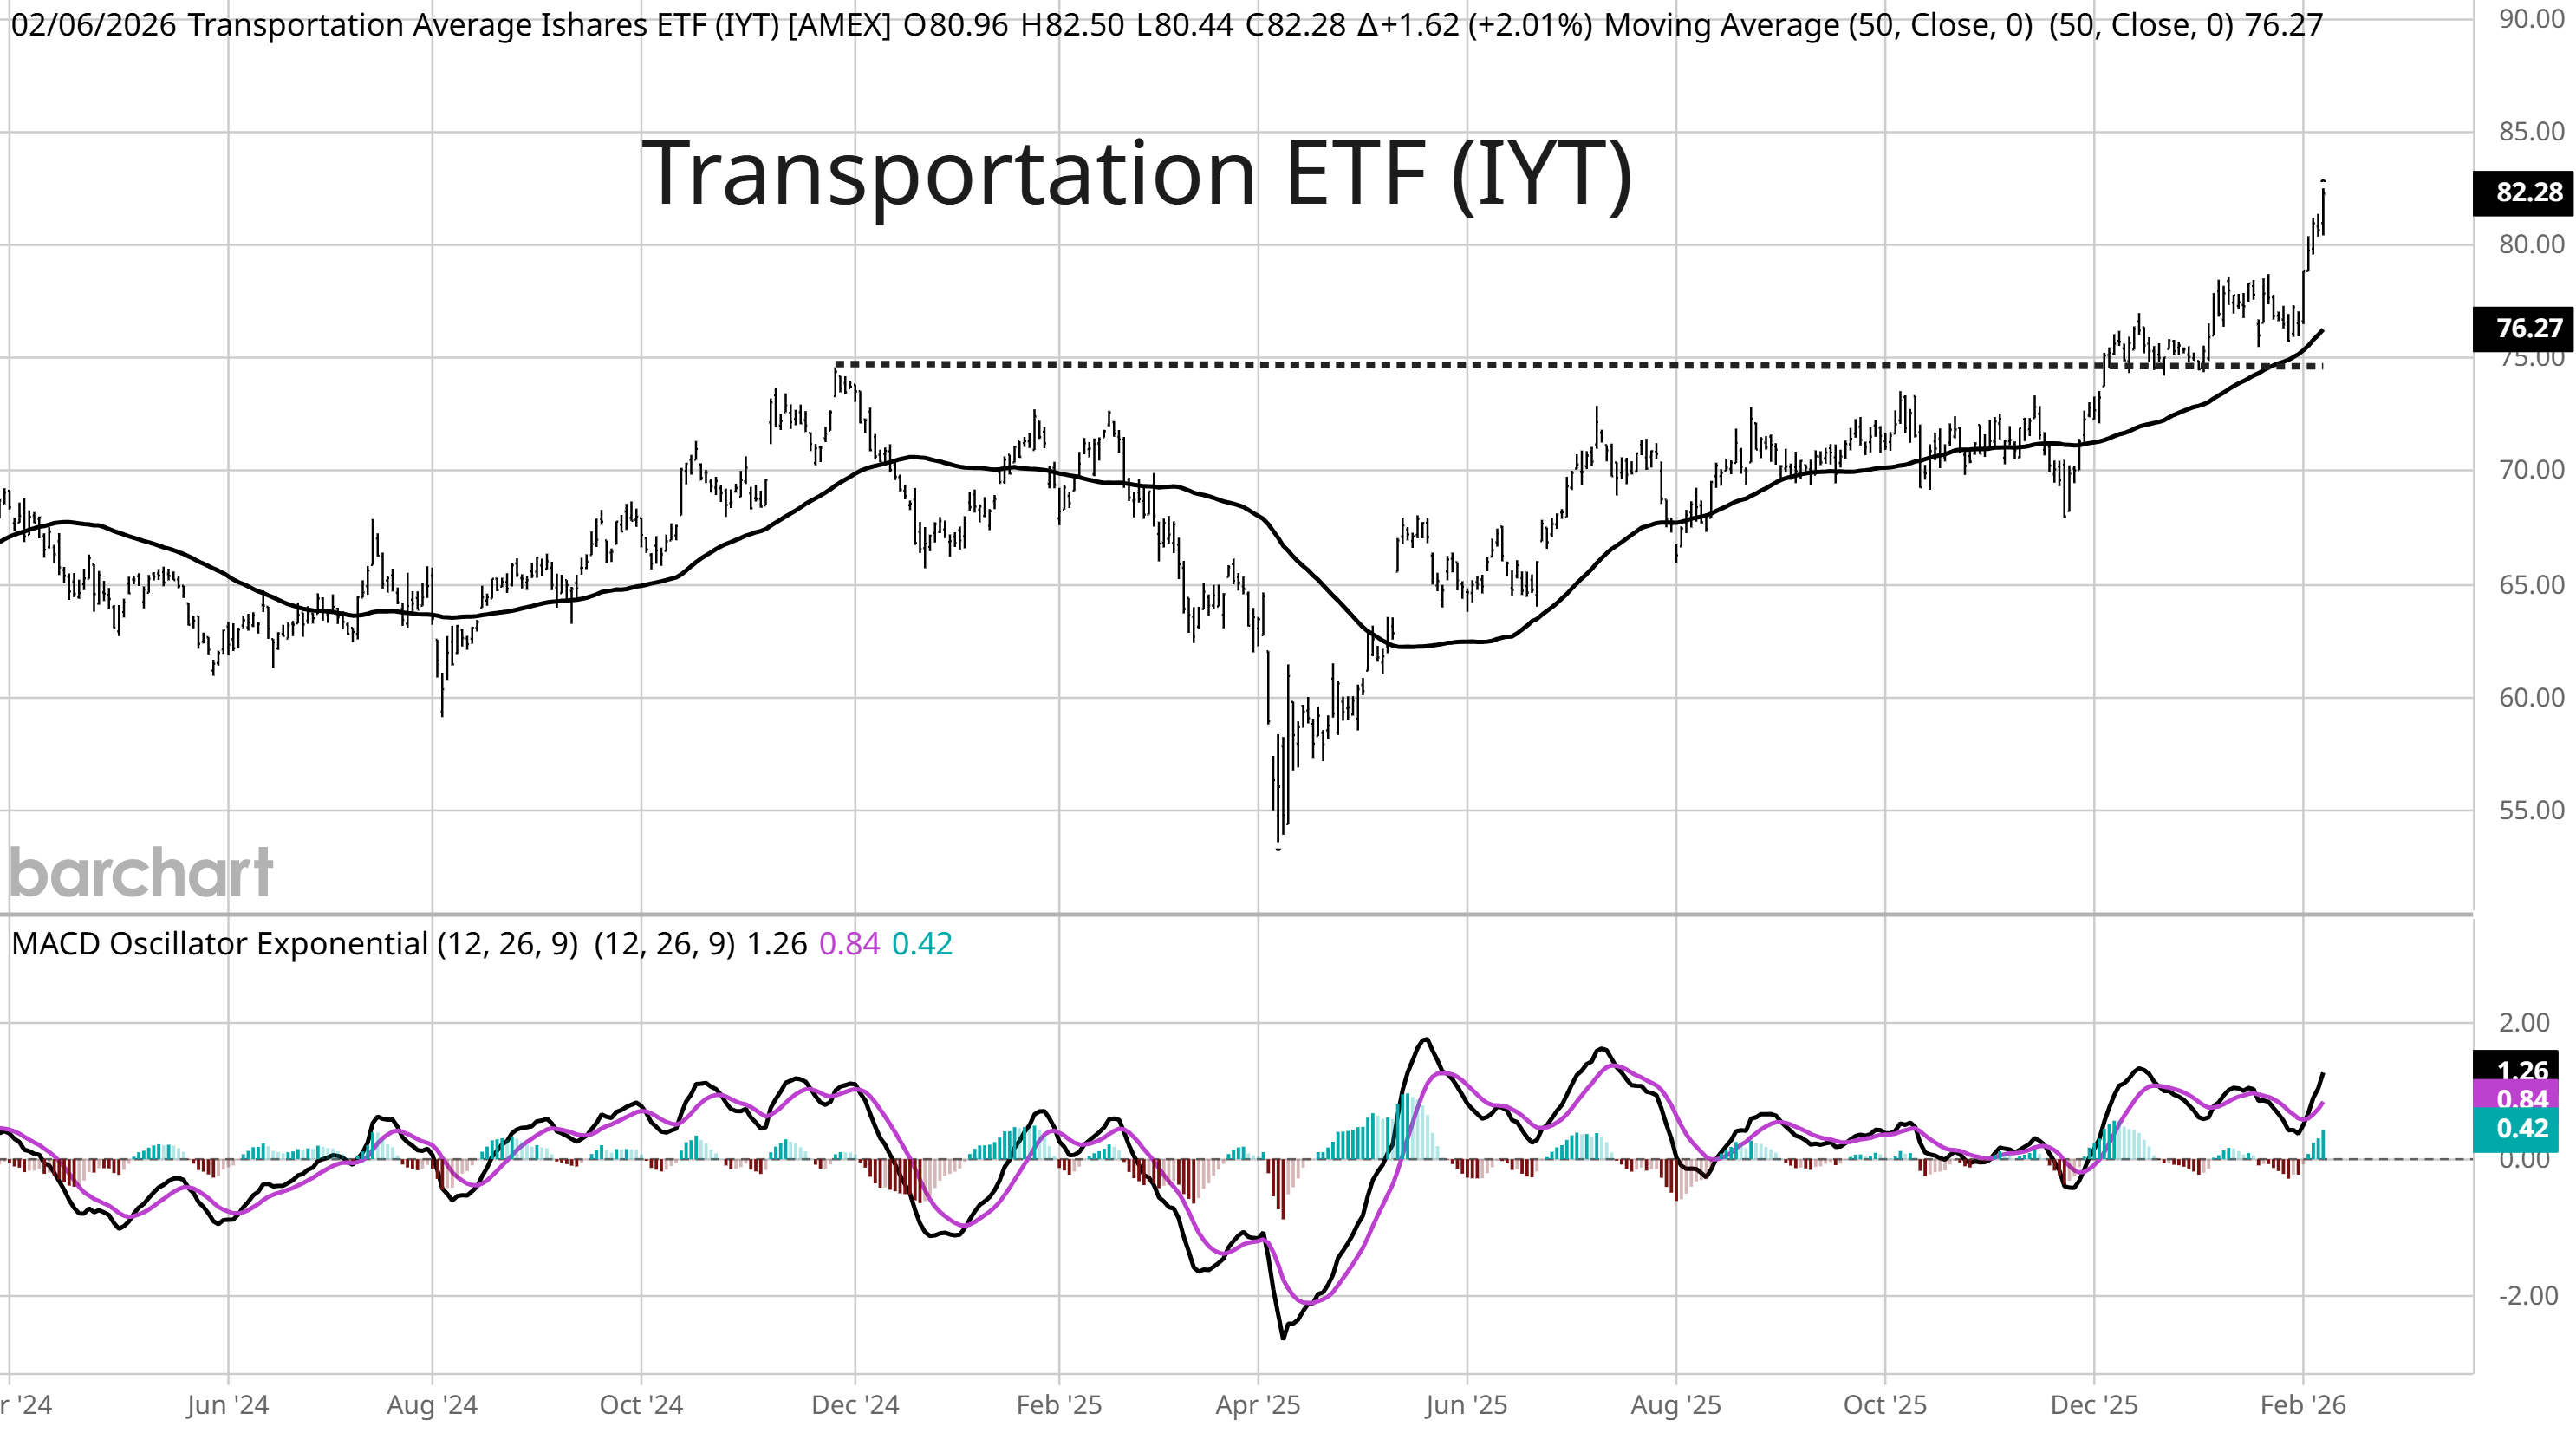
But the movements on the surface distracted from bullish developments under the hood. While mega-cap growth stocks are struggling, cyclical sectors are rallying to new record highs.
That includes exchange-traded funds (ETFs) tracking banks, transports (chart below), and industrials. Small- and mid-cap stocks that are more sensitive to developments with the domestic economy jumped to fresh records as well.
A massive rotation has been underway since the start of the year, and it’s a trend that picked up pace last week. By some measures, momentum stocks saw historic underperformance relative to value shares.
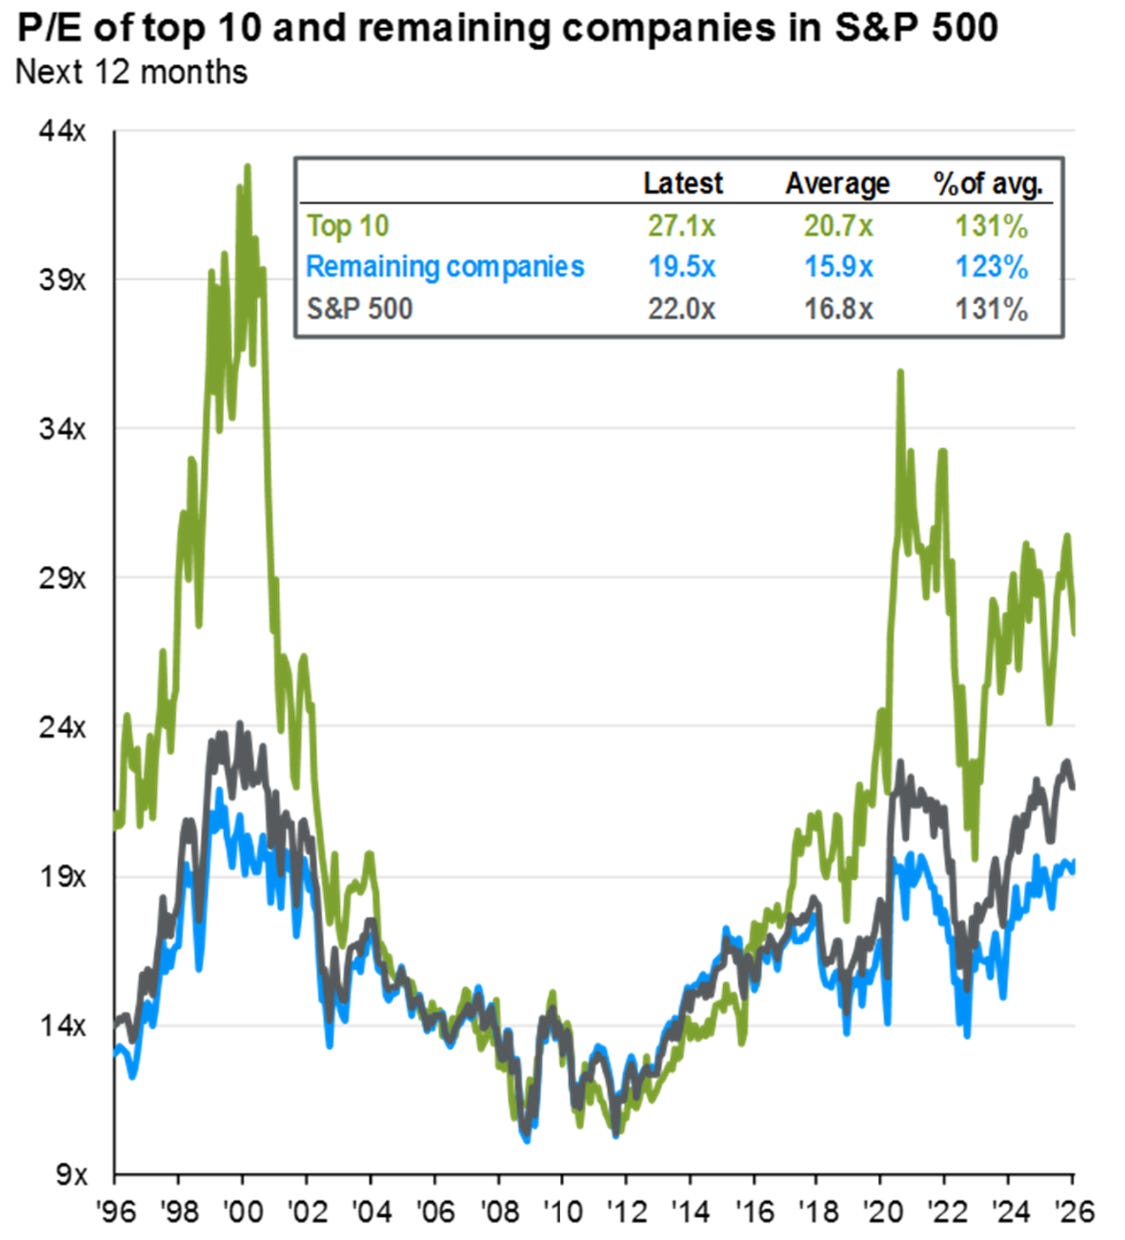
I believe a major driver is the outlook for economic growth and what it means for interest rates, which is leaving overvalued areas of the market exposed. Valuations in the top 10 stocks in the S&P 500 are running well above their historical average.
This week, let’s examine the catalysts behind the selloff in growth and AI stocks and why it’s boosting other market sectors. We’ll also look at the state of market valuations, and why the stock market is vulnerable to developments impacting interest rates and inflation.
The Chart Report
It’s no secret that stocks leveraged to massive investments and spreading adoption in AI have been among the top performing stocks since this cyclical bull market started in late 2022. That trend continued into late 2025, with many of the market’s top performing stocks residing in speculative growth and stocks with high valuations. Those stocks rank well on the momentum factor used by quantitative investors, which favors the best performing stocks over intermediate lookback periods (like six and 12 months). But many of the stocks ranking well on the momentum factor peaked in late 2025, while the unwinding of the momentum factor picked up pace last week. Momentum saw its worst daily return relative to the value factor since 2020 (chart below).

Given investor excitement and exposure to the type of stocks ranking well on the momentum factor, last week’s selloff in AI companies and growth stocks in general likely had a massive “risk off” feel. That includes many members of the “Mag 7”, which weighed on the S&P 500 and Nasdaq given their massive weight. But the moves are masking a surge in the average stock, which are having their best start to the year relative to the cap-weighted index in over three decades. The chart below shows the year-to-date spread between the cap-weighted S&P 500 versus the equal weight version of the index. The average stock is outperforming the cap-weighted index by 4.2% through last week, which is the best start since 1992.

A major catalyst driving the diverging performance in growth and AI stocks compared to cyclicals is coming down to the outlook for economic growth and what it could mean for interest rates and inflation. For instance, last week saw the release of the ISM Manufacturing PMI for the month of January which rose to its highest level in four years. The leading new orders component surged to its best level since early 2022. Many measures of economic activity are surprising to the upside, which could start to pull long-term rates higher. The chart below overlays an index of economic growth surprises with the 10-year Treasury yield. Going back a couple years, you can see the series tends to be positively correlated which is no surprise as rising growth expectations and the inflation impact should push yields higher. The recent surge in economic surprises could see a corresponding jump in yields soon.

The combination of stronger economic growth and stubbornly high core inflation might starting casting a doubt on the interest rate outlook across the yield curve. While evidence of accelerating economic growth could push longer-dated yields higher, it could also challenge the Federal Reserve on the short-end as well. I believe this is a major catalyst behind the selloff in growth and AI stocks this year given their collectively elevated valuations. The top 10 stocks in the S&P 500 trade at a forward price-to-earnings ratio of 27.1 compared to their historical average of 20.7 (green line in the chart below). Rising rates makes the present value of future corporate profits worth less in today’s terms, while higher rates presents competition for investor capital as well.
With evidence pointing to strong economic activity, investors need to monitor the impact on inflation. Many measures of core consumer inflation have been stuck near 3% year-over-year growth since mid-2024, and there have been warnings across leading indicators that inflation could inflect higher in the months ahead. One recent warning occurred with the most recent Producer Price Inflation (PPI) report for December, where the core figure that strips out food and energy prices rose by 3.3% versus expectations for 2.9%. Another index from Adobe tracks online price inflation, and showed an unusually strong spike in online prices in January. The monthly change in January’s Digital Price Index saw the biggest jump in over a decade (chart below).

Heard in the Hub
The Traders Hub features live trade alerts, market update videos, and other educational content for members.
Here’s a quick recap of recent alerts, market updates, and educational posts:
Is the gold rally finished?
More evidence of a strong economy.
One inflation measure jumping to a record high.
The next semiconductor stock setting up a breakout.
Why forces driving currency debasement are here to stay.
You can follow everything we’re trading and tracking by becoming a member of the Traders Hub.
By becoming a member, you will unlock all market updates and trade alerts reserved exclusively for members.
Trade Idea
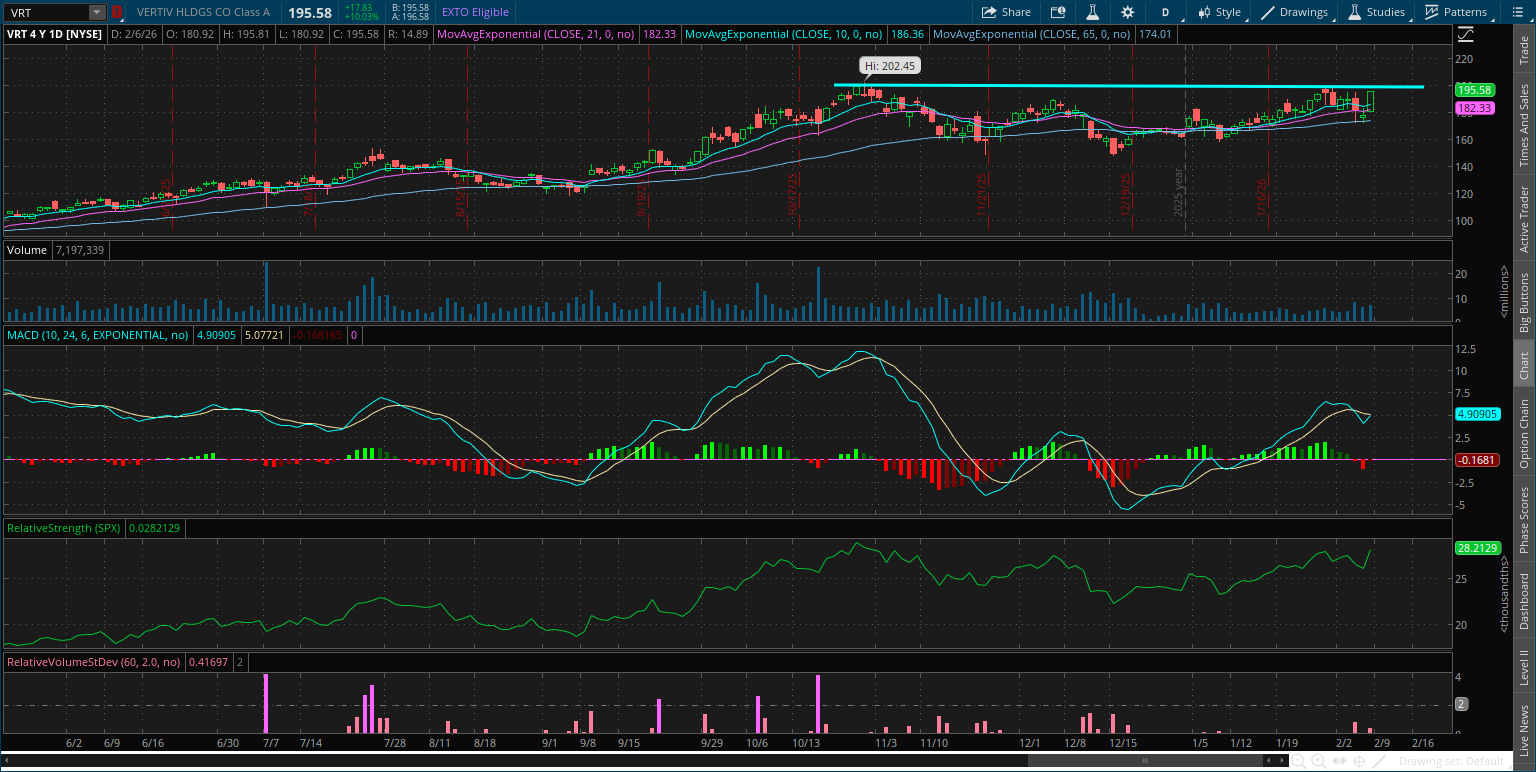
Vertiv Holdings (VRT)
Data center infrastructure stock making a new basing pattern since peaking near $200 back in October. The stock is recently making a smaller pullback after testing resistance, which is resulting in a bullish MACD reset above the zero line. I’m watching for a breakout over $200.
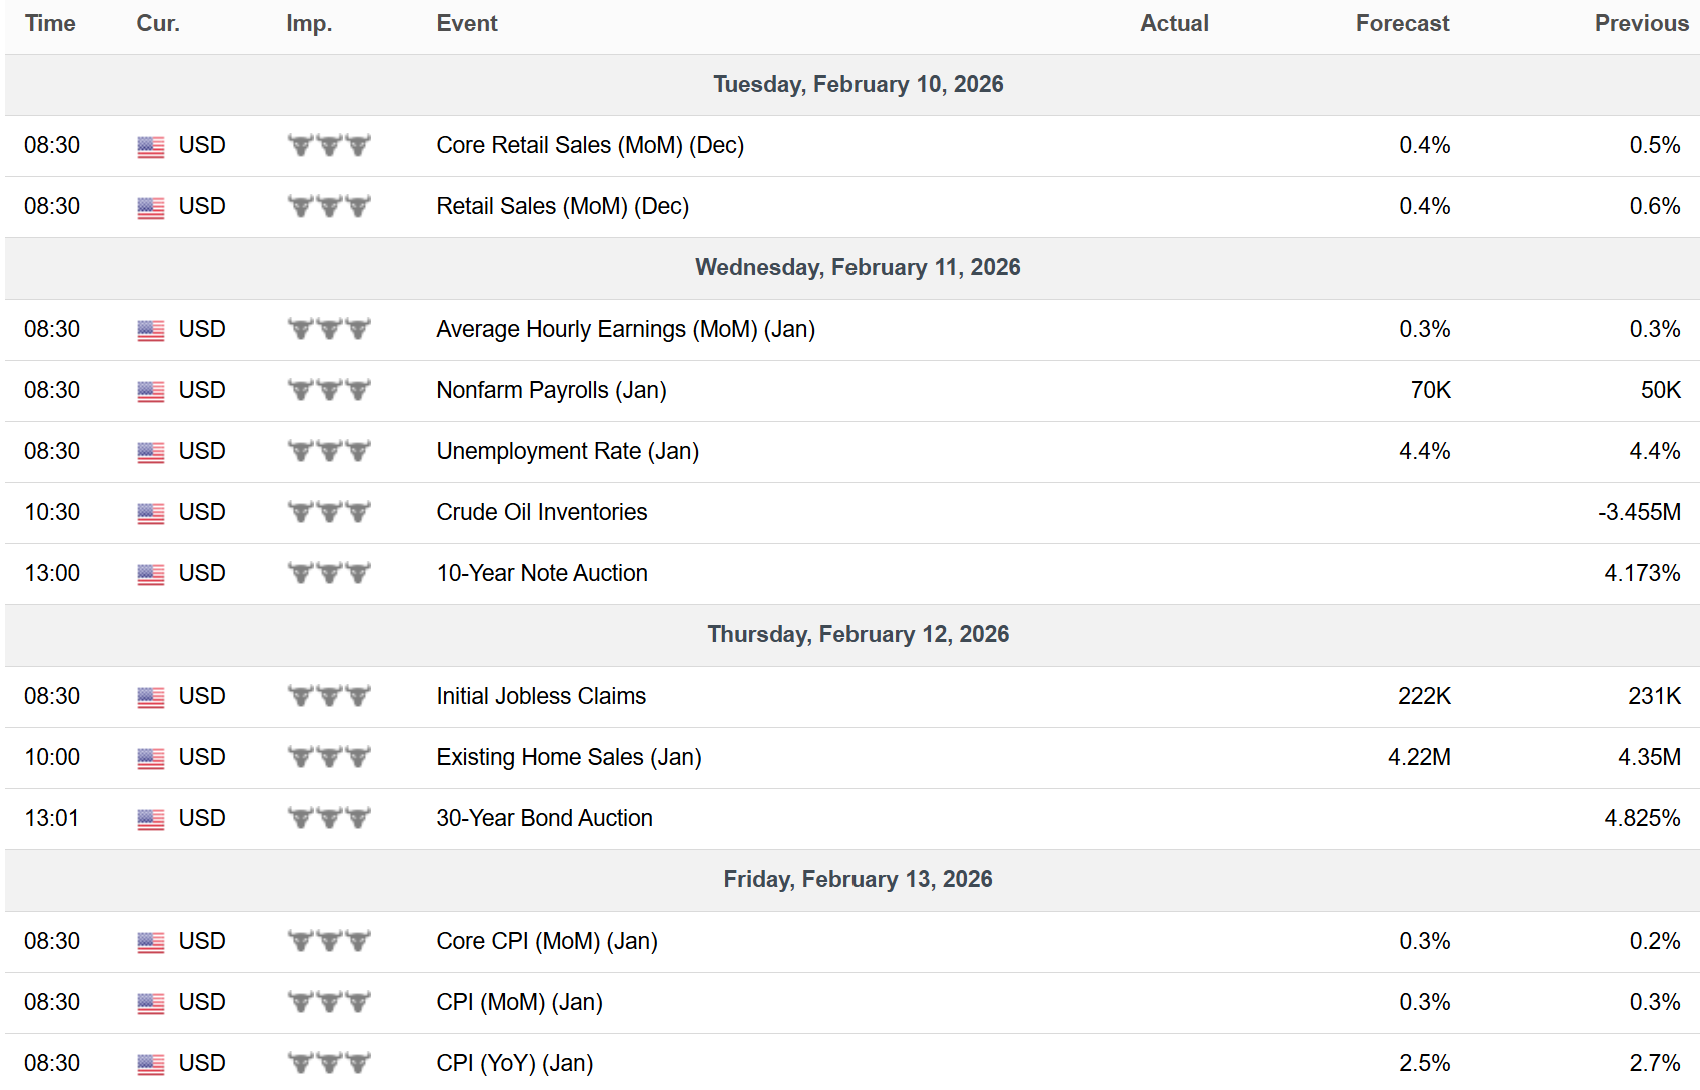
Key Upcoming Data
Economic Reports
Earnings Reports

I hope you’ve enjoyed The Market Mosaic, and please share this report with your family, friends, coworkers…or anyone that would benefit from an objective look at the stock market.
Become a member of the Traders Hub to unlock access to:
✅Model Portfolio
✅Members Only Chat
✅Trade Ideas & Live Alerts
✅Mosaic Vision Market Updates + More
Our model portfolio is built using a “core and explore” approach, including a Stock Trading Portfolio and ETF Investment Portfolio.
Come join us over at the Hub as we seek to capitalize on stocks and ETFs that are breaking out!
And if you have any questions or feedback, feel free to shoot me an email at mosaicassetco@gmail.com
Disclaimer: these are not recommendations and just my thoughts and opinions…do your own due diligence! I may hold a position in the securities mentioned in this report.