The Market Mosaic 2.4.24
S&P 500: Good times just starting?
Welcome back to The Market Mosaic, where I gauge the stock market’s next move by looking at macro, technicals, and market internals. I’ll also highlight trade ideas using this analysis.
If you find this content helpful please hit that “like” button, share this post, and become a subscriber to this always free report if you haven’t already done so!
And be sure to check out Mosaic Chart Alerts. It’s a midweek update covering chart setups among long and short trade ideas in the stock market, along with levels I’m watching.
Now for this week’s issue…
The stock market had every excuse to drop over interest rate fears last week.
That’s because the Federal Reserve successfully executed yet another pivot…this time by pushing out expectations for that first rate cut.
At the start of 2024, odds for a cut as soon as March stood at 73%. After all, you could argue that the fed funds rate (red line) remains in restrictive territory compared to the Fed’s preferred inflation gauge with year-over-year PCE (blue line) below.
But for the past couple weeks, Fed members have been out in force pushing against investor expectations for that first rate cut. And during the Fed’s most recent meeting last Wednesday, the meeting statement and Fed Chair Jerome Powell’s press conference finally got the message through.
Powell specifically said that March is not “what we would call the base case” for the first cut, while also reminding investors that the central bank does not have a growth mandate.
Pushing out the first rate cut was also reinforced by Friday’s blowout payrolls figure. The January jobs report showed 353,000 jobs were created during the month, nearly double what economists were estimating. The pace of job creation has accelerated for the last three months as you can see below.
That suggests the Fed shouldn’t fear keeping rates at these levels with the economy humming along just fine. By the end of the week, odds for a March rate cut stood at 38%, while also dialing back the number of projected cuts this year.
And yet, the S&P 500 finished the week up 1.4% to close at another new record level. Signs of a strong economy may push out that first rate cut, but it means something even more important for stock prices.
Faster Growth Incoming?
If you can ignore the day-to-day volatility in the stock market, you will see that stock prices follow earnings over the longer-term.
Just as the S&P 500 is making new all-time highs, that comes on the heels of forward earnings estimates that were already pushing to new high ground. You can see that in the chart below of the S&P along with forward estimates going back a decade.
Looking at the big picture, good news for the economy is good news for the stock market if that means the earnings outlook is becoming more favorable.
And for stock prices, that’s particularly true when signs align that the rate of change in economic activity is accelerating from a low level, like what I highlighted here with leading economic indicators.
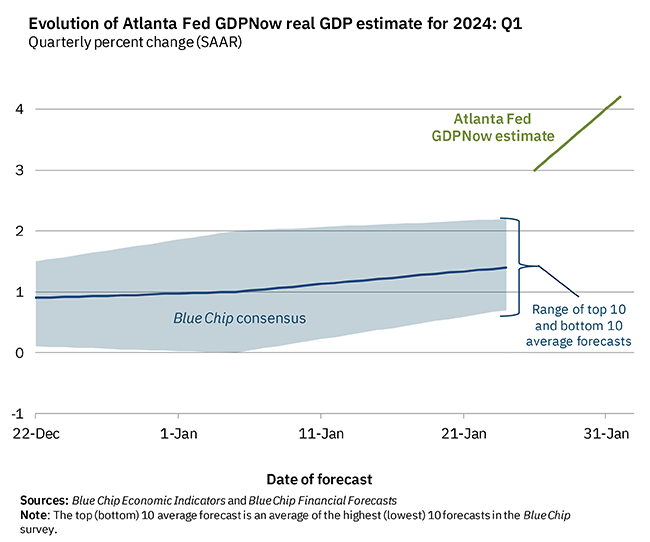
Lagging indicators keep performing well, like Friday’s payrolls report. It’s also notable that the Atlanta Fed’s estimate for 1Q GDP is being revised higher, and now stands at 4.2% annualized as you can see below.
But what if there are more signs emerging that the outlook for economic growth is becoming even more favorable?
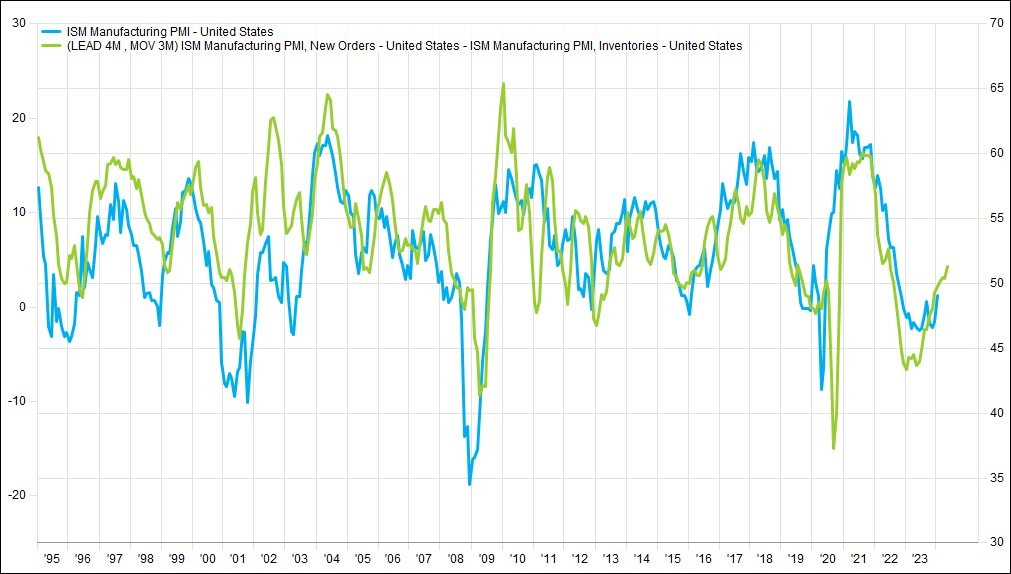
The ISM Manufacturing report wasn’t discussed much last week, but there were important developments in the index’s underlying components. The ISM is a purchasing managers’ index (PMI), which are constructed so that a reading over 50 points to expansion while under 50 indicates contracting activity.
The headline index itself improved to 49.1, which is still in contraction territory but better than estimates for 47.0. But I also follow the spread between new orders and customer inventories within the report.
New orders are a leading indicator, and if inventories are low that indicates the potential for restocking demand as well. When both are happening at the same time, that’s a good sign historically for corporate profits and forward stock returns. The new orders component jumped to 52.5 from 47.0 the prior month, and you can see in the chart below that the ratio of new orders to inventories (green line) is accelerating off a low level.

I also track commodity prices that should be sensitive to economic activity, especially the manufacturing and construction side. I’ve previously discussed the $2 trillion in federal spending bills like the Infrastructure Act, CHIPS Act, and Inflation Reduction Act. There’s also ever-present speculation that China will do more to stimulate its economy.
Instead of guessing when those catalysts will have an impact, I track the prices of steel-making ingredients like iron ore. You would expect steel demand to pick up, which should show up in iron ore prices as well. The chart below shows iron ore for the past 10 years, and has gained over 30% since last April. The next big level I’m watching is $150 per ton to signal growing demand for steel.
For all the talk still around recession and if the economy can achieve a “soft landing”, I believe there is growing evidence that economic growth can start accelerating and keep driving corporate earnings higher.
Now What…
It’s worth noting that expectations for a rate cut haven’t been eliminated…just pushed out. The same market-implied odds discussed earlier point to a 94% chance that rates will be lower following the Fed’s May meeting compared to current levels.
Fed members themselves have also maintained the rate cuts are coming in 2024 so long as inflation keeps progressing toward the Fed’s 2% target. If you annualize the pace of more recent consumer price reports like CPI and PCE, we’re already there.
That’s echoed by data aggregated by Truflation, which tracks a real-time gauge of year-over-year consumer price inflation. Its measure is now down to 1.41% year-over-year as you can see below.
I’ve written recently about the diverging stock market path when the Fed starts cutting rates, which really comes down to the economy avoiding a recession (or not, and the impact that would have on earnings).
The goldilocks scenario is still a disinflationary environment that leads to rate cuts while a growing economy and corporate profits supports the stock market.
The chart below from AlphaPicks does a great job showing how well the stock market responds to such a backdrop. Over the past 40 years, five of the best 10 years for the S&P 500 happened against a back drop of an easing Fed while the economy avoids recession.
Overall, I still believe the longer-term outlook for the stock market and economy are strong. In addition to signs that growth could accelerate further, the right stock sectors keep leading the way like with homebuilders, industrials, and semiconductors.
Near-term, stock market breadth remains a concern. The 20.3% rally in Meta (META) and 7.9% rally in Amazon helped propel the S&P 500 1.1% higher on Friday. Meanwhile, the number of stocks making new 52-week highs barely outpaced the number of new 52-week lows that same day.
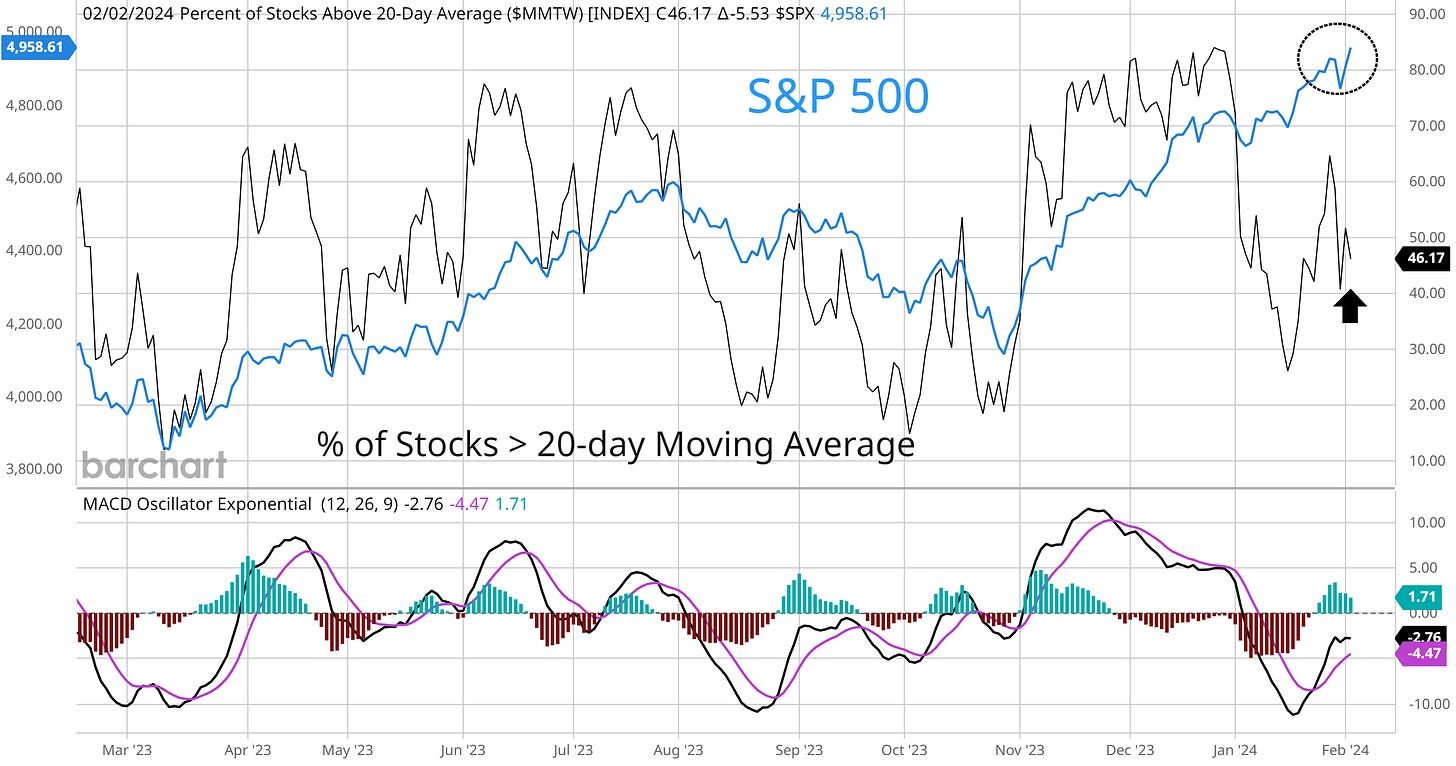
Another growing breadth divergence is with the number of stocks trading above their 20-day moving average as you can see below. After rebounding from an oversold condition, this metric shows that less than half of all stocks across the market are in short-term uptrends despite the S&P jumping to new highs.
While breadth developments are concerning, I ultimately place the greatest weight on price action. I mentioned above that the right sectors keep leading the way, and we’re still seeing breakouts in key stocks like Caterpillar (CAT) working higher.
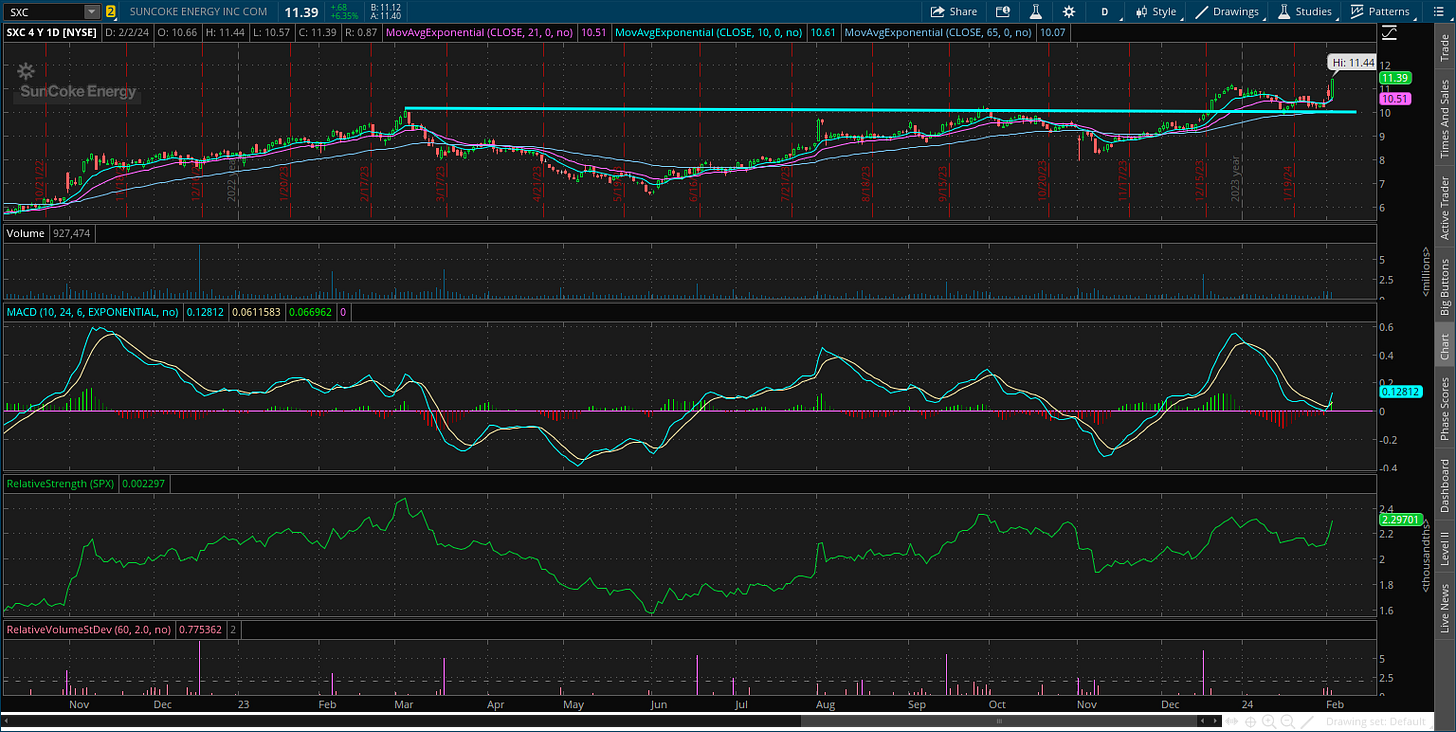
On Friday, I also noted the setup in Suncoke Energy (SXC). The stock broke out from an ascending triangle where resistance was at $10, and then back tested that level while resetting the MACD. SXC is now moving out of that month long base. I would also note that SXC produces metallurgical coal…another steel-making ingredient.
That’s all for this week. The coming week’s economic calendar is much lighter, although there are several Fed speakers scheduled to deliver comments following last week’s rate-setting meeting. At the same time, another 20% of the companies in the S&P 500 will report earnings. While I’ll be monitoring short-term breadth divergences, I’m also looking for confirmation from earnings reports that the long-term outlook for growth is perking up.
I hope you’ve enjoyed The Market Mosaic, and please share this report with your family, friends, coworkers…or anyone that would benefit from an objective look at the stock market.
And make sure you never miss an edition by subscribing here:
For updated charts, market analysis, and other trade ideas, give me a follow on X: @mosaicassetco
And if you have any questions or feedback, feel free to shoot me an email at mosaicassetco@gmail.com
Disclaimer: these are not recommendations and just my thoughts and opinions…do your own due diligence! I may hold a position in the securities mentioned in this report.


Thanks for sharing. Lots of great charts and data in this article.