The Market Mosaic 2.26.23
Good news for the economy is bad news for the stock market, but I'm focusing on this message instead.
Welcome back to The Market Mosaic, where I gauge the stock market’s next move by looking at macro, technicals, and market internals. I’ll also highlight trade ideas using this analysis.
If you find this content helpful please hit that “like” button, share this post, and become a subscriber to this always free newsletter if you haven’t already done so!
And be sure to check out Mosaic Chart Alerts. It’s a midweek update covering my best chart setups among long and short ideas in the stock market, along with levels that could trigger a trade.
Now for this week’s issue…
February is reminding us that good news for the economy is spelling bad news for the stock market.
The month has seen a string of better-than-expected economic reports, starting with the blockbuster payrolls figure showing 517,000 jobs created in January. And if there was any doubt that the consumer remains in good shape, spending jumped the most in two years.
That’s fueling strong growth in the underlying economy, with the Federal Reserve’s own estimate of first quarter GDP running at 2.7%, which is well ahead of economist estimates as you can see below.
With no signs that the economy is slowing and yet another inflation report running hotter than expected last week…that’s ratcheting up pressure on the Federal Reserve to keep hiking rates quicker and longer than markets are expecting.
You can see that reflected in the odds of the next rate hike’s magnitude, where market implied estimates currently favor another 0.25% increase. But views are quickly shifting to the possibility of 0.50%, with more on the way while rates stay higher for longer.
The prospect of a more restrictive Fed is being blamed for pressuring stocks. But before economic and inflation data was ever released, we could see the clouds forming on the horizon. That was the signal coming from market structure and internals at the start of February, like when I posted this about an emerging divergence:


That negative breadth divergence was an early warning signal to be on the lookout for weakness that I again highlighted last week along with other reasons to be cautious. So today, lets cut through the noise of trying to anticipate the impact of the next big economic report, and instead evaluate the market through an objective lens.
Conditions Becoming Supportive For a Rally
Going into February, the stock market had three key variables working against it. Participation in January’s uptrend was falling, investors were becoming way too bullish, and seasonality turned into a headwind in the second half of the month. That’s led to a the 5% drop in the S&P 500, but there are signs the pullback is reaching a point of exhaustion.
Consider breadth once again with the percent of stocks trading above their 20-day moving average. Deteriorating participation flagged the decline as I noted above, but now there are signs that breadth is approaching levels that marked the end of past drawdowns. You can see in the chart below that the metric is now at 27% following Friday’s continued downtrend. That’s near readings over the past year that have marked downtrend exhaustion.
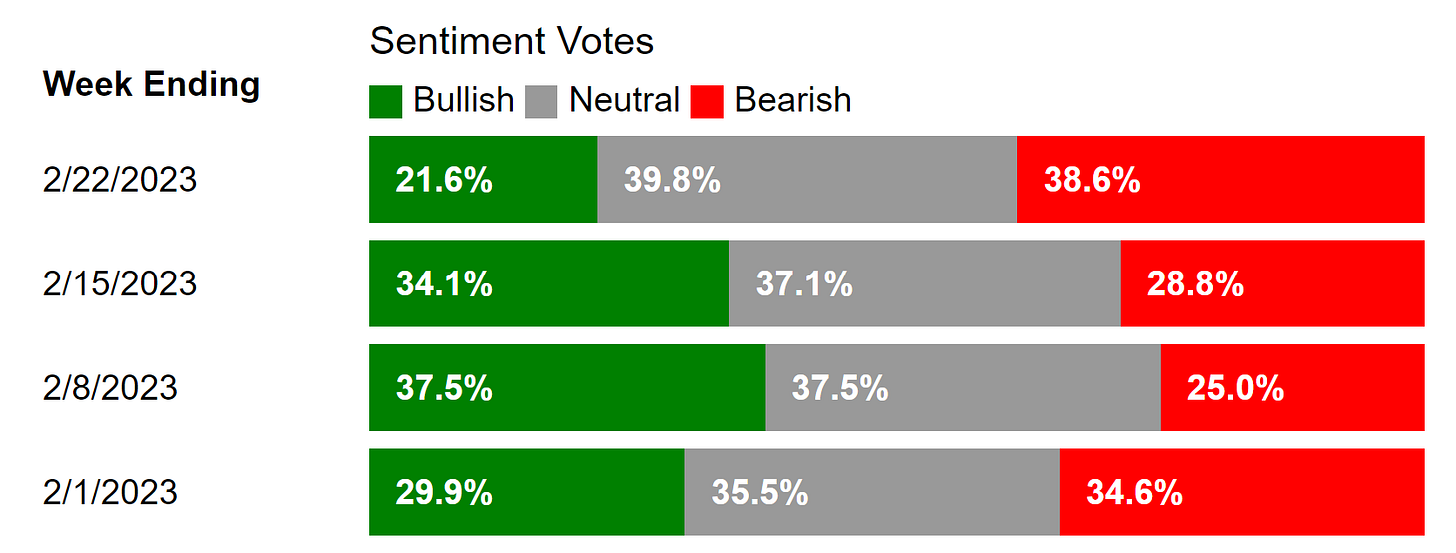
The recent drop in stocks is also clearing out bullish sentiment. The American Association of Individual Investors takes a weekly poll on attitudes toward the stock market. Last week, the number of bulls in the AAII’s survey of retail investors fell to 21.6%, which is among the lower readings seen in the past decade.
And just as stocks are showing signs of becoming oversold and sentiment gets more bearish, the calendar also gets more favorable for stocks. Going into next week, not only can we wave goodbye to February’s shoddy seasonals, but we’re entering a strong two-month period with March and April as you can see in the chart below.
I would never base my trading decisions solely on calendar seasonality, but I do check the historical tendency for trends when breadth and sentiment indicate a change in direction.
With evidence suggesting a more favorable market environment incoming, here’s how I’m adjusting my trading strategy.
Now What…
Breadth, sentiment, and seasonality are all lining up just as the S&P 500 trades at an interesting spot. The index is testing support at the 200-day moving average which is also support from the trendline breakout off the peak at the start of 2022.
The biggest pushback from bears is the pressure on the Fed to keeping hiking interest rates, and the ensuing impact on future economic activity and stock market valuations. But while 2022 conditioned investors to expect stock market weakness when the Fed is raising rates, that’s not always the case.
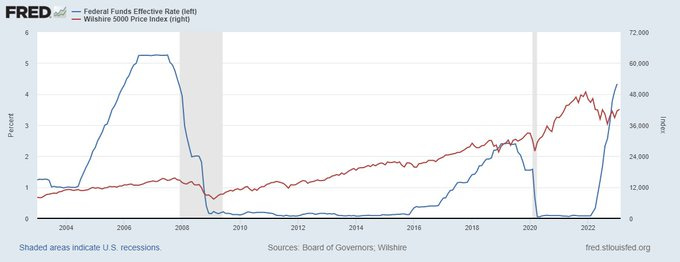
You can see that in the chart below showing the Fed Funds rate (blue line) and the Wilshire 5000 stock market index (red line). Rate hiking campaigns from 2004 through 2007 and again from 2015 through 2019 saw stocks rallying even as rates went higher. Those episodes eventually ended badly, but not before several years of stock market gains. That’s why I’m being open minded and objective about the stock market’s path ahead.
Another encouraging sign is that many charts are holding up and creating fresh breakout patterns. The action in ALG is a great example of this (chart below), where I originally highlighted the breakout setup here. The company operates in the industrial sector, and manufactures equipment for infrastructure and agriculture end markets. Along with the action we’ve seen in other cyclical sectors of the stock market, like transports and semiconductors, that’s an encouraging sign for the economic outlook.
I know there are many conflicting signals around the economy and the stock market at this moment, so I will also say this: I don’t trade based on a forecast. I read and react to what’s happening with my setups and the stock market. An advantage to my strategy is that I stay cash-heavy if breakouts aren’t working or hard to come by.
But there are still many breakout setups taking shape, like with AVNW. I highlighted this setup in Mosaic Chart Alerts, where I discussed how a MACD reset would help the breakout pattern. That’s exactly the action we’re seeing with this retracement (chart below), and is a great example of how February’s pullback is aiding the next batch of setups.
That’s all for this week. There could be an opportunity developing on the long side of the stock market as we head into March. But if weak trends persist and breakouts don’t come around, I will stay in a cash-heavy position and play good defense. The key is to tune out the noise and focus on the message coming from the market!
I hope you’ve enjoyed this edition of The Market Mosaic, and please share this newsletter with your family and friends…or anyone that would benefit from an objective look at the stock market.
And make sure you never miss an edition by subscribing here:
For updated charts, market analysis, and other trade ideas, give me a follow on Twitter: @mosaicassetco
And if you have any questions or feedback, feel free to shoot me an email at mosaicassetco@gmail.com
Disclaimer: these are not recommendations and just my thoughts and opinions…do your own due diligence! I may hold a position in the securities mentioned in this newsletter.


