
The Market Mosaic 2.25.24
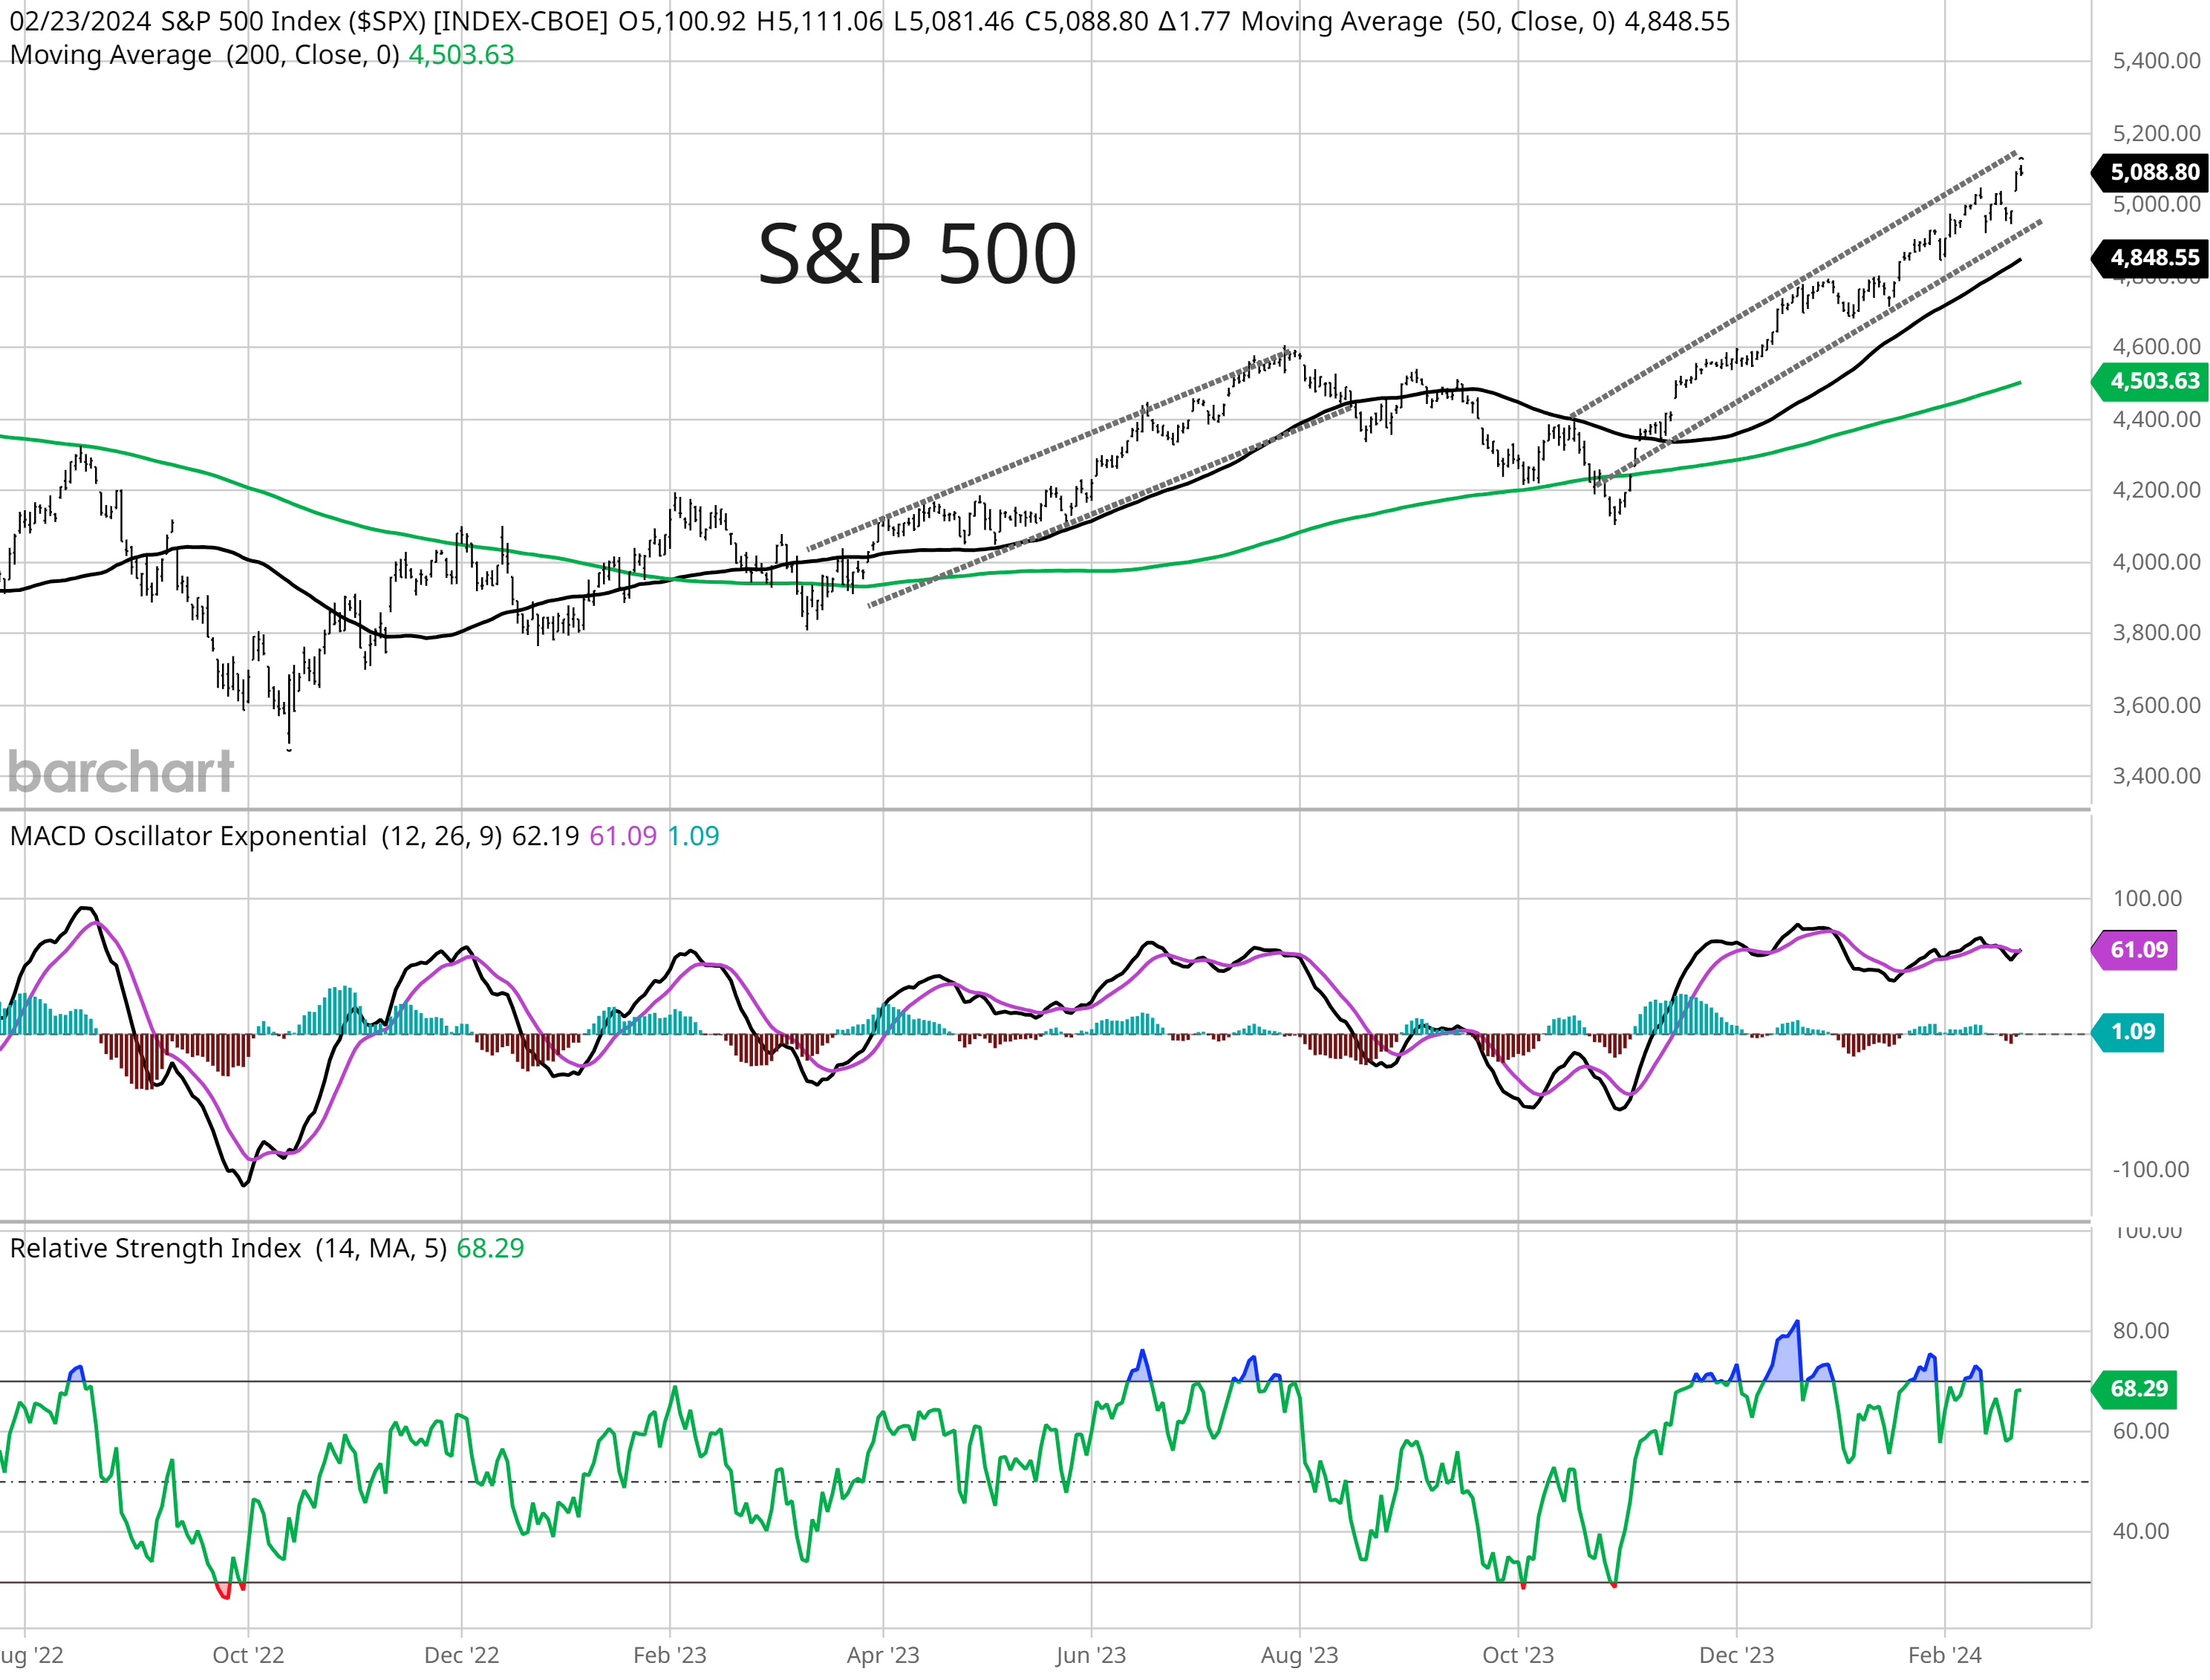
S&P 500: Watching this channel for changes in trend.

Welcome back to The Market Mosaic, where I gauge the stock market’s next move by looking at macro, technicals, and market internals. I’ll also highlight trade ideas using this analysis.
If you find this content helpful please hit that “like” button, share this post, and become a subscriber to this always free report if you haven’t already done so!
And be sure to check out Mosaic Chart Alerts. It’s a midweek update covering chart setups among long and short trade ideas in the stock market, along with levels I’m watching.
Now for this week’s issue…
I’m traveling this weekend, but I still want to highlight a few important charts I’m watching for the capital markets today, and how they are impacting the near-term outlook.
Next, I have a quick summary and links to recent posts that remain impactful for monitoring the markets. And after that, you can find a few bonus trade ideas at the end.
Big Picture
Following a a bottom at the end of last October, the S&P 500 has since broken out to new all-time highs and is building on the gains. One pattern to watch now is a trend channel that the S&P has traded in since the start of that rally. A break below can signal a change in trend, while acceleration above can point to a near-term blow off top in the index. Ideally, the index can keep grinding higher inside the channel.
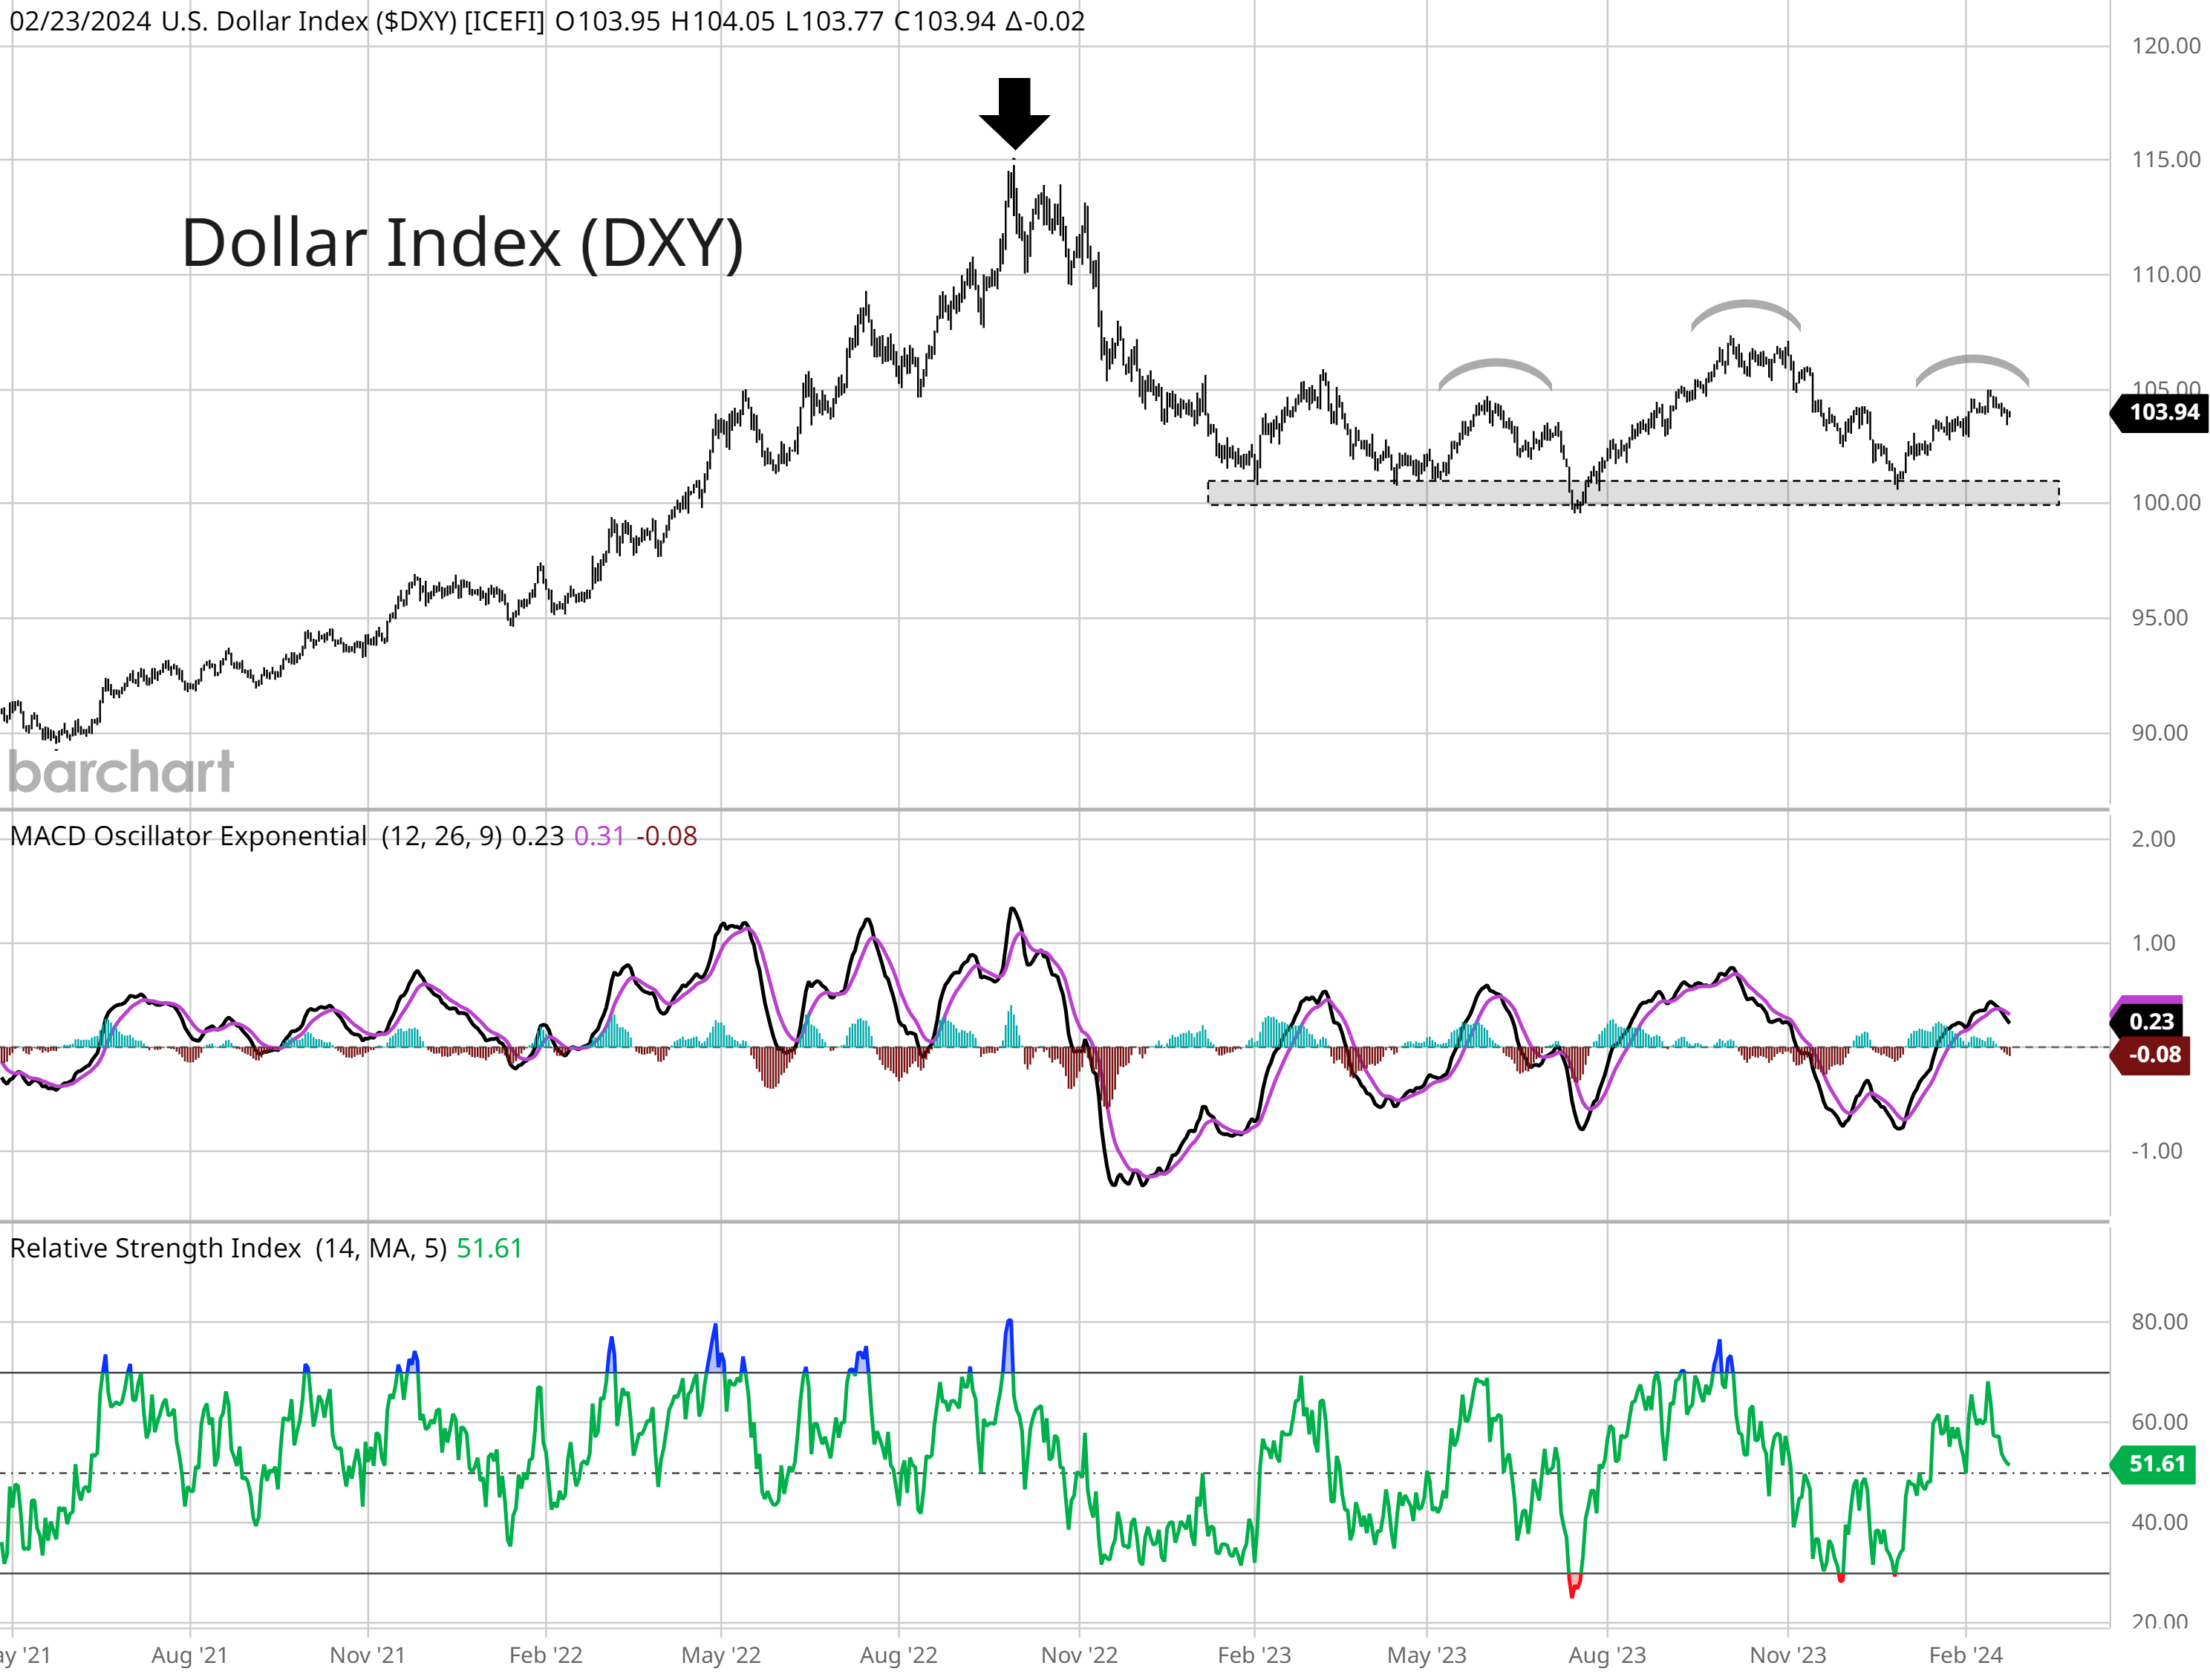
After an important top in late 2022, the U.S. Dollar Index (DXY) has been range-bound since the start of last year. But an important downside continuation pattern could be forming. DXY is potentially making a head and shoulders pattern, where a break of the support zone near the 100 level could lead to the next wave lower in the dollar. Near-term, that would be a risk-on move for equities and could help boost other sectors like commodities.
Gold price have held onto a key breakout on the monthly chart. The monthly candlestick chart below shows the candle closing above the $2,000 per ounce level back in November, which has held so far. A breakdown in the dollar chart above could be a key catalyst for gold to start adding to its breakout.

Another potentially positive catalyst for gold prices is occurring in the options market for gold. Implied volatility among gold call options is dropping to one of the lowest levels in history as you can see below, which previously led to a 75% rally in gold prices back at the start of 2019.

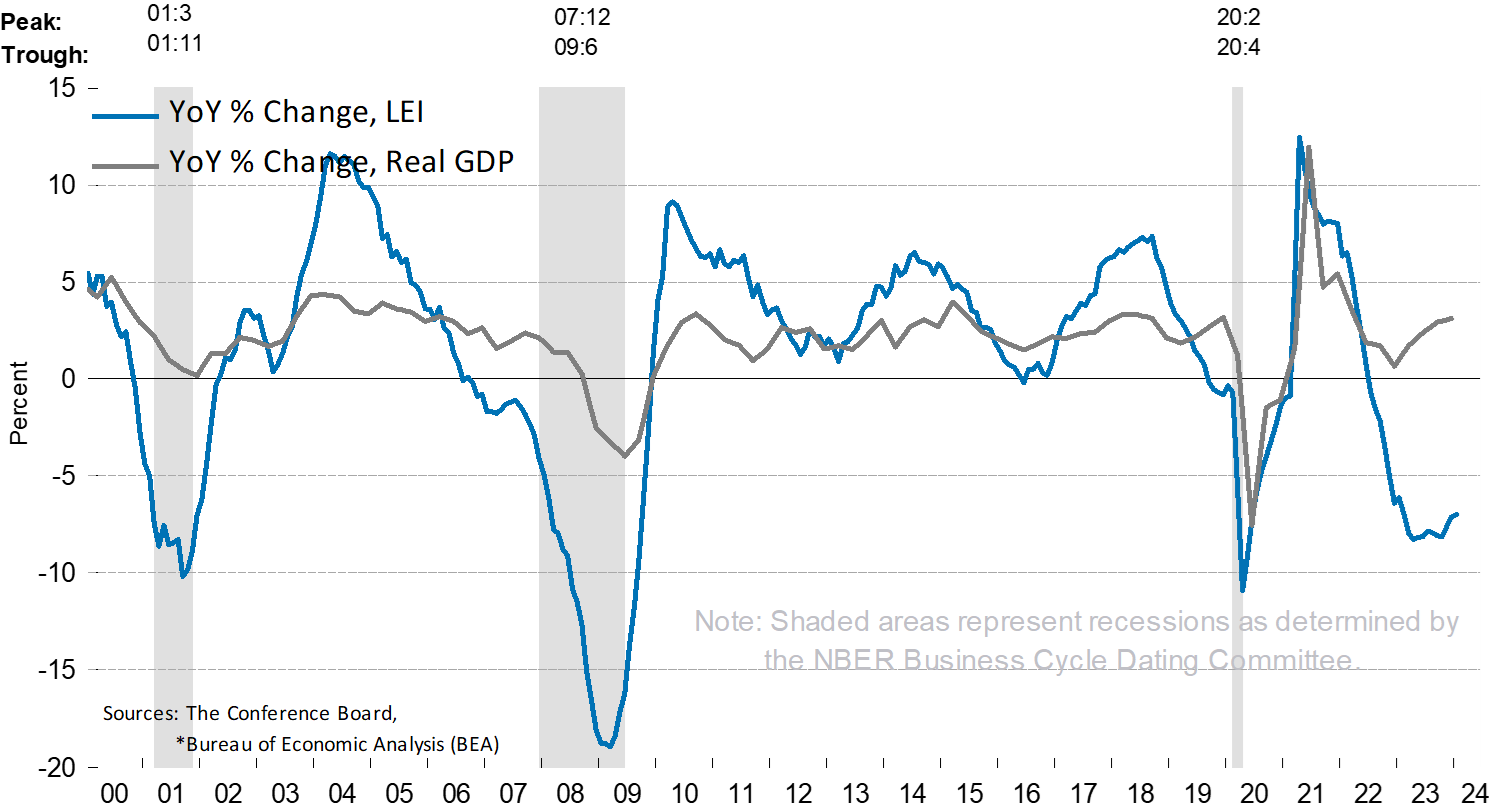
This past week, the Conference Board released an updated look at its Leading Economic Index (LEI) for the month of January. While the index remains in deep negative territory, the year-over-year rate of change (ROC) is still pointing higher off a depressed level. I’ve previously highlighted that a positive LEI ROC from negative territory is historically associated with positive forward stock returns. The Conference Board also noted that six of the ten underlying components were contributors to the six-month ROC for the first time in two years.
Mosaic Tidbits
Here are a few of my recent posts that are still impactful and relevant to the stock market’s next move:
If this bull market has longevity, then I believe it’s important for the average stock to catch-up and participate better. Here’s why a clear uptrend in small-cap growth has marked past easy trading environments.
More data points are inflecting higher to signal an acceleration in the global economy. The positive rate of change is critical to keep the stock market rally intact.
If the outlook for the economy is favorable, then cyclical stock market sectors should provide confirmation. Here’s why the recent action in steel stocks is worth monitoring.
The S&P 500 has continued its big run following a breakout to new all-time highs in January. Here’s how to track the trend, and monitor the potential for mean reversion.
Chart Updates
As I wrap up my weekly scans, here are a few more trade ideas that I’m monitoring.
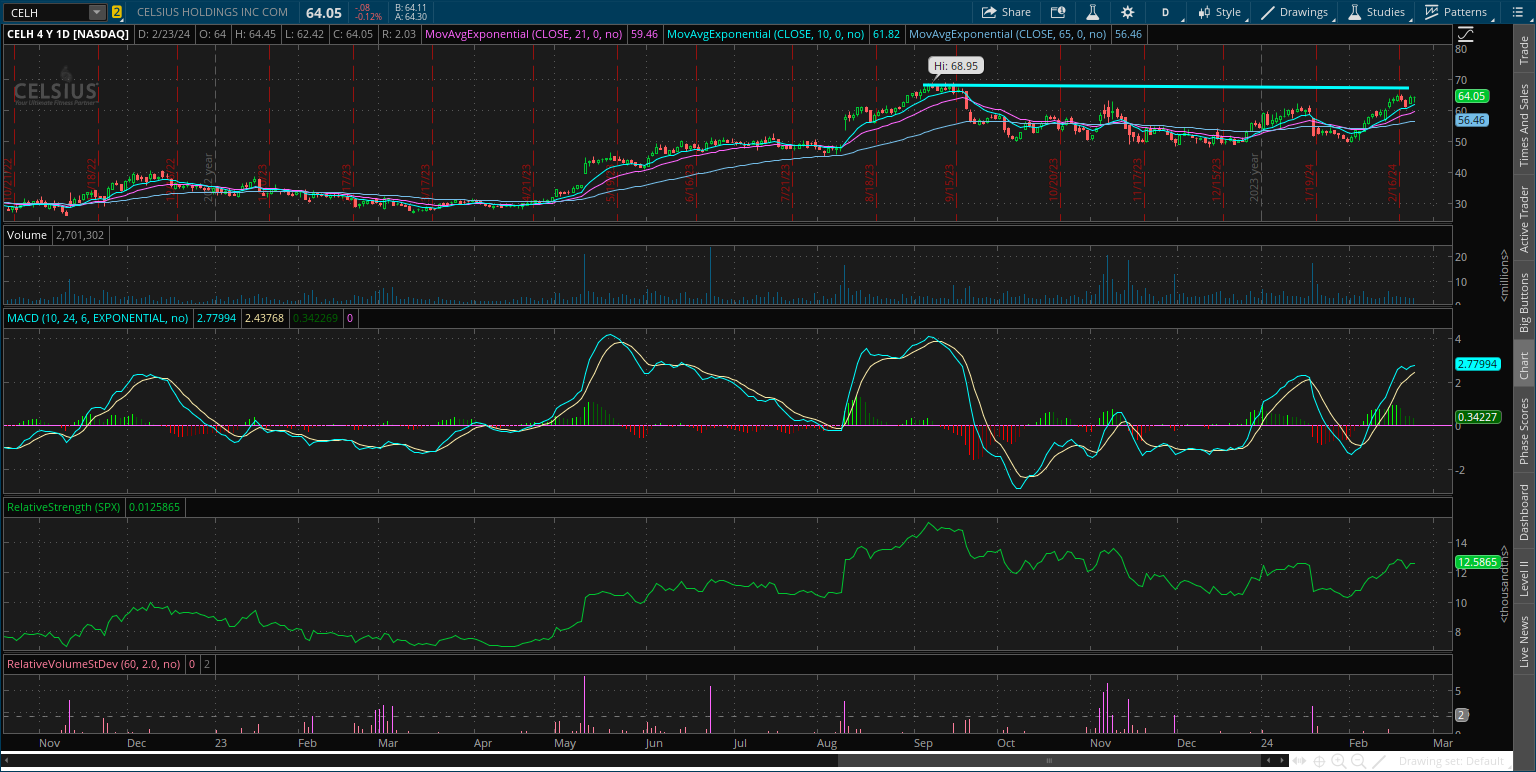
CELH
Stock consolidating since early September following a run to new highs. Initial resistance at the $63 level, but would like to see the MACD reset at zero before attempting a breakout over $70.
DFH
After breaking out to new highs, the stock is consolidating the gains since late December. That’s resetting the MACD, with a new resistance level around the $36 area. Watching for a move over that level with the relative strength (RS) line at new highs.

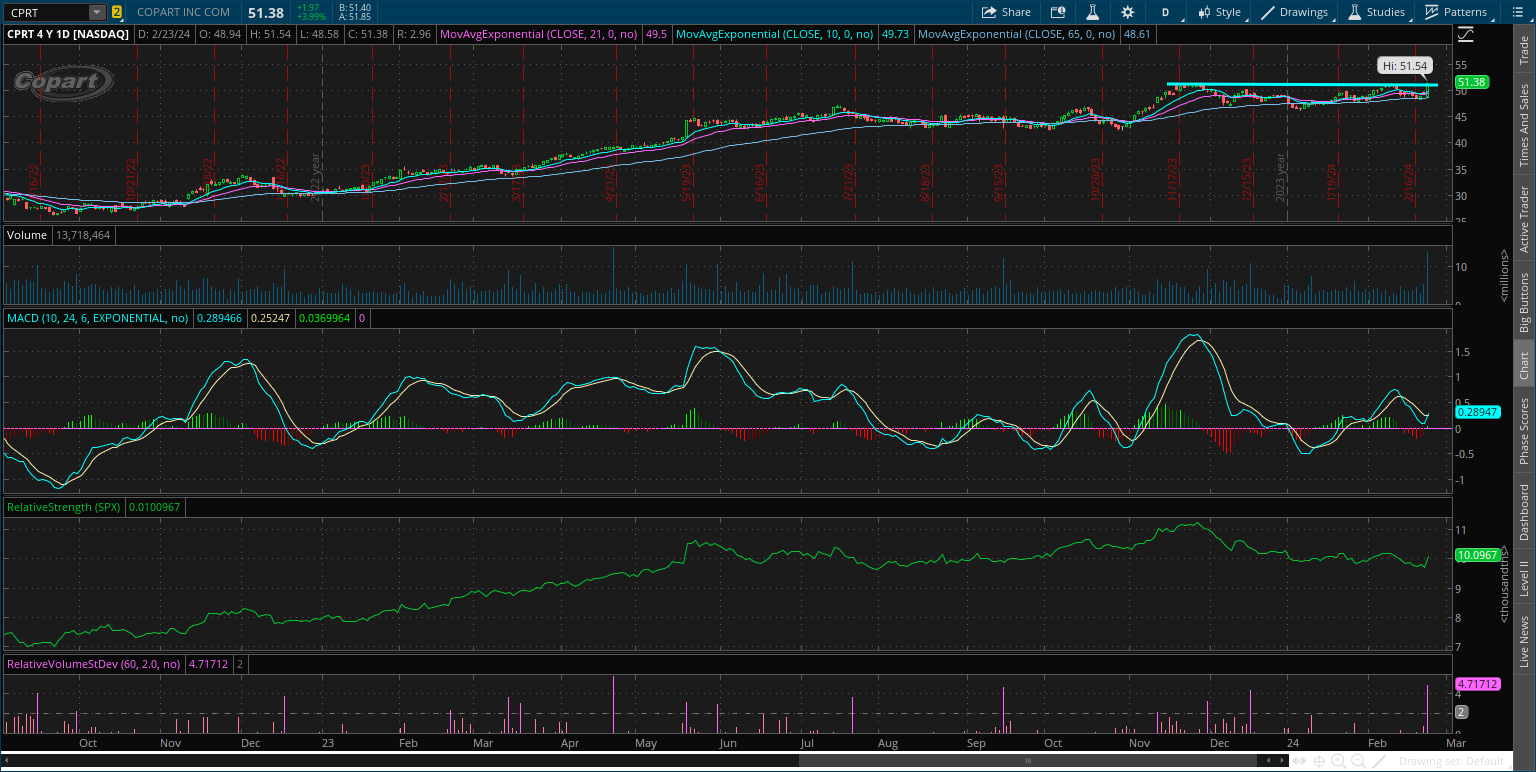
CPRT
After breaking out over the $46 level, price is back testing what is now support and creating a “base-on-base” pattern in doing so. Recent MACD reset at the zero line, and now watching for a move over $52.
That’s all for this week. The coming week will feature the Federal Reserve’s preferred inflation gauge with an updated PCE figure, while several Fed speakers will be making speeches as well. While investor attention will pivot back to what that means for monetary policy, I’ll be tracking the action in small-caps, the dollar index, and gold prices.
I hope you’ve enjoyed The Market Mosaic, and please share this report with your family, friends, coworkers…or anyone that would benefit from an objective look at the stock market.
And make sure you never miss an edition by subscribing here:
For updated charts, market analysis, and other trade ideas, give me a follow on X: @mosaicassetco
And if you have any questions or feedback, feel free to shoot me an email at mosaicassetco@gmail.com
Disclaimer: these are not recommendations and just my thoughts and opinions…do your own due diligence! I may hold a position in the securities mentioned in this report.