
The Market Mosaic 2.16.25
S&P 500: Poor seasonals incoming.

👋Welcome back to The Market Mosaic, where I gauge the stock market’s next move by looking at macro, technicals, and market internals. I’ll also highlight trade ideas using this analysis.
If you find this content helpful please hit that “like” button, share this post, and become a subscriber if you haven’t already done so!
And be sure to check out Mosaic Traders Hub. It’s a members-only platform to alert trade ideas, track a model portfolio of open positions, and further analyze the message coming from the capital markets.
🚨You can start a 7-day free trial to the Hub by clicking here. By starting a trial, you will unlock all market updates and trade alerts reserved exclusively for members.
Now for this week’s issue…
A pair of hotter than expected inflation reports are recalibrating the outlook for interest rate cuts by the Federal Reserve.
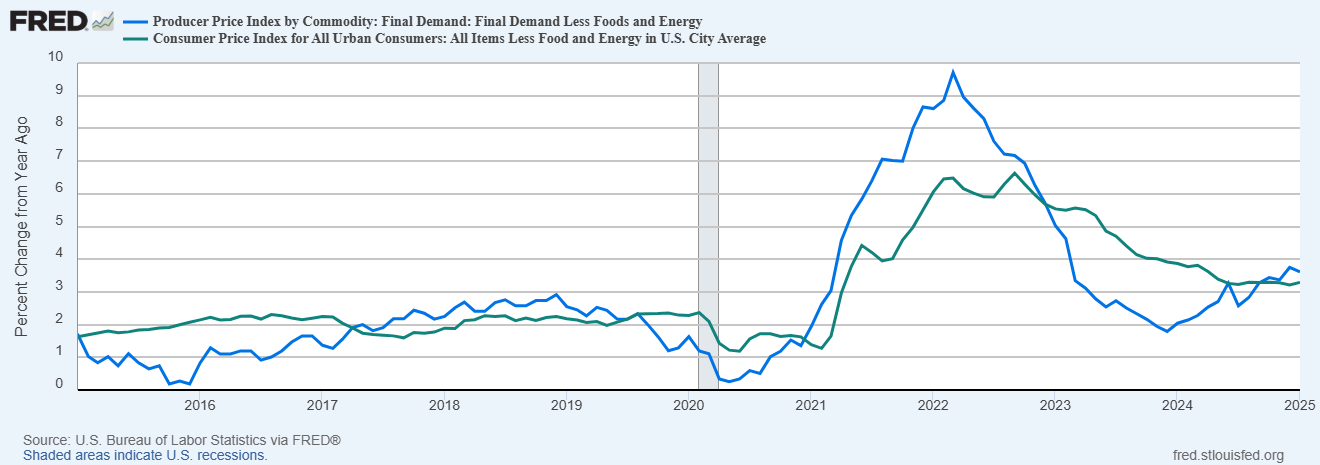
Both the Consumer Price Index (CPI) and Producer Price Index (PPI) came in higher than expected for the month of January, continuing the trend of reaccelerating price trends.
The chart below shows the yearly change in the core figure that strips out food and energy prices for both the CPI (green line) and PPI (blue line). You can see that core PPI bottomed and turned higher in December 2023, while the disinflation trend in CPI stalled out this past summer.
Comments from the Federal Reserve at their last couple meetings sought to temper expectations of further rate cuts. That’s because of stubbornly high inflation levels along with evidence that the labor market remains strong.
Last week’s inflation reports are leading market-implied probabilities for further rate cuts to pull back even more. Odds now point to just one 0.25% rate cut for all of 2025, and isn’t expected until later in the year.
While the knee-jerk reaction to accelerating inflation was a drop in the stock market, the S&P 500 quickly recouped the losses and finished the week with a 1.5% gain that put the Index near the all-time highs.
Bullish seasonality and bearish investor sentiment were tailwinds heading into last week, but the near-term outlook is now facing challenges. At the same time, higher inflation and the evolving rate outlook could ignite other corners of the capital markets.
Today, let’s unpack several key charts I’m watching for the economy and capital markets, and how it’s impacting the outlook along with trading opportunities in the making.
After that, you can find a bonus trade idea on a chart setup that I’m monitoring along with key events for the week ahead.
The Chart Report
Following a post-CPI dip, the S&P 500 finished last week with an 1.5% gain. That reflected historical tendencies, with last week being bullish for the S&P 500 looking back. But after coming off one of the best weekly periods, calendar seasonality becomes much more difficult over the next couple weeks. February is one of the worst months for the S&P, and has averaged a slight loss since 1928. But it’s a tale of two halves. The first half tends to see a gain while the final two weeks of the month are the worst two week stretch of the entire year for returns as you can see in the chart below.

Similar to the S&P 500, volatility displays seasonal patterns as well. The CBOE Volatility Index (VIX) tracks implied volatility for the S&P 500. The chart below shows the average movement in the VIX over the past 20 years. Moving in line with historical tendencies, VIX jumped into the end of January as DeepSeek and tariff headlines rattled investors. But VIX levels dropped during the first half of February as calm returned to the market and the S&P 500 rallied back toward the prior highs. But as you can see below, VIX levels tend to surge over the next month into mid-March. Since VIX and return dispersion expands when the S&P 500 is pulling back, that reflects the poor period of return seasonality ahead.

Although the calendar becomes much more challenging for the S&P 500 over the next several weeks, investor sentiment could become a tailwind that helps support stock prices. Despite trading back near the all-time highs, retail investor sentiment as measured by the AAII is turning extremely bearish. In the most recent update, bearish views jumped to over 47% and the spread between bears and bulls reached historically wide levels. The 18.9% gap between bulls and bears ranks in the bottom decile of past observations, which has seen the S&P 500 return 7.9% on average over the next six months with a gain 78% of the time (table below).

While investor views around the stock market outlook are growing bearish, fund flows are painting a much different picture. The chart below shows the 12-month rolling sum of fund flows into different equity classes. The dark blue line shows flows into the U.S., which have surged over the past year to the highest level on record. Although bearish views are gaining recently, investors are voting in a much different manner with their own funds.

The stock market reaction to hotter inflation reports and the evolving interest rate outlook was in focus. But it was a key chart breakdown elsewhere that could be felt throughout various markets. Following the election, the U.S. Dollar Index (DXY) surged to the highest level in over two years and peaked at 110 in mid-January. After negative momentum divergences in the relative strength index, DXY pulled back to the 50-day moving average (MA - black line). A sharp drop in DXY last week took out the 50-day MA and price support at the 107 level. A weaker dollar tends to be a tailwind for commodities that are priced and traded in U.S. dollars because it increases the purchasing power of non-U.S. buyers. A weaker dollar also boosts foreign sales and earnings for domestic companies.

A dollar breakdown could become an important catalyst to drive a breakout in commodity prices. The chart below shows the weekly chart of the iShares S&P GSCI Commodity-Indexed Trust ETF (GSG) going back five years. GSG has traded in a range since 2022, which consolidated the prior uptrend and has mostly coincided with the disinflation trend. GSG is back near the high end of the range, and could be on the verge of a major breakout as numerous catalysts align. Commodities are historically a top performing asset class during periods of high and rising inflation, and also benefit from a weaker dollar as noted above.

Commodities and other real assets could become an important component of investor asset allocation. That’s because the traditional retirement portfolio consisting of 60% stocks and 40% bonds tends to struggle during periods of high and rising inflation. The dark blue line in the chart below shows the ratio of real assets against the 60/40 portfolio, while the light blue line shows 10-year inflation. You can see the positive correlation between rising inflation levels and the relative performance of real assets including commodities, gold, and infrastructure.

Heard in the Hub
The Traders Hub features live trade alerts, market update videos, and other educational content for members.
Here’s a quick recap of recent alerts, market updates, and educational posts:
My favorite trade idea for 2025 is close to breaking out.
DeepSeek isn’t derailing the trade setup in this chip stock.
A new high growth addition to the Stock Trading Portfolio.
A little-known indicator pointing to higher economic activity.
You can follow everything we’re trading and tracking by becoming a member of the Traders Hub.
By becoming a member, you will unlock all market updates and trade alerts reserved exclusively for members.
👉You can click here to join now (along with a special offer)!
Trade Idea
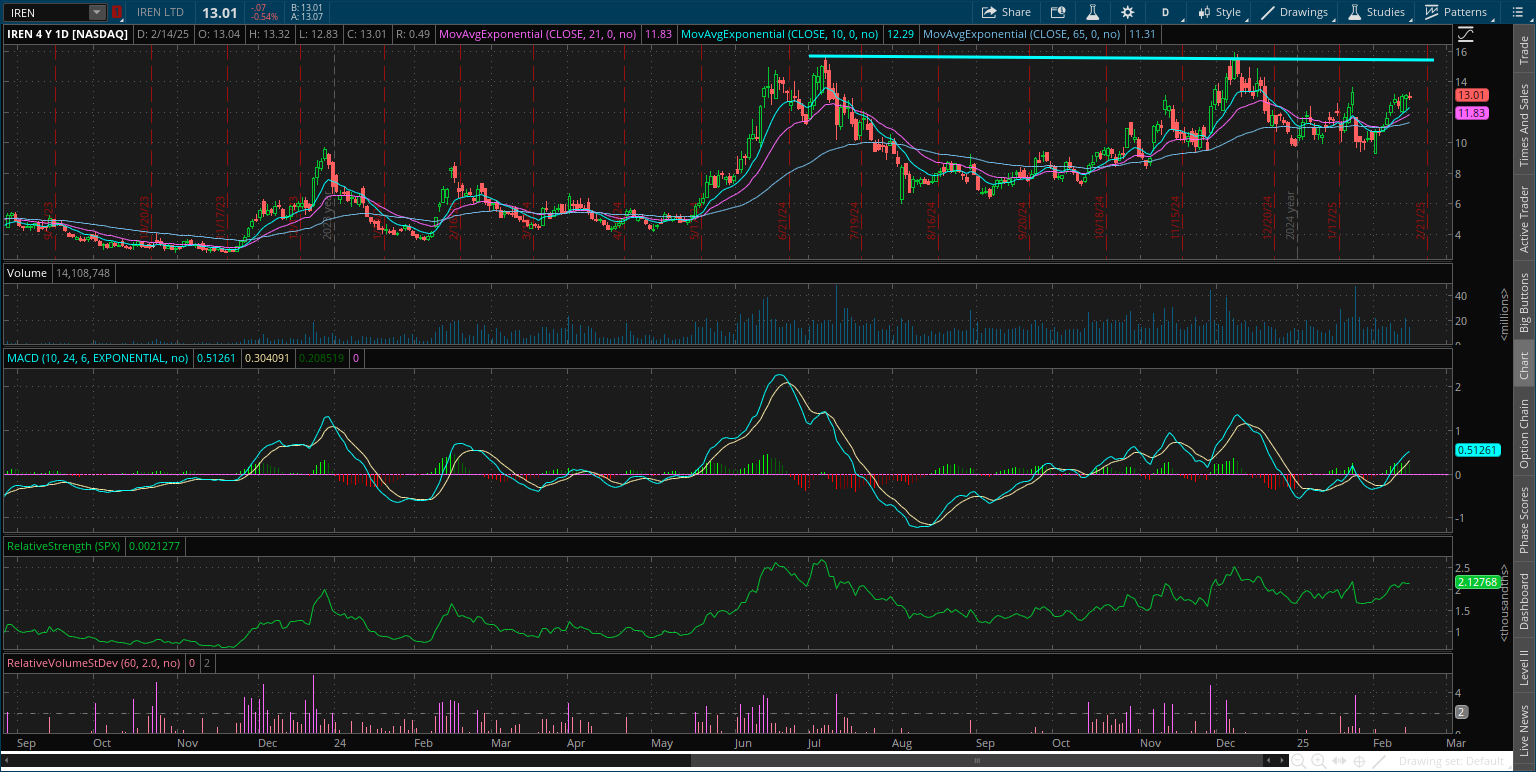
IREN Ltd (IREN)
The data center stock tested the $16 area back in July then pulled back. IREN is now rallying after a smaller pullback off the $16 level at the start of December. Ideally we see one more pullback of smaller magnitude that resets the MACD above zero. Watching for a breakout over $16.
Key Upcoming Data
Economic Reports

Earnings Releases

I hope you’ve enjoyed The Market Mosaic, and please share this report with your family, friends, coworkers…or anyone that would benefit from an objective look at the stock market.
Become a member of the Traders Hub to unlock access to:
✅Model Portfolio
✅Members Only Chat
✅Trade Ideas & Live Alerts
✅Mosaic Vision Market Updates + More
Our model portfolio is built using a “core and explore” approach, including a Stock Trading Portfolio and ETF Investment Portfolio.
Come join us over at the Hub as we seek to capitalize on stocks and ETFs that are breaking out!
And if you have any questions or feedback, feel free to shoot me an email at mosaicassetco@gmail.com
Disclaimer: these are not recommendations and just my thoughts and opinions…do your own due diligence! I may hold a position in the securities mentioned in this report.