
The Market Mosaic 2.15.26
S&P 500 Volatility Soars Amid Sector Rotation.

👋Welcome back to The Market Mosaic, where I gauge the stock market’s next move by looking at macro, technicals, and market internals. I’ll also highlight trade ideas using this analysis.
If you find this report helpful please hit that “like” button, share this post, and become a subscriber if you haven’t already done so!
🚨And be sure to check out Mosaic Traders Hub. It’s a members-only platform to alert trade ideas, track a model portfolio of open positions, and further analyze the message coming from the capital markets.
Now for this week’s issue…
The S&P 500 experienced its fourth decline over the past five weeks as a sell off in artificial intelligence (AI) and growth stocks continued weighing on the broader indexes.
That’s driving a jump in fear across the stock market, with a measure of bearishness among retail investors hitting the highest level in three months along with a spike in put option activity.
While headlines blame fears over AI’s disruptive potential on various industries, I believe the real driver stems from valuations and the shifting outlook for interest rates.
Concerns over AI’s impact on the labor market may be running high, but the January payrolls report came in well ahead of expectations. There were 130,000 jobs added during the month, which easily outpaced expectations for 55,000. The unemployment rate also dipped slightly to 4.3%
The report is clouding the outlook for further rate cuts by the Federal Reserve, with market-implied odds pointing to two quarter-point rate cuts later this year. However, the 2-year Treasury yield that leads changes in the fed funds rate is near the low end of the current fed funds range and suggests no cuts at all.
With AI and growth stock valuations running well above historical averages, the shifting rate outlook is making their share prices susceptible to a less accommodative stance on monetary policy.
And while a cooler than expected Consumer Price Index (CPI) offered some relief against stronger economic data, the details of the report points to inflation pressures building in key categories.
This week, let’s examine the historic levels of volatility unfolding underneath the stock market’s hood and rising levels of bearish sentiment. We’ll also look at rising economic growth forecasts and how that’s boosting corporate sales and earnings. Finally, lets unpack January’s CPI report and why inflation pressures remain.
The Chart Report
The January payrolls report is just the latest evidence that the economy is performing better than expected. Given jobs data is a lagging indicator, it could be that labor market statistics are catching up to acceleration in other indicators following the growth scare during the initial rounds of last year’s trade war. Since then, there has been a steady improvement in real GDP growth estimates as you can see in the chart below. The estimate for 2026 stands at a new high and is well above levels heading into the trade war, and it’s also worth noting that actual growth figures are surprising to the upside.

A recovery in economic forecasts is supporting accelerating growth in corporate sales and earnings. Median earnings growth for stocks in the Russell 3000 (a broad market index covering large-, mid-, and small-caps) has been accelerating since the start of 2025 and hit double-digits just above 10% during the fourth quarter. Quarterly revenue has been rising as well. The chart below shows quarterly revenue growth for companies in the S&P 500, which hit 9.0% year-over-year during the fourth quarter. That’s the strongest growth rate seen in over three years.

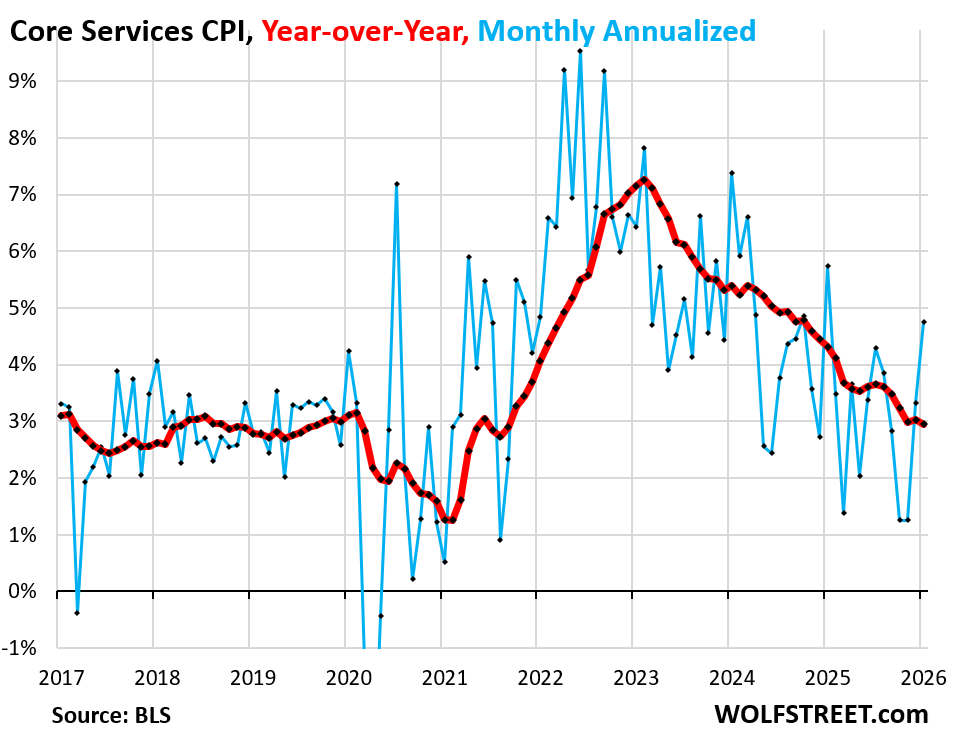
An updated report on consumer inflation looked favorable on the surface, but key underlying components show inflationary pressures continue building. The Consumer Price Index (CPI) came in at 2.4% year-over-year for January, which was below expectations and was the smallest increase since last May. But measures of core inflation continue running at elevated levels. The chart below shows core services CPI, which includes things like housing costs, health insurance, and auto insurance. Core services rose by .4% on a monthly basis or by 4.8% annualized which is the biggest increase in a year. Core services excluding housing (i.e. supercore inflation) jumped by .6% on a monthly basis or 7.3% annualized.
While the S&P 500 is only 2% below the record high near 7,000, there has been a jump in bearish sentiment as mega-cap growth stocks come under pressure. Many key stocks leveraged to the AI trade like Microsoft (MSFT) and Palantir (PLTR) have seen their stocks peak months ago and experience sharp declines. That’s sending both survey- and positioning-based measures of investor fear higher. The AAII survey of retail investors saw bearish outlooks jump to 38.1% last week which is well above the historical average and the largest share of bearish views since November. There’s also been a spike in put option volumes relative to calls, with the put/call ratio rising to its highest level in several months (chart below).

It may appear relatively calm on the surface of the stock market, but there has been a jump in volatility across the average stock. A massive rotation in leadership is unfolding since the start of the year, with growth and AI stocks broadly struggling while value and cyclical sectors outperform. The chart below shows the return dispersion in the S&P 500 over the past month. While the S&P 500 was flat on the month, the average stock moved by nearly 11%. That level of return dispersion in the average stock relative to the major indexes is typically seen during times of crisis and bear markets.

Heard in the Hub
The Traders Hub features live trade alerts, market update videos, and other educational content for members.
Here’s a quick recap of recent alerts, market updates, and educational posts:
Unpacking the crash in momentum stocks.
Why earnings growth is key to the S&P 500.
Key sectors signaling a positive economic outlook.
Why conditions still favor speculative growth stocks.
This chart could tip the next move in precious metals.
You can follow everything we’re trading and tracking by becoming a member of the Traders Hub.
By becoming a member, you will unlock all market updates and trade alerts reserved exclusively for members.
Trade Idea
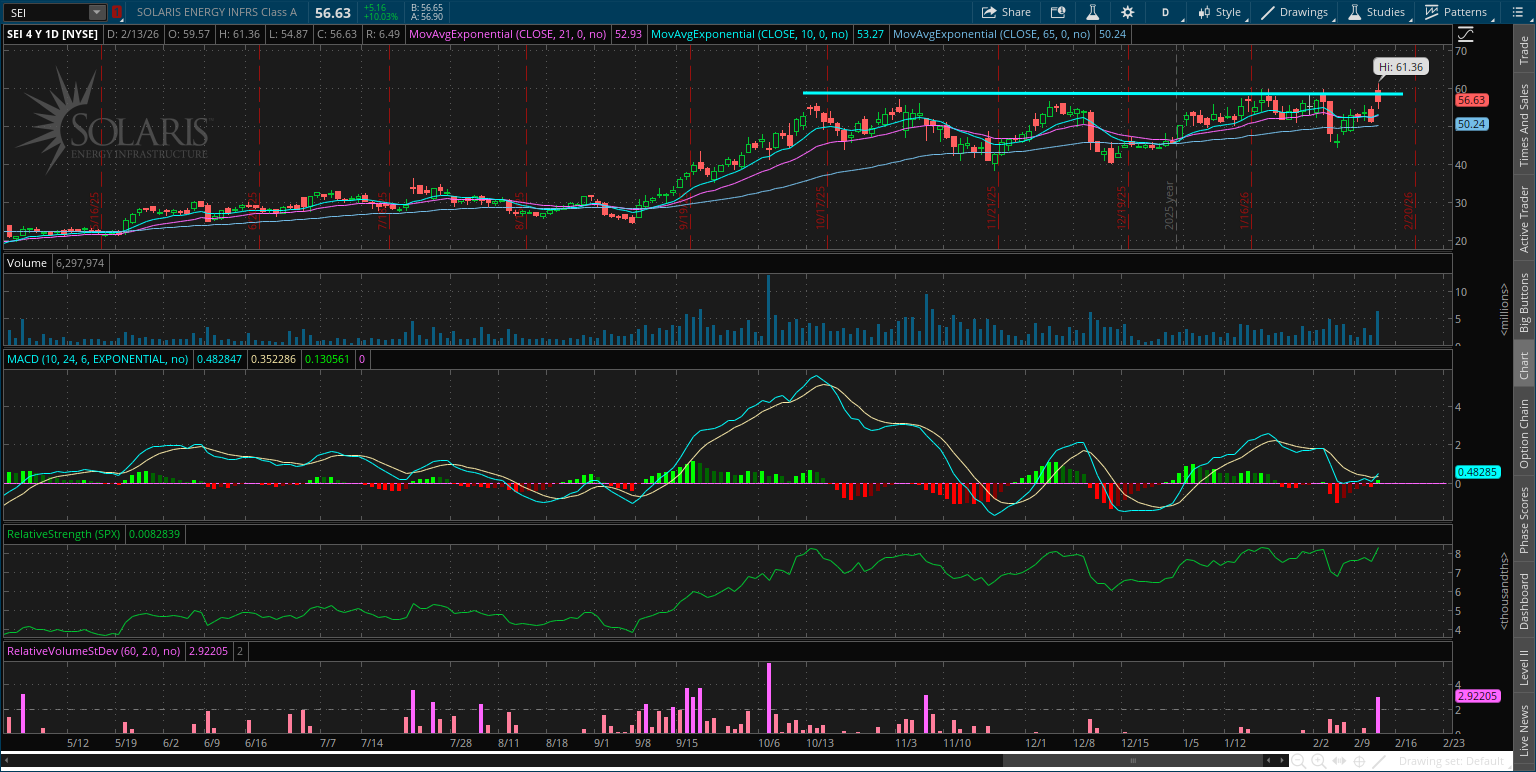
Solaris Energy Infrastructure (SEI)
Power generation stock that’s forming a new basing pattern since October. SEI is making a series of higher lows since then, pointing to accumulation in the shares. I’m watching for a breakout over resistance at $60.
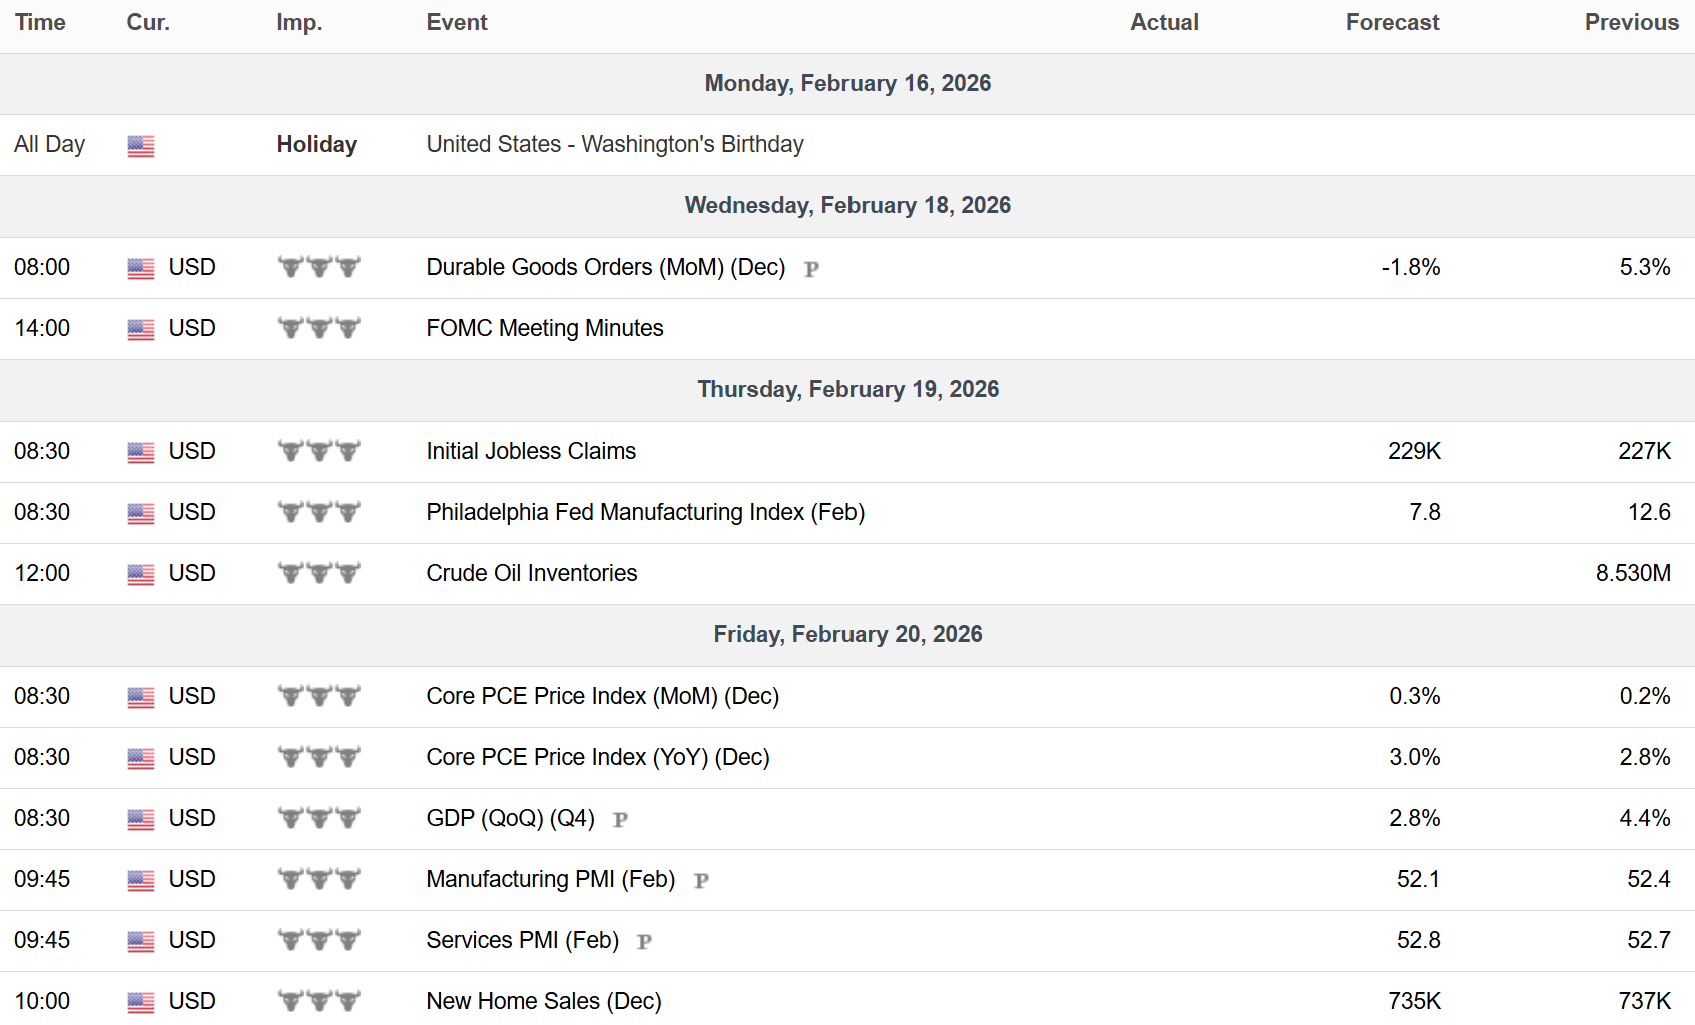
Key Upcoming Data
Economic Reports
Earnings Reports

I hope you’ve enjoyed The Market Mosaic, and please share this report with your family, friends, coworkers…or anyone that would benefit from an objective look at the stock market.
Become a member of the Traders Hub to unlock access to:
✅Model Portfolio
✅Members Only Chat
✅Trade Ideas & Live Alerts
✅Mosaic Vision Market Updates + More
Our model portfolio is built using a “core and explore” approach, including a Stock Trading Portfolio and ETF Investment Portfolio.
Come join us over at the Hub as we seek to capitalize on stocks and ETFs that are breaking out!
And if you have any questions or feedback, feel free to shoot me an email at mosaicassetco@gmail.com
Disclaimer: these are not recommendations and just my thoughts and opinions…do your own due diligence! I may hold a position in the securities mentioned in this report.