The Market Mosaic 2.11.24
Signs growing for a key stock market rotation.
Welcome back to The Market Mosaic, where I gauge the stock market’s next move by looking at macro, technicals, and market internals. I’ll also highlight trade ideas using this analysis.
If you find this content helpful please hit that “like” button, share this post, and become a subscriber to this always free report if you haven’t already done so!
And be sure to check out Mosaic Chart Alerts. It’s a midweek update covering chart setups among long and short trade ideas in the stock market, along with levels I’m watching.
Now for this week’s issue…
Stocks keep defying expectations…and gravity.
With the S&P 500 stringing together a series of new highs ever since breaking out in January, the moves in other individual stocks is even more impressive.
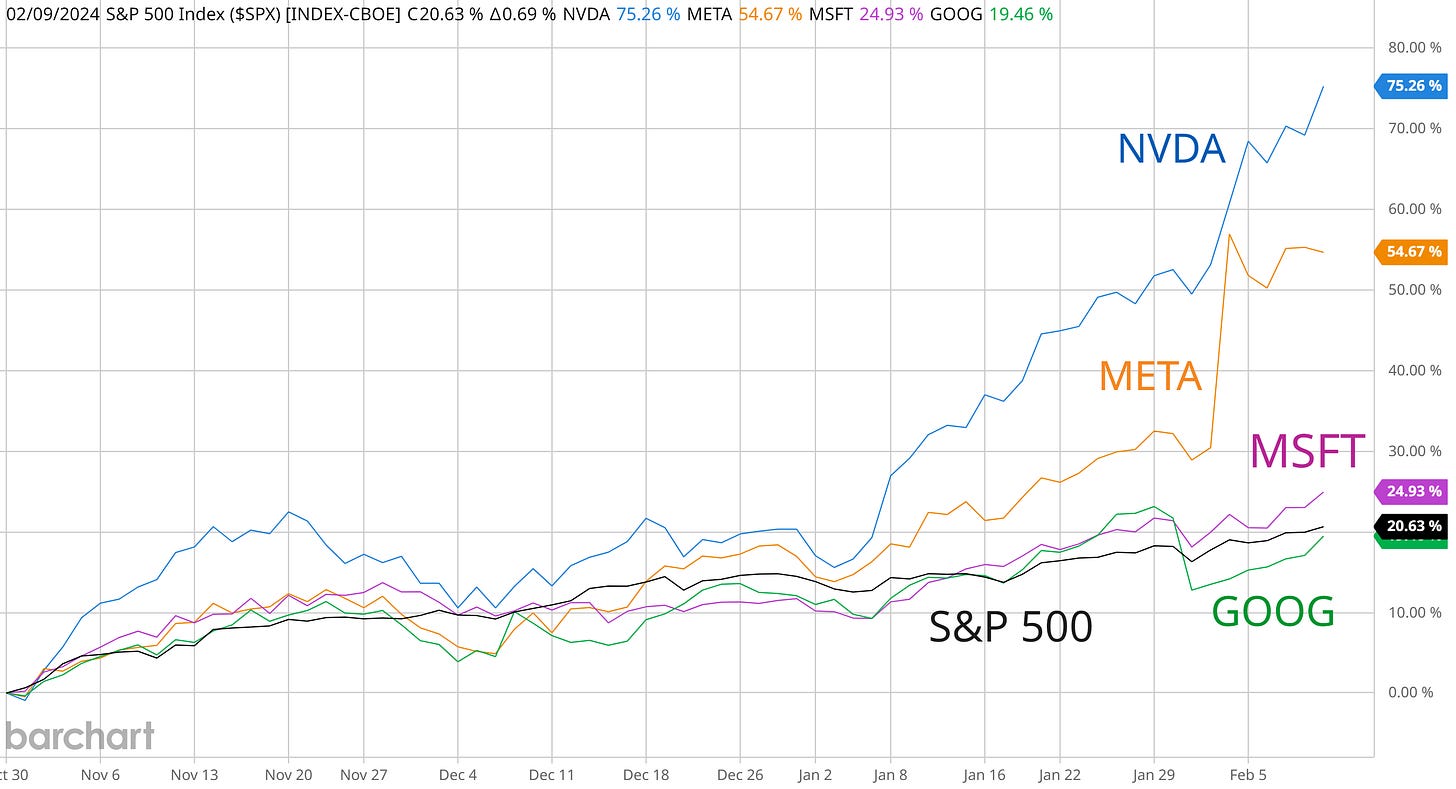
Microsoft (MSFT) recently became the second company to ever reach a $3 trillion market capitalization. Following its earnings release, Meta Platforms (META) surged over 20% and snatched the record for the largest one-day gain in market cap ever…adding $205 billion in a single day as you can see below.
Nvidia (NVDA), building the foundation of the artificial intelligence (AI) movement with their GPUs, has tacked on another 44% since breaking out over $500 (a setup highlighted in Mosaic Chart Alerts).
It’s now up 223% in just the past 12 months…an impressive feat for another company in the trillion dollar market cap club. It’s now worth more than the entire S&P 500 energy sector combined.
The chart below shows the S&P 500 and a few of the larger holdings in the index since the most recent rally that unfolded in late October.
The upside across the broader market didn’t come as a surprise. Back in September, I wrote about the message coming from the market and why new highs could be incoming.
We’re still receiving confirmation with the right sectors leading the way, like with home construction and semiconductors. And over the past week, you can add transportation stocks to that list. The IYT exchange-traded fund (ETF) that tracks transport stocks is near all-time highs after breaking out from a base going back to mid-December.
But now more signs are emerging that the trend is becoming extended, with the growing potential for mean-reverting move lower. But that doesn’t mean trading opportunities are about to disappear.
Here’s how I’m tracking the trend, and a rotation I’m monitoring in another corner of the stock market that could be setting up new breakouts outside of mega-cap stocks.
How to Track the Trend
I evaluate the potential path of forward returns by analyzing the stock market’s price trend, participation in that trend (breadth), and investor sentiment.
I write a lot about breadth and sentiment, so today I want to revisit the state of the stock market’s trend.
Back in October, I discussed the different phases of a stock’s trend with my simple philosophy: prices trend, mean-revert, and consolidate.
It’s a similar framework popularized by Stan Weinstein, and the four different stages of trend (see the chart below from his book Secrets for Profiting in Bull and Bear Markets). Stage 1 is a period of basing and accumulation, which gives way to a trending phase in Stage 2. Trend exhaustion from excessive momentum gives way to Stage 3 distribution and the top, which ultimately leads to the Stage 4 decline. And then the cycle repeats.
I also showed you how I use the weekly moving average convergence/divergence (MACD) to spot and monitor trend phases. I had this to say back then:
The MACD is simply the difference between two moving averages (black line in the charts that follow), along with a signal line (pink line in the charts). I use this in conjunction with charts of varying time fractals (i.e. daily, weekly, monthly), along with customized values.
That MACD line moves higher when the short-term moving average pulls far ahead of the long-term average, and vice versa. When that line gets too high, it’s reasonable to be on the lookout a mean-reverting move back the other way…like a rubber band that’s being stretched too far.
In that report, I showed you how the MACD was indicating that the S&P 500’s correction had run its course, and that a new trending phase could begin. That’s exactly what we’ve seen since the S&P’s most recent rally commenced on October 30th.
The chart below shows the MACD reset at zero with the arrows, showing where a new trending phase could emerge. But similar to late July, there are signs that the rally is pushing momentum too far (circled area on the MACD) and that a mean-reverting move lower is a growing possibility.
You’re seeing something similar in the mega-cap stocks driving the S&P 500 higher. The chart below looks at NVDA on a similar basis with the weekly MACD. The first arrow shows when the last uptrend exhausted, which led to a new consolidation that lasted for much of the second half of 2023. That reset the MACD at the zero line, which gave way to a new trending phase still underway. But the MACD is now hitting high levels once again (second arrow).
Extended momentum isn’t a reason by itself to sell a position, but rather is an underlying condition to monitor. Even if the S&P 500 is getting stretched, there are new or developing breakouts that could signal an important rotation is nearing.
Now What…
With the past week light on economic reports, investor attention turned to the health of the trend. Concerns over participation in the stock market’s uptrend are gaining attention, as breadth remains weaker than ideal on the rally. It is worth noting that net new 52-week highs are back in positive territory and starting to expand again.
Similar to my take on momentum above, breadth is a condition and should not be interpreted as a signal. The signal ultimately comes from price, which is why the recent action in small-caps is worth monitoring.
The Russell 2000 Index of small-caps are more representative of the average stock, which you can monitor with the IWM small-cap ETF. IWM is recently struggling at the $200-$205 area that’s held as resistance for two years. But after a retracement that has tested the 65-day exponential moving average twice and reset the MACD, price is testing that level once again.
So despite stock market breadth not being the greatest at the moment, a rotation into small-caps that drives IWM over key resistance that’s held since early 2022 could help fix that and signal a major breakout for the average stock.
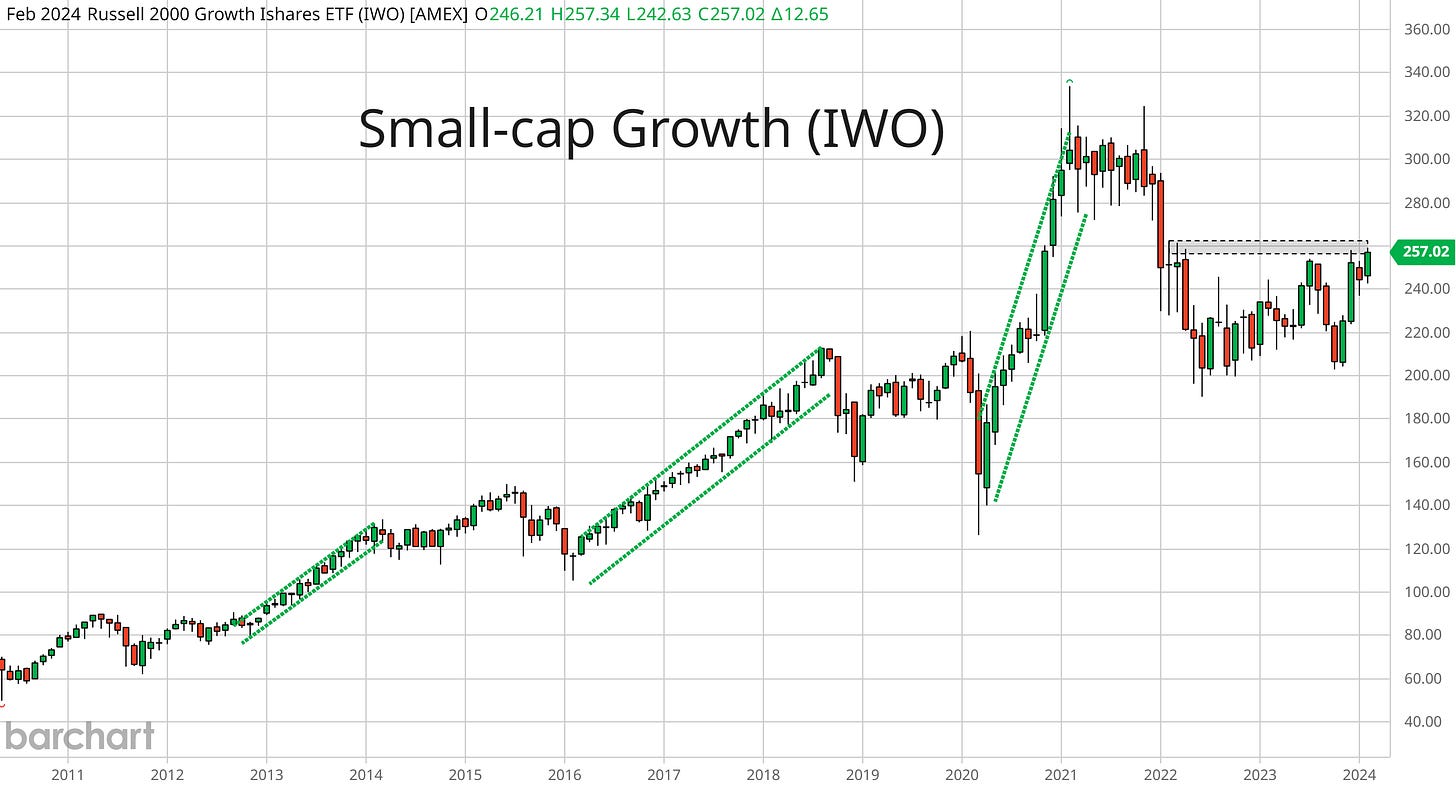
Small-cap growth stocks show something similar with the IWO ETF that tracks the Russell 2000 Growth Index. A breakout and new uptrend in small-caps would be a great risk-on signal for the broader market.
And during “easy” trading environments (if such a thing exists), small-cap growth is in a clear uptrend like you can see below. Years like 2013, 2017, and 2020 were marked by a strong rally in small-cap growth that you can see in the chart.
Recently, I’ve been reviewing several economic indicators that are seeing an improving rate of change off a low level. That suggests domestic economic activity is accelerating, which should benefit small-cap companies since nearly all their revenue exposure is in the U.S.
The chart below shows a measure of CEO confidence, which is also improving off a low level (h/t Daily Chartbook). Notice how the turn higher from a negative level has corresponded to periods of uptrends in IWO noted above.
With the action in small-caps, I’m following several chart setups that are moving out of bottoming bases, or where price is moving from Stage 1 basing to Stage 2 trending. Like what you are seeing with StoneCo (STNE). The stock is starting to emerge from a bottoming base going back two years. After trading above resistance at $15, the stock is now consolidating the gains and trading sideways since late December. That’s creating new resistance near the $19 level to monitor for a breakout.
That’s all for this week. After a light week on the economic calendar, reports will pick up this week. That includes the Consumer Price Index and Producer Price Index for January, which will put the spotlight back on the future path of interest rates. But I will be watching how extended large-cap leaders behave and if small-caps can have their own breakout moment.
I hope you’ve enjoyed The Market Mosaic, and please share this report with your family, friends, coworkers…or anyone that would benefit from an objective look at the stock market.
And make sure you never miss an edition by subscribing here:
For updated charts, market analysis, and other trade ideas, give me a follow on X: @mosaicassetco
And if you have any questions or feedback, feel free to shoot me an email at mosaicassetco@gmail.com
Disclaimer: these are not recommendations and just my thoughts and opinions…do your own due diligence! I may hold a position in the securities mentioned in this report.


MACD on the weekly chart is quite powerful, and worked quite well in 2023!
Great article and charts!