
The Market Mosaic 1.28.24
3 charts to tip the next move in stocks.

Welcome back to The Market Mosaic, where I gauge the stock market’s next move by looking at macro, technicals, and market internals. I’ll also highlight trade ideas using this analysis.
If you find this content helpful please hit that “like” button, share this post, and become a subscriber to this always free report if you haven’t already done so!
And be sure to check out Mosaic Chart Alerts. It’s a midweek update covering chart setups among long and short trade ideas in the stock market, along with levels I’m watching.
Now for this week’s issue…
The Federal Reserve, corporate earnings, the January payrolls report…the coming week will be packed with events driving market volatility.
Anticipation is building for the Fed’s rate-setting meeting this week following more evidence that inflation is trending in the right direction. Widely regarded as the Fed’s preferred inflation gauge, the personal consumption expenditures (PCE) price index was up 2.6% in December compared to last year.
That’s the first time the PCE’s yearly gain was below 3% in nearly three years, while the more recent annualized pace in the core measure is moving below the Fed’s 2% inflation target. As you can see in the chart below, the annualized core rate over the past six months has fallen to 1.9%.

Investors will be scouring the Fed’s post-meeting statement and chair Jerome Powell’s press conference for clues on timing the first rate cut. A month ago, odds for a March cut stood at 73%. Today, odds now show a 46% chance that March will see the first cut.
Meanwhile, earnings reports will keep rolling in with 106 companies in the S&P 500 scheduled to deliver results this week. That includes several “Mag 7” companies like Microsoft (MSFT), Apple (AAPL), Amazon (AMZN), and Meta (META). They are expected to be among the top contributors to Q4 earnings for the S&P as you can see below.

Then don’t forget that the January payrolls report will be coming on Friday, with current estimates pointing to 180,000 jobs created during the month while the unemployment rate ticks slightly higher to 3.8%
While the coming week will be packed with events driving market volatility, I won’t be glued to the headlines while trying to anticipate each market gyration. Instead, I’ll be reading and reacting to the price action from three key charts for hints on the next move in stocks.
3 Charts to Tip the Next Move
Following an 19% rally off the October lows, investors and traders are wondering how much further this rally in the S&P 500 can go.
The S&P recently joined the Dow in making new all-time highs. But as I’ve noted in recent issues, participation by the average stock has been lagging while bullish sentiment quickly moved back to levels indicating extreme greed.
I’m still following how breadth and sentiment are unfolding. But to know if this rally still has momentum, I’m also following the price action in three different corners of the capital markets. How these charts evolve will be revealing on whether the next move in the broader stock market will reflect a risk-on or risk-off environment.
The first up is with small-cap growth stocks, and the IWO exchange-traded fund (ETF) that tracks the Russell 2000 Small-cap Growth Index. I mentioned above how participation in the rally is becoming more uneven recently, and you can see that with small-caps.
After rocketing 27% off the October lows, small-cap growth pulled back 7% from late December through mid-January as you can see in the IWO chart below. The pullback found support near the 50-day moving average (MA - black line) while resetting the MACD at the zero line with the RSI holding above 40.

At the late December peak, price was testing the high end of a range extending back to early 2022. The past several trading sessions are also creating a near-term bull flag pattern, with resistance at the $250 level. For IWO, a break out of the flag with follow through above $260 would be a risk on sign from this speculative corner of the market. A breakdown would be a warning sign that the investor mood toward the rally is souring.
I’m also watching the setup in another speculative corner with high yield bonds. I’ve talked about high yield spreads in the past, which is the extra compensation high yield investors demand for lending to companies on shaky financial ground. That makes spreads sensitive to the broader economy, and have stayed near low levels reflecting a favorable outlook.
I also follow the ICE BofA High Yield Total Return Index which tracks the performance of high yield including price and coupon payments. The index made a new all-time high at the end of December, and has since been trading in a pattern that resembles a bullish pennant. If price can breakout from the pennant, that’s another positive development for the risk-on trade.

Finally, I’m also watching the action in the U.S. Dollar Index. The dollar has rallied after nearing support at the 100 level as you can see in the chart below. But the index is now encountering resistance near the 104 level, which is also right around the 200-day MA.
If the dollar gets pushed back lower at this level, there are big implications for stocks and other asset classes. You will notice that the recent major peak in the dollar in October 2022 coincided with the start of this bull market. The 10% correction in the S&P 500 at the end of July happened as the dollar gained, while the dollar pulled back again in late October when this most recent S&P rally started.

A weaker dollar should also boost commodities including gold, and deliver an earnings boost for companies with a large international presence. It’s worth noting that roughly 40% of the S&P 500’s revenue is from international sources, with a falling dollar benefiting foreign sales and earnings.
So instead of guessing about the next Fed meeting or payrolls report, this is why I follow the price action coming from different corners of the capital markets. A trifecta of risk-on signals can occur if small-cap growth and high yield can take out resistance levels, while the dollar resumes its decline.
Now What…
I believe the price action in the charts above will be very telling for the next short-term move in stocks. Longer-term, the ongoing earnings recovery will be key to sustaining the bull market that started back in October 2022.
With the first Fed rate cut coming sooner or later this year, it’s worth noting again that the future path of stocks will come down to whether or not a recession strikes. The table below shows the last 10 rate cutting cycles and the circumstances surrounding that cut. You can see the stark difference in forward returns when rate reductions reflect normalizing policy versus falling into a recession.

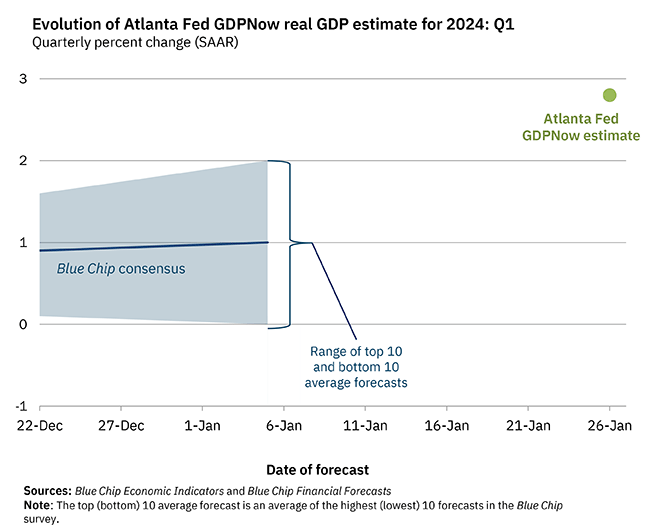
Coincident and lagging indicators show no sign of an impending recession. Initial jobless claims remain near historical lows at 214,000, and last week’s final GDP report for 2023 showed the economy growing at 3.1% last year. And the first look at 1Q GDP from the Atlanta Fed’s GDPNow estimate opened at about 3% compared to current economist estimates for 1%.
Plus last week’s flash PMI’s from S&P are turning up, with the manufacturing and services report coming in at 52.9 and 50.3 respectively. These surveys are structured so that a reading above 50 signals expansion while below 50 points to contraction. The manufacturing reading is also at a 15-month high.
And while the Conference Board’s Leading Economic Index (LEI) released last week remains in negative territory, it’s worth noting the rate of change is improving. There is also a big divergence opening up between LEI and forward earnings estimates, which historically tends to move in the same direction as you can see below.

I tend to side with forward earnings at this point, especially considering the message coming from cyclical stock market sectors. In last week’s Market Mosaic, I talked about the positive action in semiconductor and transportation stocks. I find it hard to be bearish on the economy when companies in cyclical sectors are breaking out.
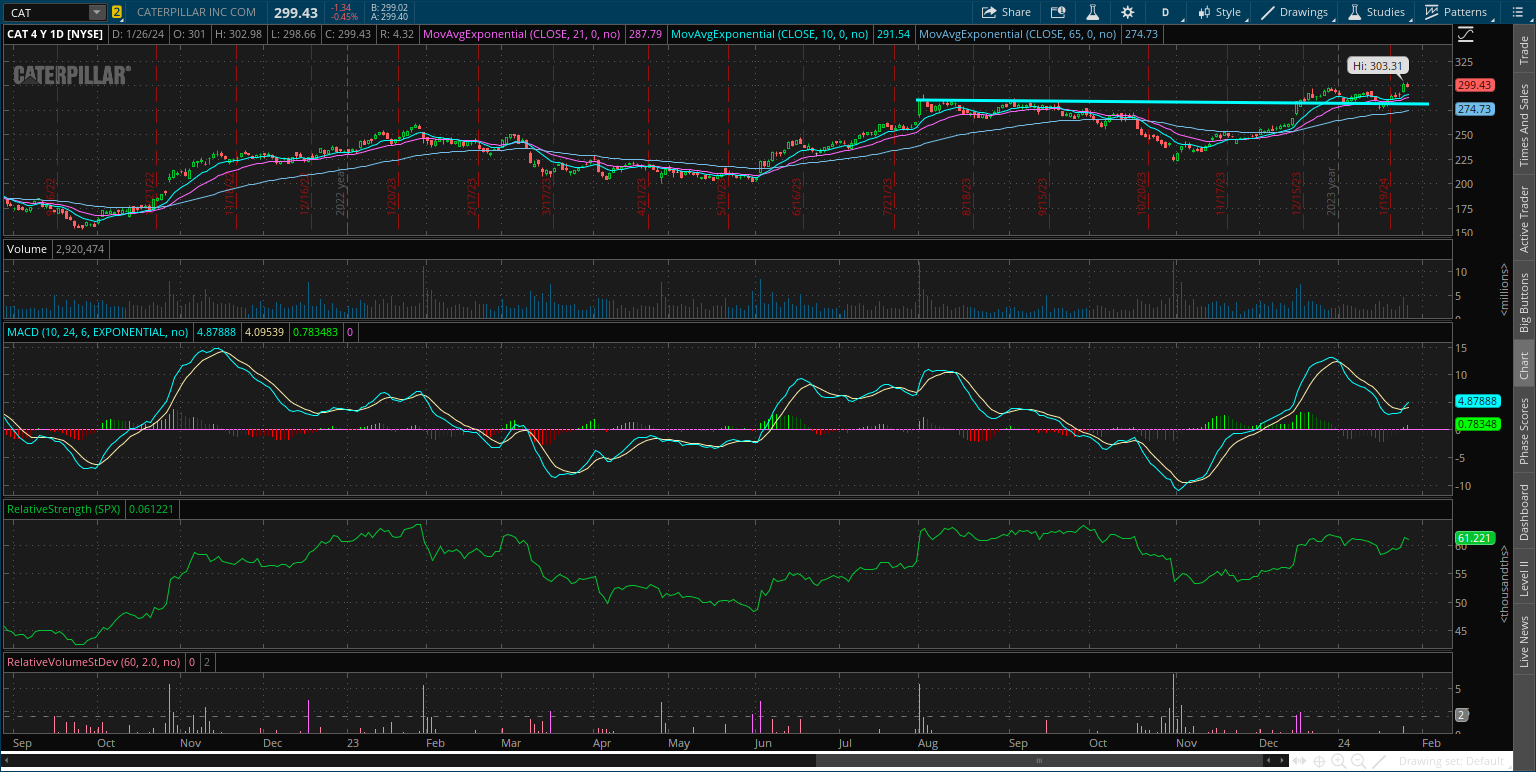
That includes Caterpillar (CAT) that I highlighted in last week’s Mosaic Chart Alerts. CAT moved out of a larger basing pattern over the $280 level, and recently back tested that area as support. The stock created a bull flag pattern while doing so, and is now trying to breakout with a move over $300.
That’s all for this week. Longer-term, I believe the economic outlook remains supportive of higher earnings which can drive the rally in stock prices. Shorter-term, I’ll be watching the price action in areas like small-caps, high-yield bonds, and the dollar for clues on the next move.
I hope you’ve enjoyed The Market Mosaic, and please share this report with your family, friends, coworkers…or anyone that would benefit from an objective look at the stock market.
And make sure you never miss an edition by subscribing here:
For updated charts, market analysis, and other trade ideas, give me a follow on X: @mosaicassetco
And if you have any questions or feedback, feel free to shoot me an email at mosaicassetco@gmail.com
Disclaimer: these are not recommendations and just my thoughts and opinions…do your own due diligence! I may hold a position in the securities mentioned in this report.
I am always excited when I see a notification that you have posted. Great read and learning so much from you Mosaic. Thank you for all the work you put into the content you provide
Great analyses looking at important macro/ capital market charts to gauge the direction and mood of the market!