
The Market Mosaic 12.7.25
Rate Cuts and Expanding Economy: Ideal Setup for the Bull Market?

👋Welcome back to The Market Mosaic, where I gauge the stock market’s next move by looking at macro, technicals, and market internals. I’ll also highlight trade ideas using this analysis.
If you find this report helpful please hit that “like” button, share this post, and become a subscriber if you haven’t already done so!
🚨And be sure to check out Mosaic Traders Hub. It’s a members-only platform to alert trade ideas, track a model portfolio of open positions, and further analyze the message coming from the capital markets (👇be sure to check out our offer to join the Hub below).
Now for this week’s issue…
Despite further evidence of a strong economy and inflation running well above the Federal Reserve’s target, market expectations for another interest rate cut are running high.
The delayed September personal consumption expenditures (PCE) price index showed a headline increase of 2.8% during September (chart below) while the core figure that strips out food and energy also increased by 2.8%.

While both gains were in line with economist expectations, the headline figure has accelerated for five months in a row and remains well above the Fed’s 2% inflation target. February 2021 is the last time PCE inflation was running below the Fed’s target.
At the same time that inflation remains well above target, there is more evidence that the labor market and economy are not deteriorating as feared. Initial jobless claims fell to a three-year low during Thanksgiving week.
S&P Global’s US Composite PMI for the month of November also came in at 54.2. While that was a slight decline from October’s level, it remains in expansionary territory above the 50 level which is consistent with growing GDP.
With inflation above target, the economy holding up fine, and the S&P 500 near all-time highs, the Fed looks set to cut rates for a third consecutive meeting. Current market-implied expectations point to an 86% chance of a 0.25% cut next week.
I can’t imagine more bullish conditions to help drive the stock market than rate cuts into loose financial conditions with the economy showing signs of continued growth which supports the earnings outlook.
This week, lets look at evidence that consumer spending fears showing up in surveys is not being reflected in the hard economic data, and how that’s fueling the outlook for earnings. We’ll also look at the positive message coming from market sectors, and what history says about another inflation wave heading into 2026.
The Chart Report
Ever since the trade war erupted during the first quarter of the year, there has been a sharp diversion between soft data like consumer and business surveys compared to hard data on how the economy is actually performing. The chart below indexes hard versus soft data surprises since the start of the year. Reports covering consumer sentiment have seen sharp deterioration compared to year-ago levels, but the negative attitudes toward the economy and outlook has not shown up in the hard data. Measures of consumer spending and retail sales have held up, which is driving estimates of third quarter GDP growth to 3.5% annualized according to the Atlanta Fed’s GDPNow model.

The most recently completed earnings season is echoing the positive trends seen in hard economic data. Across third quarter earnings, 83% of companies in the S&P 500 beat earnings estimates while 76% came ahead of revenue estimates. Beats on the top and bottom line are ahead of the five year average. Positive financial results are also being reflected in the outlook. The chart below shows the percent of S&P 500 companies raising earnings guidance, which stands at the highest level since 2021. Earnings growth for 2026 is currently projected at 14.5% while revenues are expected to increase by 7.1% for the S&P 500.

The message coming from various sectors of the capital markets is confirming the positive outlook for the economy and earnings. I’ve recently analyzed the price action and bullish setup in LME copper prices, which is a better global benchmark than U.S. prices. Copper is building on a breakout from a bullish ascending triangle pattern, with copper miners rallying as well. Other cyclical stocks and sectors are echoing the bullish outlook. That includes machinery giant Caterpillar (CAT), and now you’re seeing transportation stocks that move freight breaking out as well. The chart below shows the weekly chart of the iShares US Transportation ETF (IYT), which is breaking out to record highs last week.

With the Fed’s final rate-setting meeting of 2025 in just days, the outlook for rate cuts has become a key driver of stock prices. The pullback in the S&P 500 from late October into November happened alongside falling odds for another rate cut this month. Recent comments from key Fed officials helped drive odds for a cut back higher, which also sparked a recovery in the stock market. That recovery has been especially strong in the average stock, with mid- and small-caps experiencing a sharp rebound. The performance of small- and mid-caps are especially sensitive to the Fed’s decisions on rates. The chart below compares the forward returns of capitalization ranges when the Fed is cutting rates, with small- and mid-caps outpacing large-caps historically.

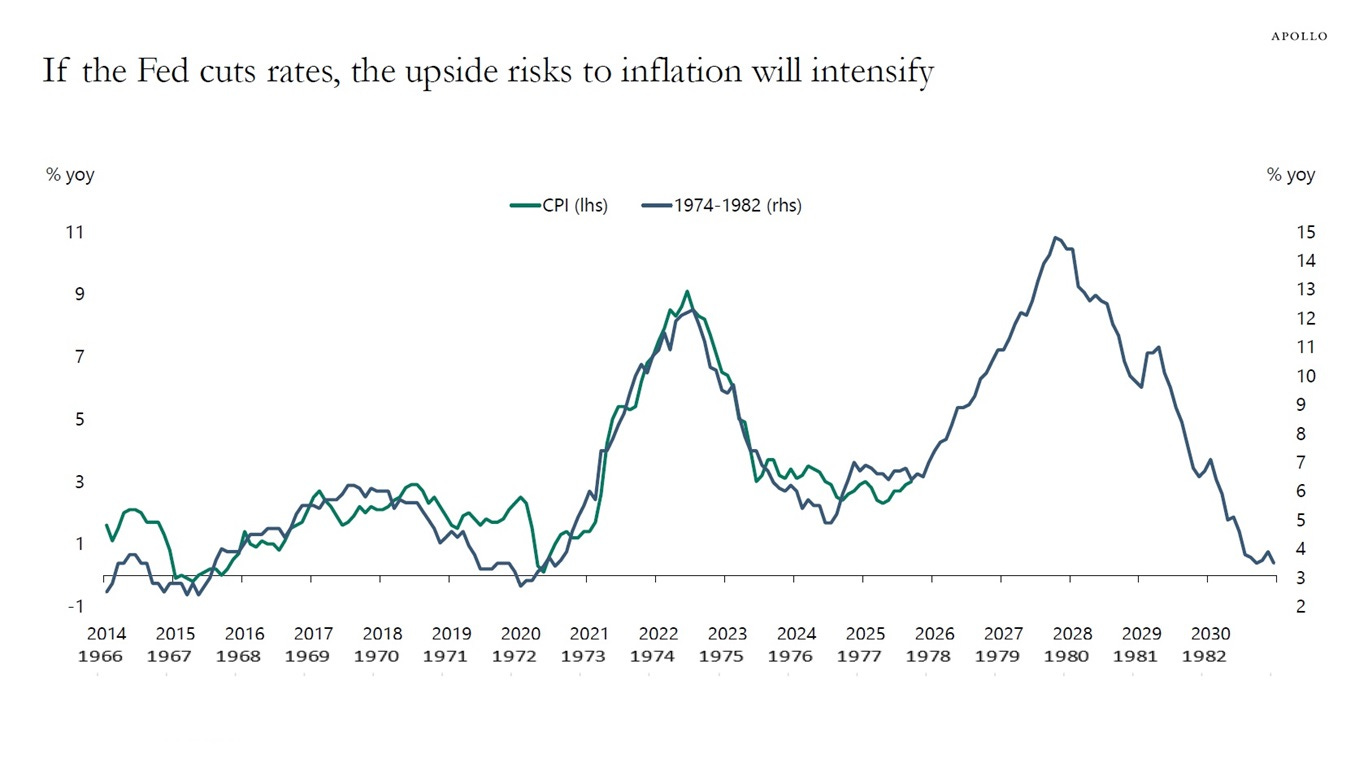
Investor hopes are running high that the Fed will deliver a third consecutive rate cut, but that risks adding further pressure on inflation at a time when the economy is also performing much better than expected. Financial conditions are already much looser than average, and sectors sensitive to high and rising inflation are moving higher including gold miners and copper prices. Various measures of headline consumer inflation are already accelerating in recent months, and could be at a major inflection point if history is a guide. The chart below overlays the consumer price index (CPI) since 2014 with the stagflation period around the 1970s. If the cycle continues tracking, there could be another inflation wave ahead in 2026.
Heard in the Hub
The Traders Hub features live trade alerts, market update videos, and other educational content for members.
Here’s a quick recap of recent alerts, market updates, and educational posts:
Detailing one of my top 2026 trade ideas.
How one chart could ignite precious metals.
Breaking down key levels to watch on Bitcoin.
What to know about S&P 500 December seasonals.
An overlooked source of economic stimulus hitting in 2026.
You can follow everything we’re trading and tracking by becoming a member of the Traders Hub.
By becoming a member, you will unlock all market updates and trade alerts reserved exclusively for members.
🚨Gold mining stocks could be setting up another round of breakouts. Hub members are currently sitting on gains of 144% and 87% on mining positions. Click the link below for a special discount to join the Hub today!
👉You can click here to join now👈
Trade Idea
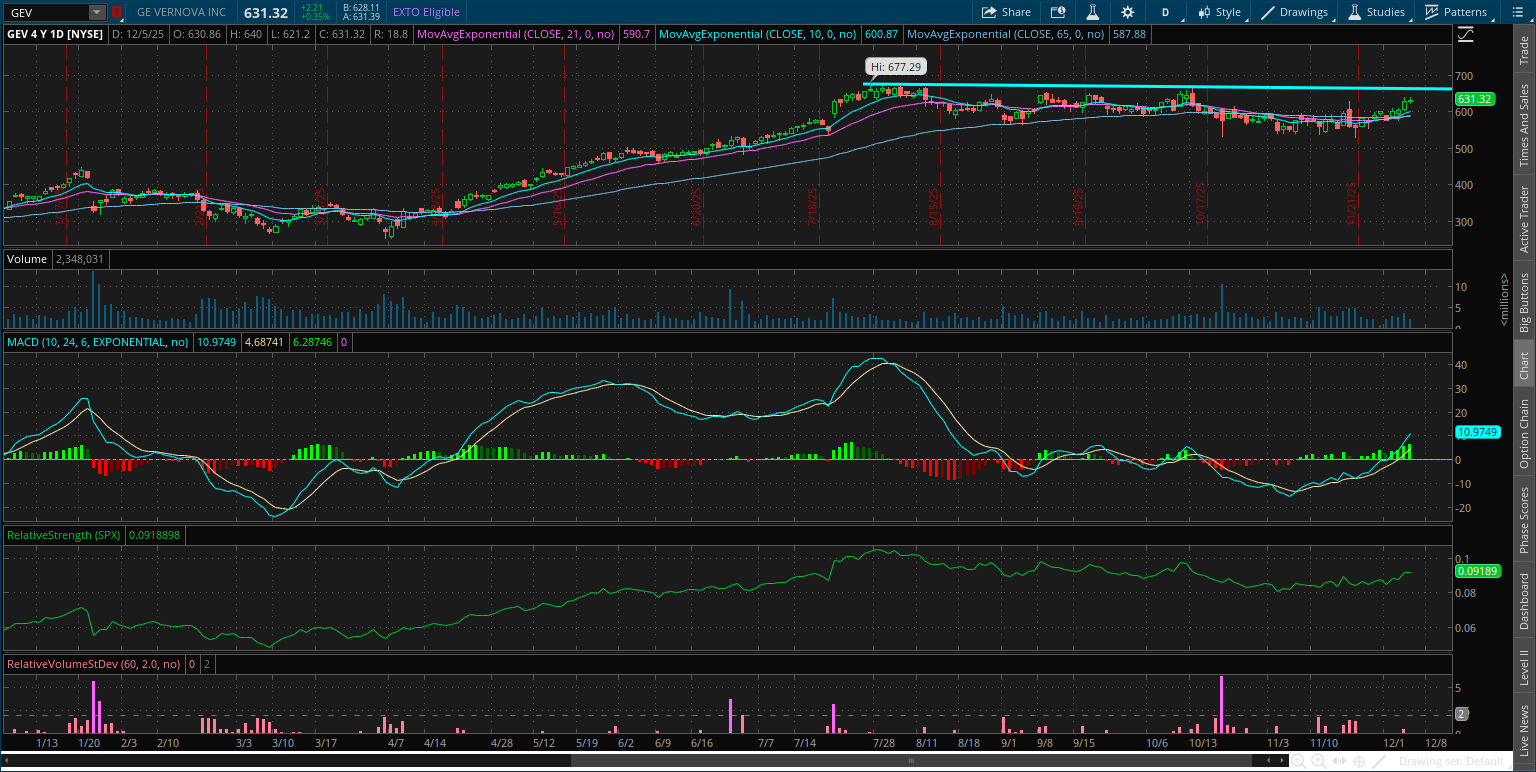
GE Vernova (GEV)
The stock rallied to the $675 level in July and now forming a new basing pattern. Trading in a relatively tight range and seeing the MACD recover back above zero. I’m watching for a move above $675 with the RS line at a new high.
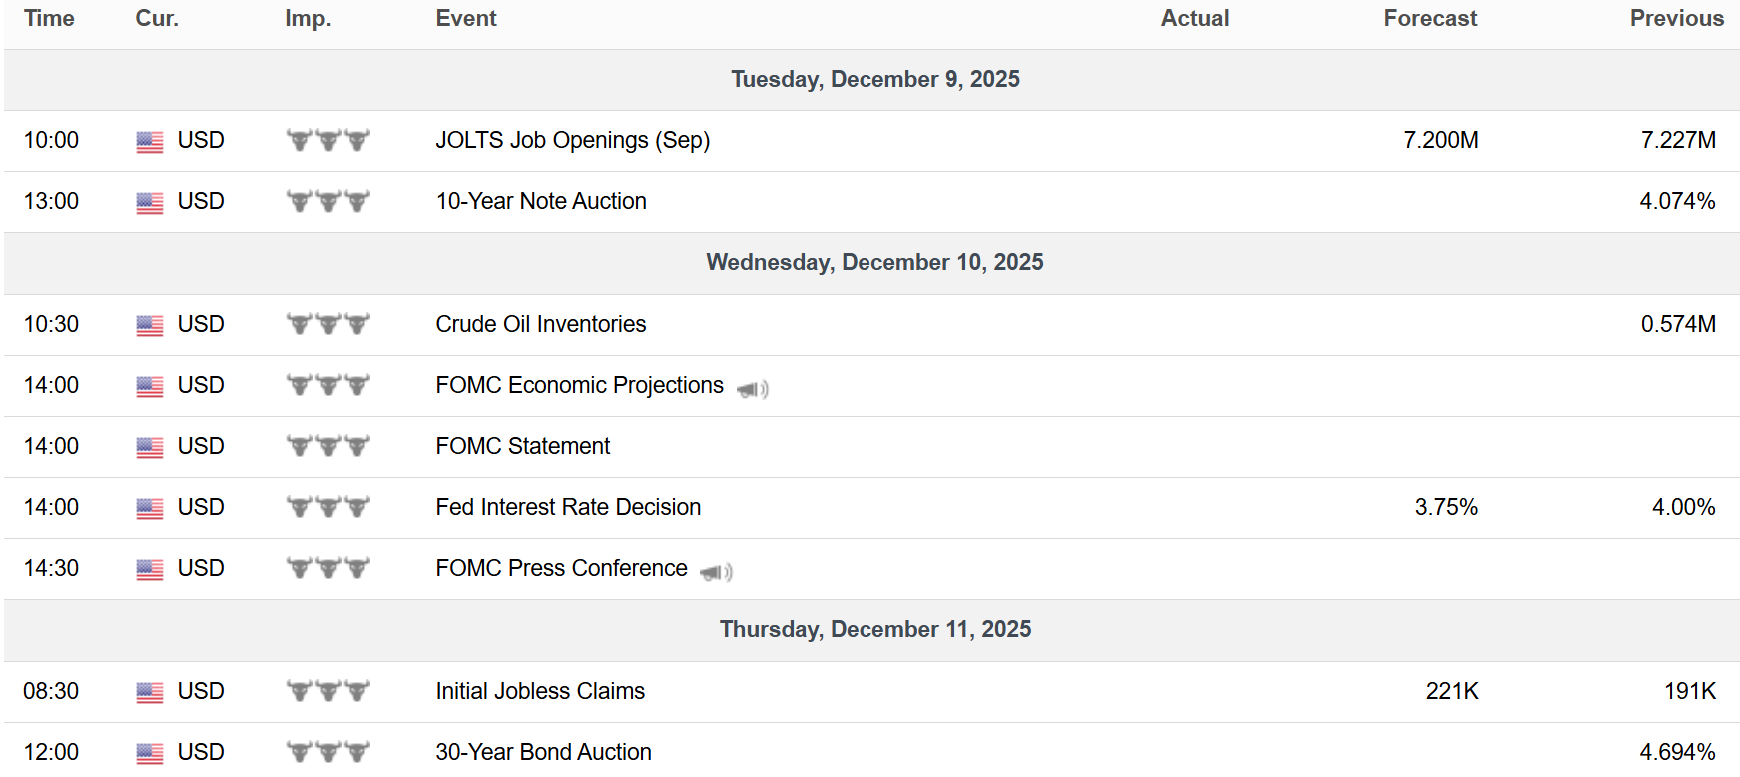
Key Upcoming Data
Economic Reports
Earnings Reports

I hope you’ve enjoyed The Market Mosaic, and please share this report with your family, friends, coworkers…or anyone that would benefit from an objective look at the stock market.
Become a member of the Traders Hub to unlock access to:
✅Model Portfolio
✅Members Only Chat
✅Trade Ideas & Live Alerts
✅Mosaic Vision Market Updates + More
Our model portfolio is built using a “core and explore” approach, including a Stock Trading Portfolio and ETF Investment Portfolio.
Come join us over at the Hub as we seek to capitalize on stocks and ETFs that are breaking out!
And if you have any questions or feedback, feel free to shoot me an email at mosaicassetco@gmail.com
Disclaimer: these are not recommendations and just my thoughts and opinions…do your own due diligence! I may hold a position in the securities mentioned in this report.