
The Market Mosaic 1.26.25
S&P 500: The Mag 7 launchpad is set.

Welcome back to The Market Mosaic, where I gauge the stock market’s next move by looking at macro, technicals, and market internals. I’ll also highlight trade ideas using this analysis.
If you find this content helpful please hit that “like” button, share this post, and become a subscriber if you haven’t already done so!
And be sure to check out Mosaic Traders Hub. It’s a members-only platform to alert trade ideas, track a model portfolio of open positions, and further analyze the message coming from the capital markets.
🚨You can start a 7-day free trial to the Hub by clicking here. By starting a trial, you will unlock all content and reports created exclusively for members.
Now for this week’s issue…
Following a dismal end to 2024, the average stock is recently leading the rest of the market higher.
By some measures, December ended up being one of the worst months on record for most stocks. For instance, at the end of December only 14.7% of S&P 500’s members were outperforming the index. That was near a record low going back a century and points to a struggling average stock.
But as 2025 got underway, positive breadth divergences and bearish investor sentiment helped turn the tide and even delivered historically positive participation. The number of consecutive sessions in which 68% or more of the S&P’s constituents are advancing hit the highest ever at six days. You can see that in the chart below.

Only one month separated record bearish versus bullish trends under the hood. But the question now is if the S&P 500 can keep building on a positive start to the year. The answer might come down to meg-cap stocks, like those in the “Magnificent 7”.
After all, their participation is needed to push the S&P 500 higher. That’s because the 10 largest stocks comprising companies like Nvidia (NVDA), Microsoft (MSFT), and Apple (AAPL) make up nearly 39% of the S&P 500 (chart below).

While the average stock has taken the leadership baton to start the year, I’m watching for signs that mega-cap stocks are about to pull back ahead. And while I don’t want to see deterioration in the average stock, I’m watching chart evidence that the Mag 7 could play a starring role in the next phase of the bull trend.
Mag 7 Launchpad is Set
The weight of the top stocks in the S&P 500 draws much consternation from investors. With such a small number of stocks capturing such a large share of the Index, that somehow means a market bubble is about to deflate.
But in my opinion, the weight is justified by their earnings and revenue contribution to the S&P 500. The Mag 7 have led the revenue and earnings recovery since this cyclical bull market began in late 2022. The chart below shows annual earnings and revenue growth for the Mag 7.

Stock prices are also forward looking, and the outlook for further sales and earnings contributions is holding up even against the lofty valuation of the Mag 7. While the average stock is expected to post accelerating growth this year, that doesn’t mean the Mag 7 is going away.
The chart below plots the 24 month forward price/earnings ratio of the Mag 7 and other sectors against their two-year expected compound revenue growth. While the Mag 7 has the highest forward multiple of any other group displayed, it also has the strongest projected growth rate.

Beyond the fundamental growth reasons of why Mag 7 shares can stay buoyant, bullish technical chart developments are taking shape for several key Mag 7 members as well. More specifically, several members of the Mag 7 are progressing through chart consolidations that could result in the next round of breakouts.
That includes Microsoft (MSFT) in the weekly chart below. MSFT last peaked in early July and hasn’t made a new high since. But that summer peak kicked off a new consolidation phase shown with the dashed trendlines.

MSFT is nearing the apex of the symmetrical triangle, while the MACD is seeing a bullish reset above the zero line. Also take a look at the chart of Nvidia (NVDA), which is the largest company in the world by market capitalization .
The weekly chart below shows a relatively tight range (shaded box) for NVDA since the start of November. The stock is also holding above the prior base breakout over the $130 level. That means the recent price action is simply back testing prior support.
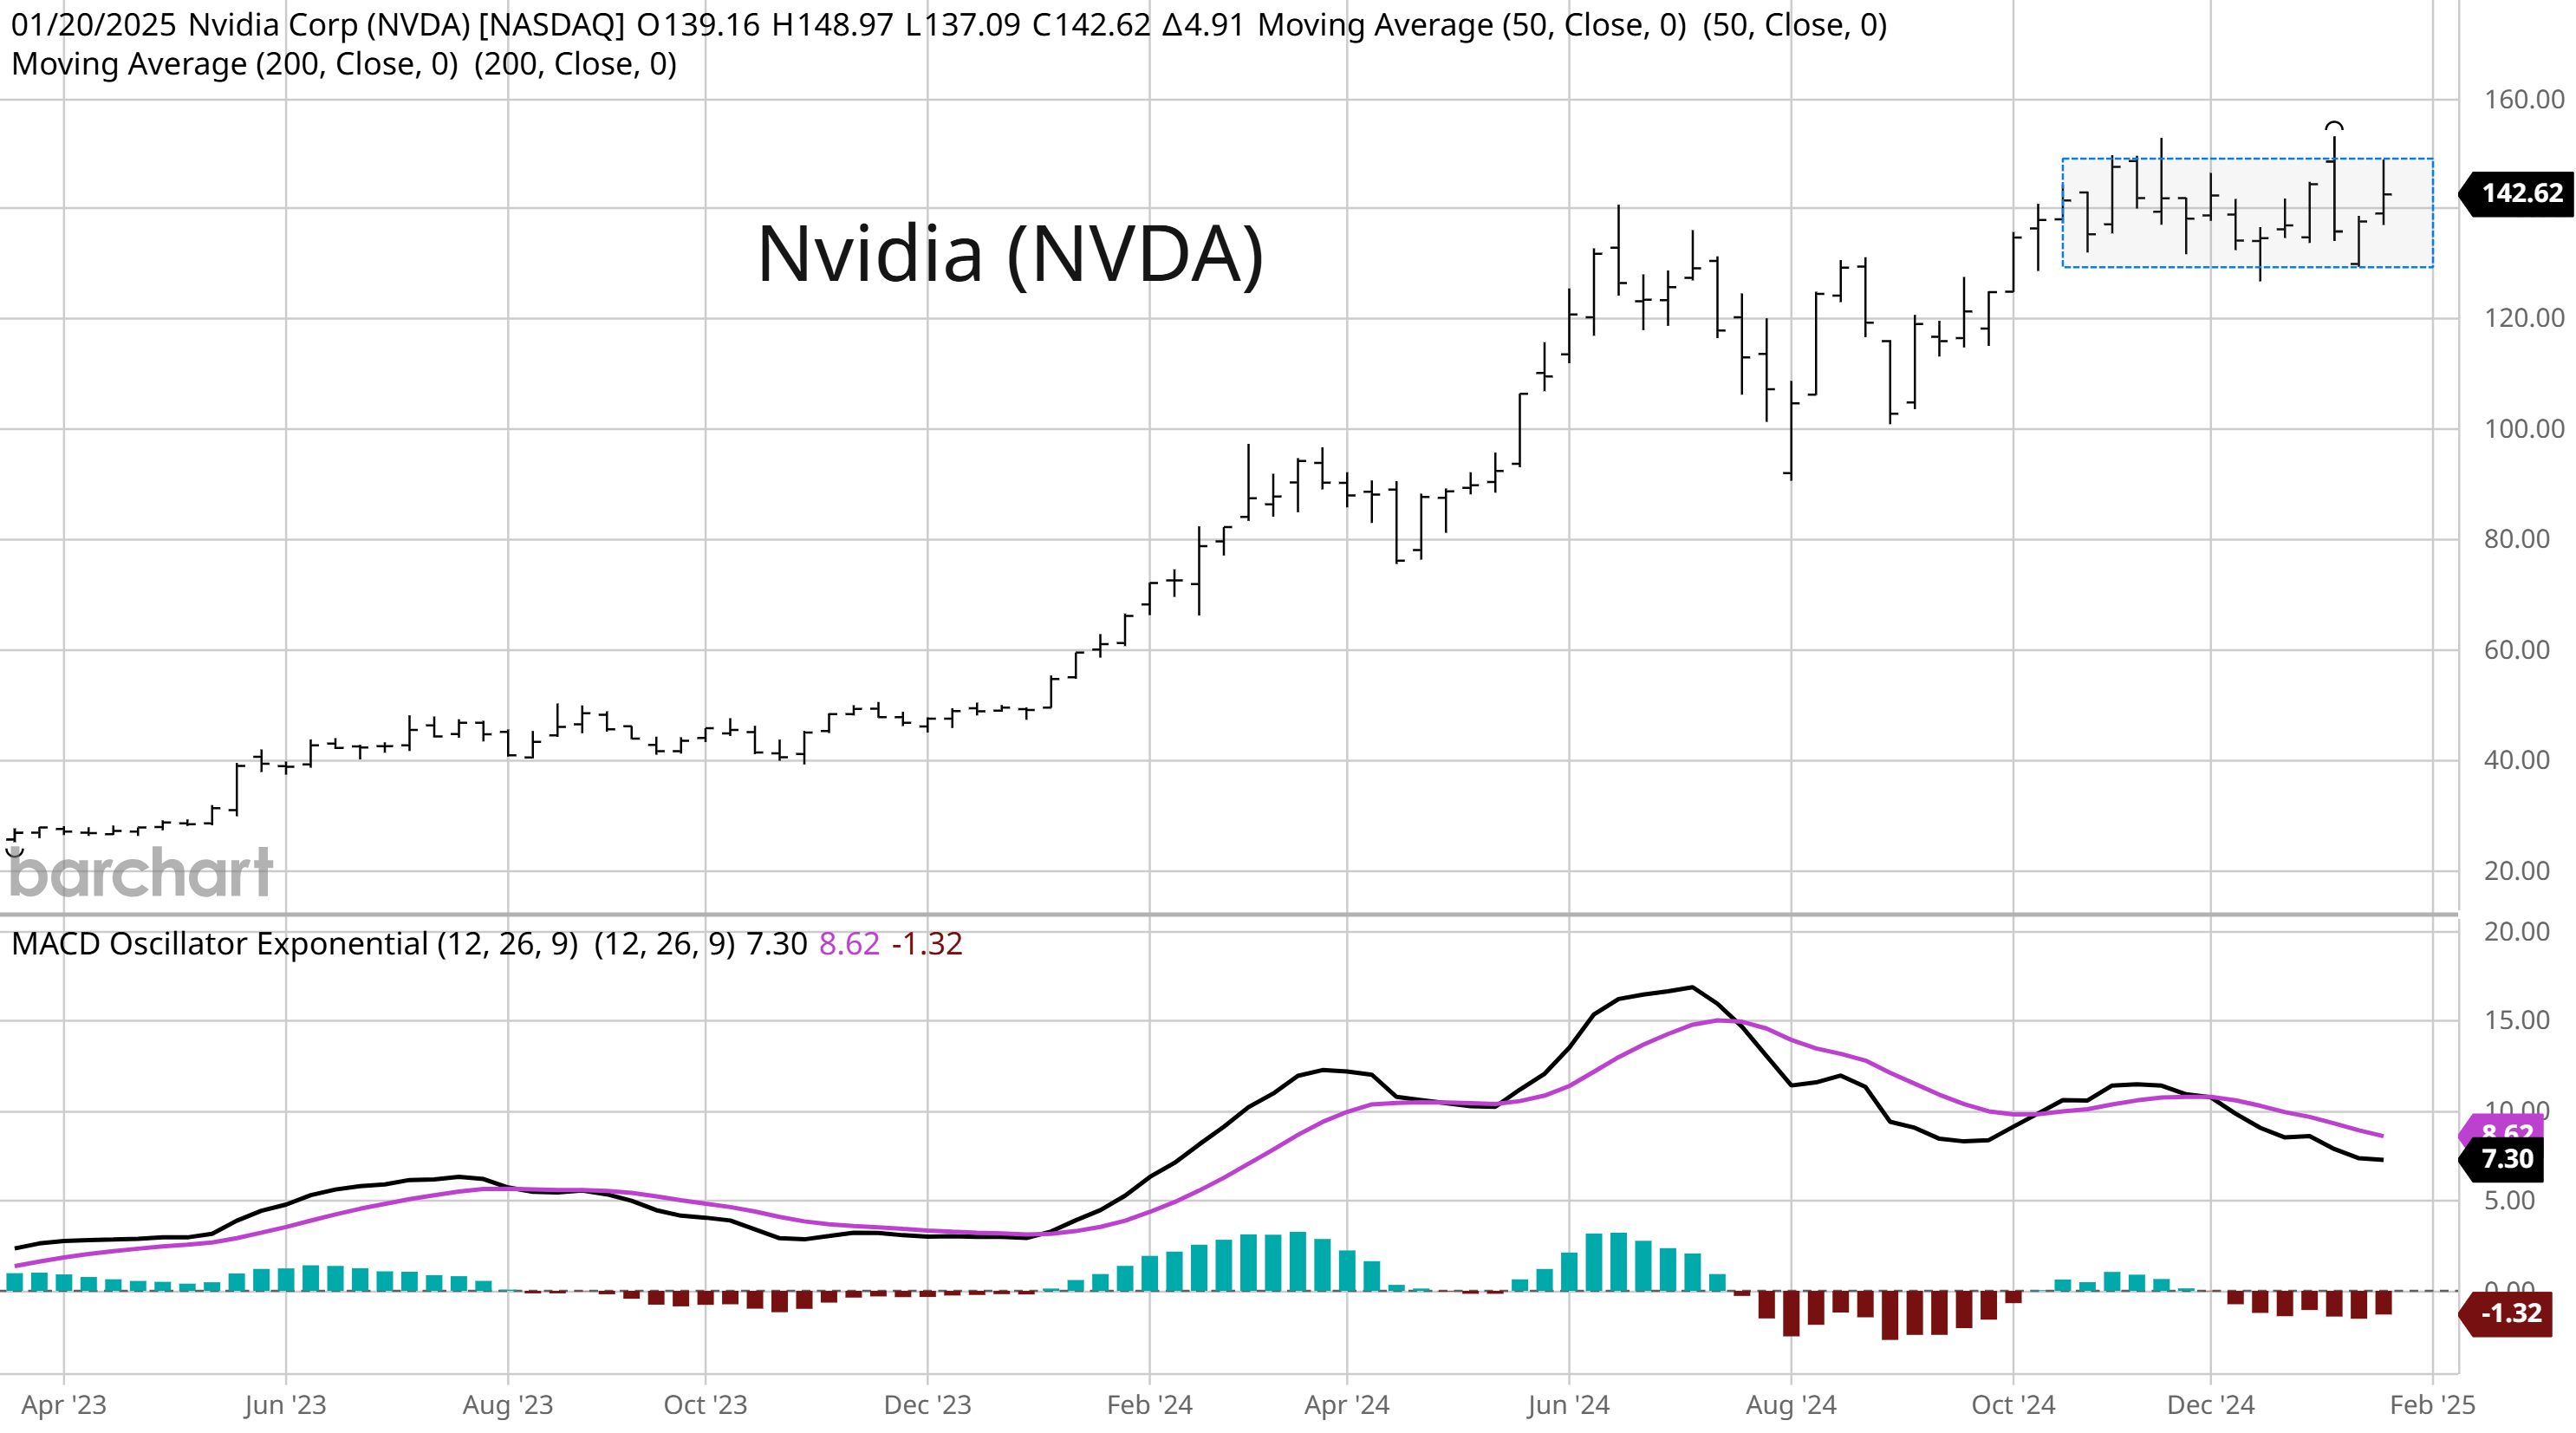
I’ve also written extensively about the favorable chart setup developing with Google-parent Alphabet (GOOG), so I’m not going to dive into that one here. And last week, Amazon (AMZN) broke out higher from a bullish flag pattern. Looking across the group, Apple (AAPL) is the only member not showing a bullish setup.
Overall, I believe the weight of the chart evidence among most Mag 7 stocks points to a consolidation phase that is running its course, which can give way to a new trending phase higher and boost the S&P 500 along the way.
Now What…
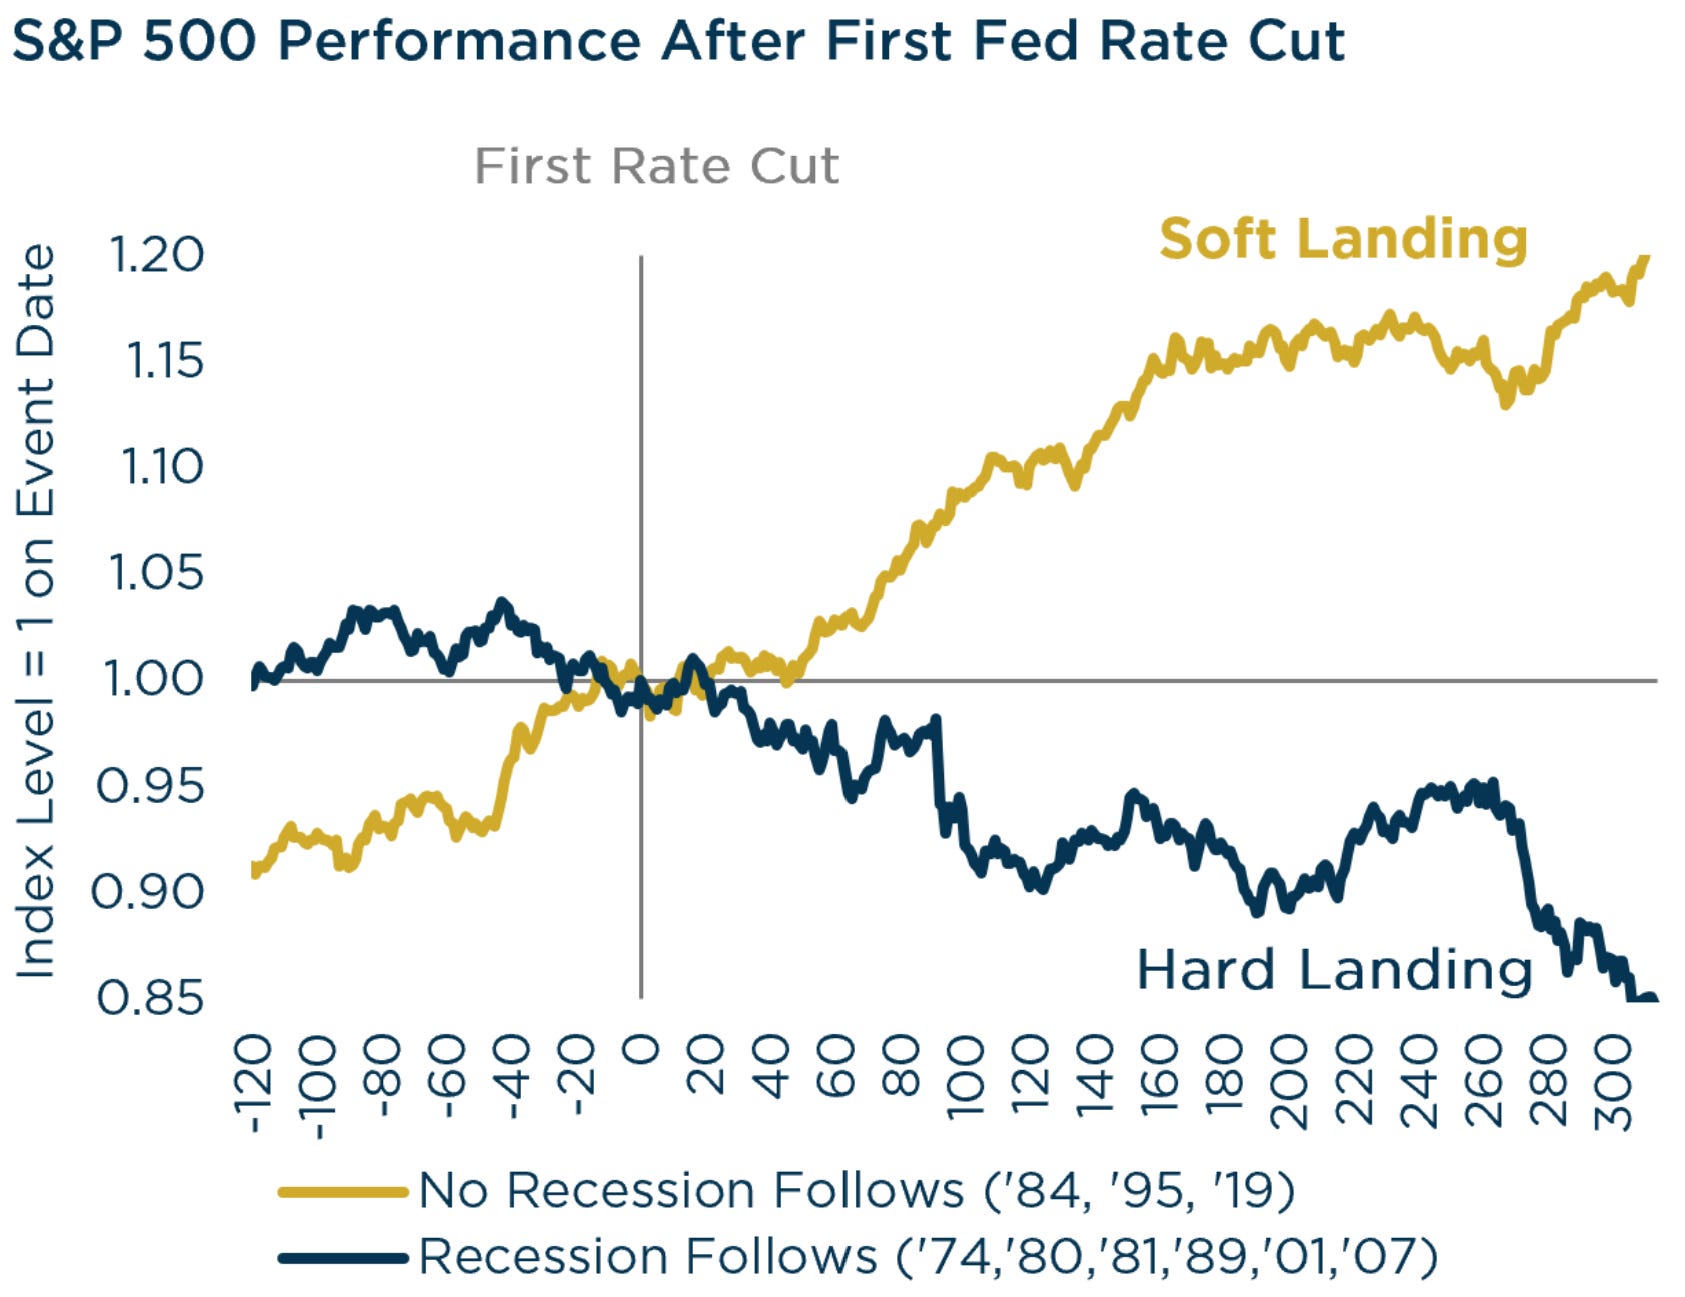
Following the Federal Reserve’s first rate cut, the S&P 500 historically takes a diverging path with the outcome dependent on recession versus expansion in the economy. The Fed has a reputation of acting too slow, only cutting interest rates when it’s too late and recession creates an earnings drawdown.
Other times, the economy keeps humming along just fine while the corporate earnings picture remains positive. With the S&P 500 up 8% since the Fed first cut rates in September, so far the S&P is following the growth path during this cutting cycle as you can see below.
I continue to believe the weight of the evidence points to a positive economic outlook for now. The Atlanta Fed’s GDPNow model points to 3% annualized growth for the economy in the fourth quarter.
The next round of economic data points I’m watching for acceleration is with purchasing managers’ indexes (PMI). These surveys serve as coincident indicators, though underlying components like new orders can be leading.
The chart below shows a regional Fed manufacturing survey overlaid with the popular manufacturing ISM. At times, the Fed survey shows a slight lead time on the ISM, and is surging higher in the most recent reading (dark blue line).

Ongoing economic growth is critical to keep the earnings picture intact. Over the long-term, stock prices ultimately follow earnings. While I laid out the bullish case for Mag 7 stocks above, it’s worth noting that the other companies in the S&P 500 are projected to see accelerating earnings growth this year.
The chart below plots the quarterly growth rate (year/year) in earnings for the Mag 7 compared to the other 493 stocks in the S&P 500. While Mag 7 earnings growth is expected to stay strong (blue bars), you can see the growth rate in the other 493 (green bars) is projected to accelerate throughout the year.

That’s all for this week. The pace of earnings reports picks up this week, with 102 of the S&P 500 scheduled to report. That includes several members of the Mag 7 as well. Investors will also have to contend with a Fed rate-setting meeting this week, where the central banks is expected to keep rates on hold. I’ll be watching how the Mag 7 stocks respond, and if bullish setups can drive new highs for the S&P 500.
I hope you’ve enjoyed The Market Mosaic, and please share this report with your family, friends, coworkers…or anyone that would benefit from an objective look at the stock market.
Become a member of the Traders Hub to unlock access to:
✅Model Portfolio
✅Members Only Chat
✅Trade Ideas & Live Alerts
✅Mosaic Vision Market Updates + More
Our model portfolio is built using a “core and explore” approach, including a Stock Trading Portfolio and ETF Investment Portfolio. Come join us over at the Hub as we seek to capitalize on stocks and ETFs that are breaking out!
And if you have any questions or feedback, feel free to shoot me an email at mosaicassetco@gmail.com
Disclaimer: these are not recommendations and just my thoughts and opinions…do your own due diligence! I may hold a position in the securities mentioned in this report.