
The Market Mosaic 1.25.26
Bullish conditions favor the rally, but inflation challenges are growing.

👋Welcome back to The Market Mosaic, where I gauge the stock market’s next move by looking at macro, technicals, and market internals. I’ll also highlight trade ideas using this analysis.
If you find this report helpful please hit that “like” button, share this post, and become a subscriber if you haven’t already done so!
🚨And be sure to check out Mosaic Traders Hub. It’s a members-only platform to alert trade ideas, track a model portfolio of open positions, and further analyze the message coming from the capital markets.
Now for this week’s issue…
I hope you are staying safe and warm as Winter Storm Fern impacts the nation. I’m traveling this week and am stranded for a few days longer than expected due to flight cancellations caused by Fern.
While I can’t bring you my usual Sunday update this week, I did want to touch base and resend my 2026 outlook that I shared at the start of January because…
So far everything is falling into place as expected.
Loose financial conditions are driving further stock market gains, just not in the places you’re used to seeing. The Magnificent 7 is taking a backseat this year as the average stock leads and boosts breadth metrics.
While laggards in the Mag 7 drag on the major indexes like the S&P 500 given their sheer weight, the difference between 52-week new highs and new lows recently hit the highest level in over a year (chart below).
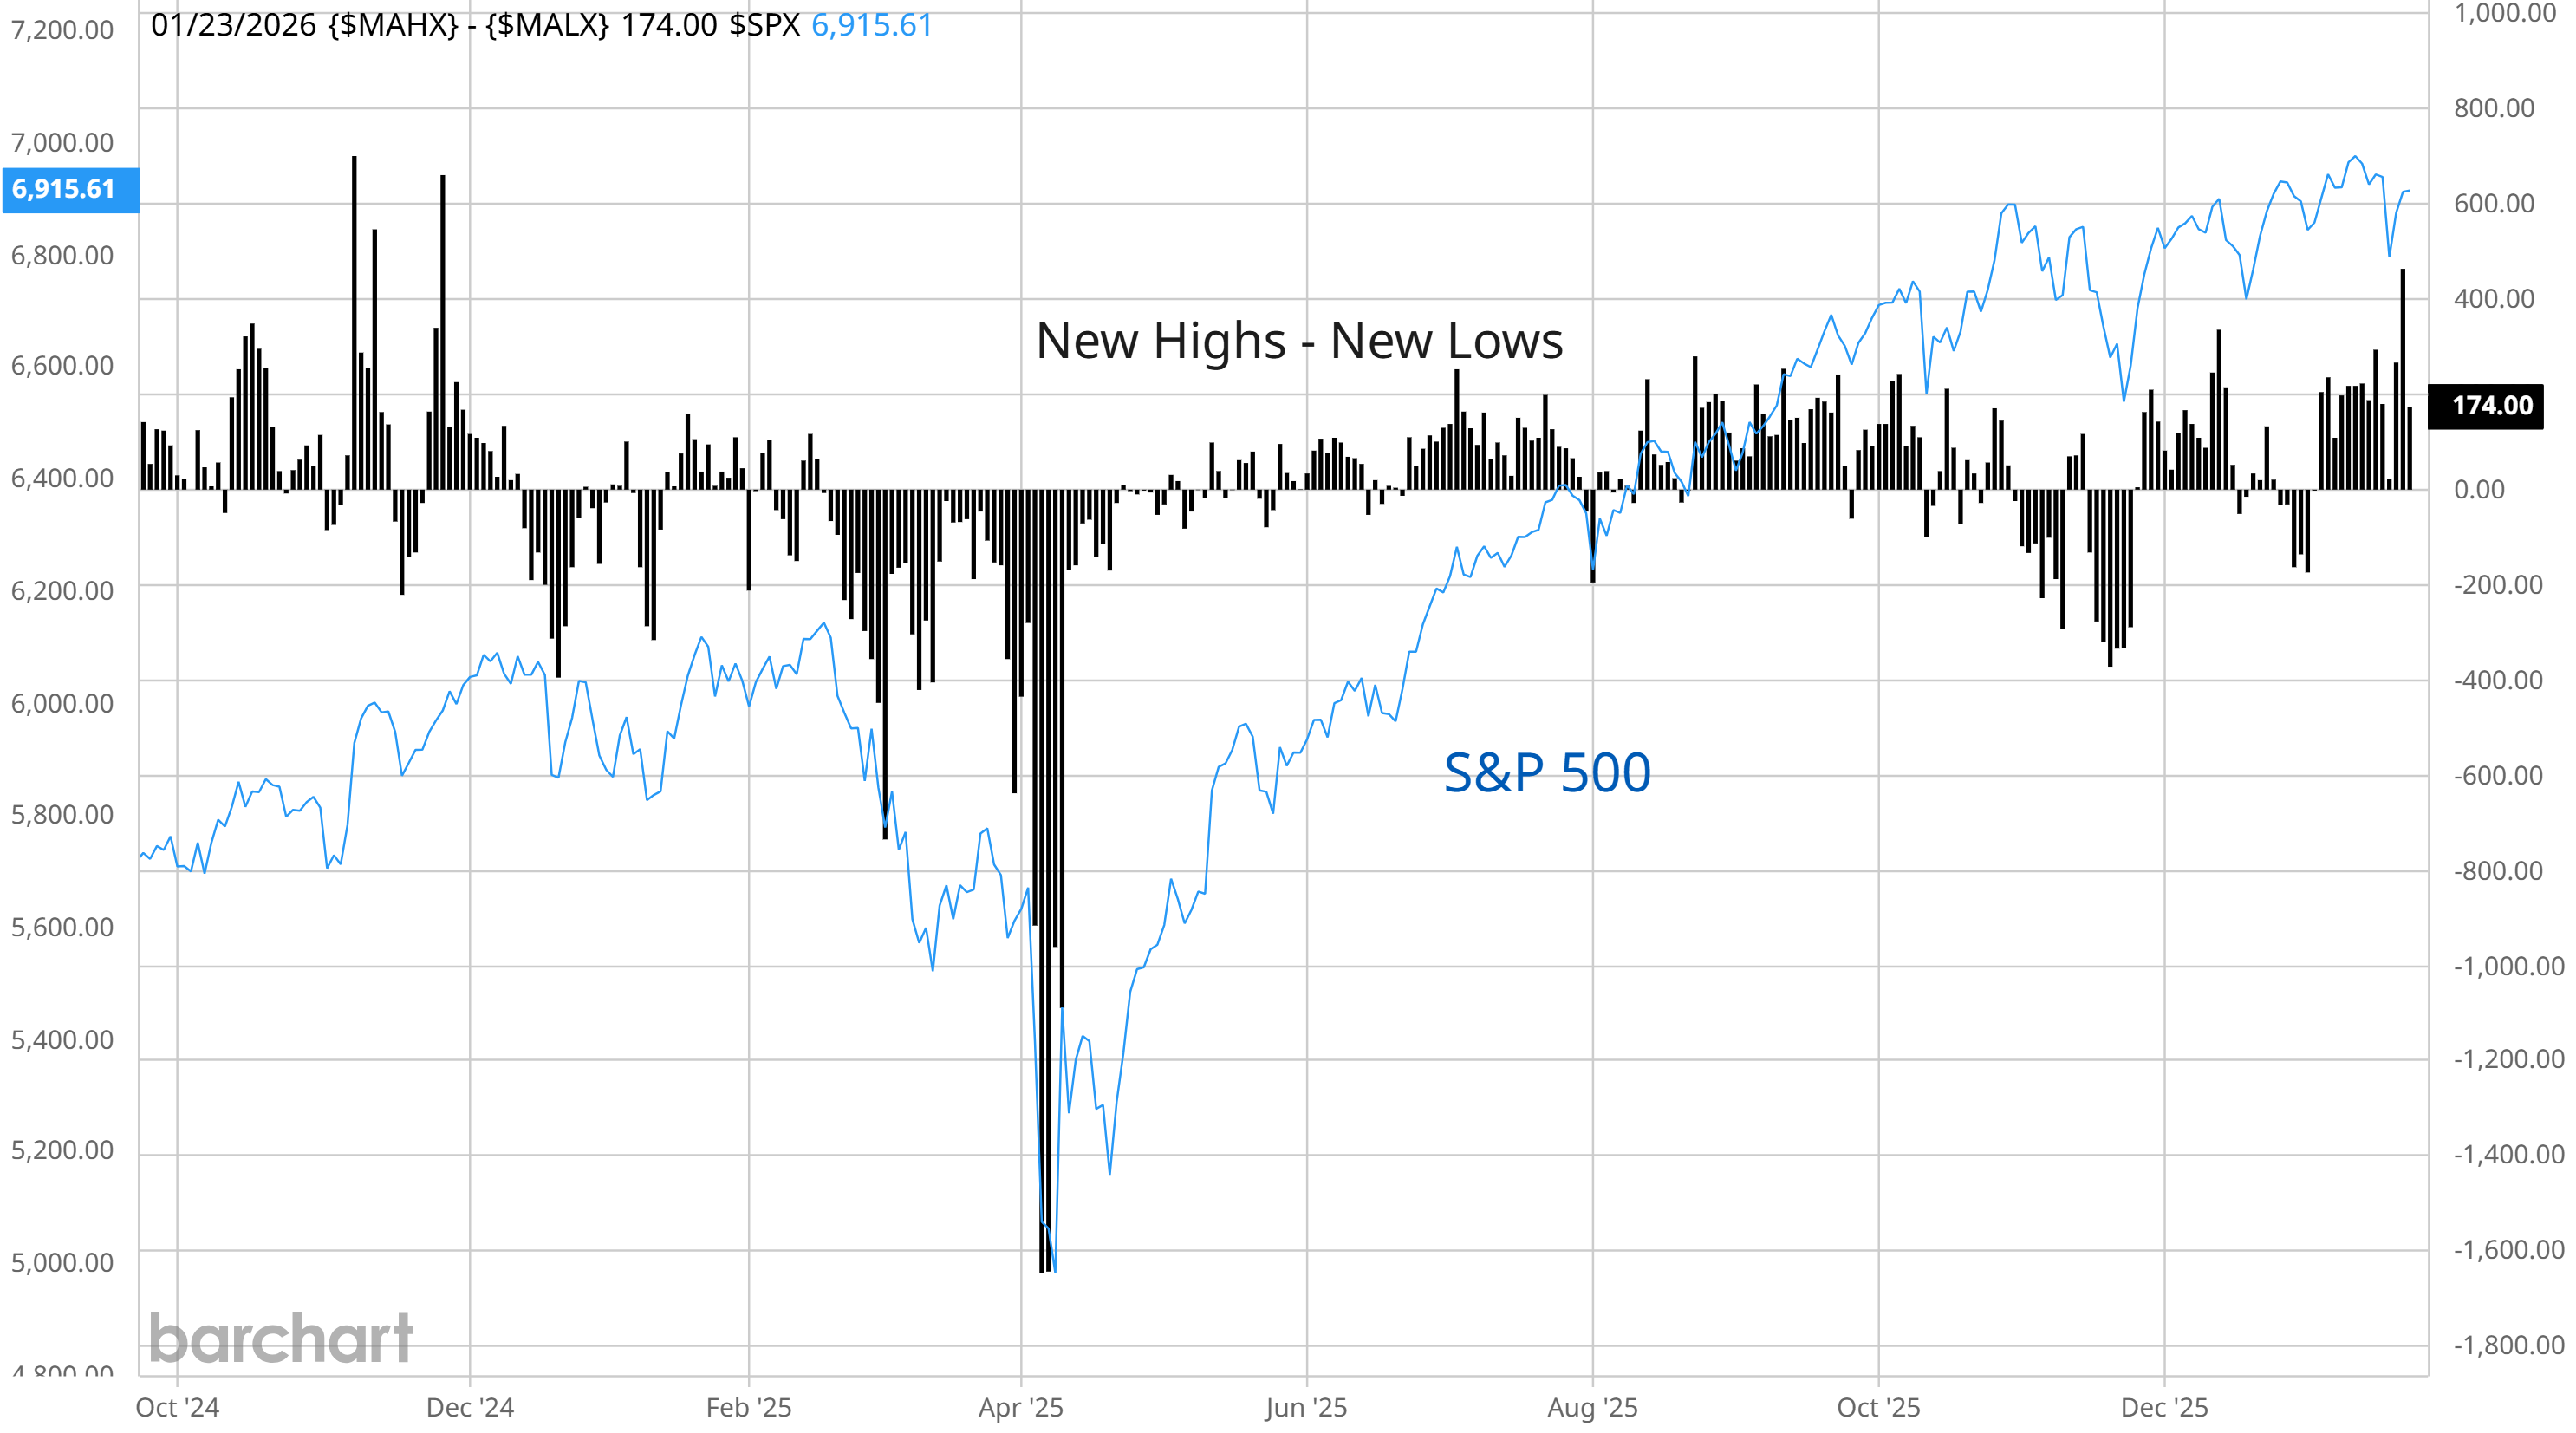
Leadership in the average stock coupled with ongoing loose financial conditions are bullish catalysts to keep the rally intact to start the year.
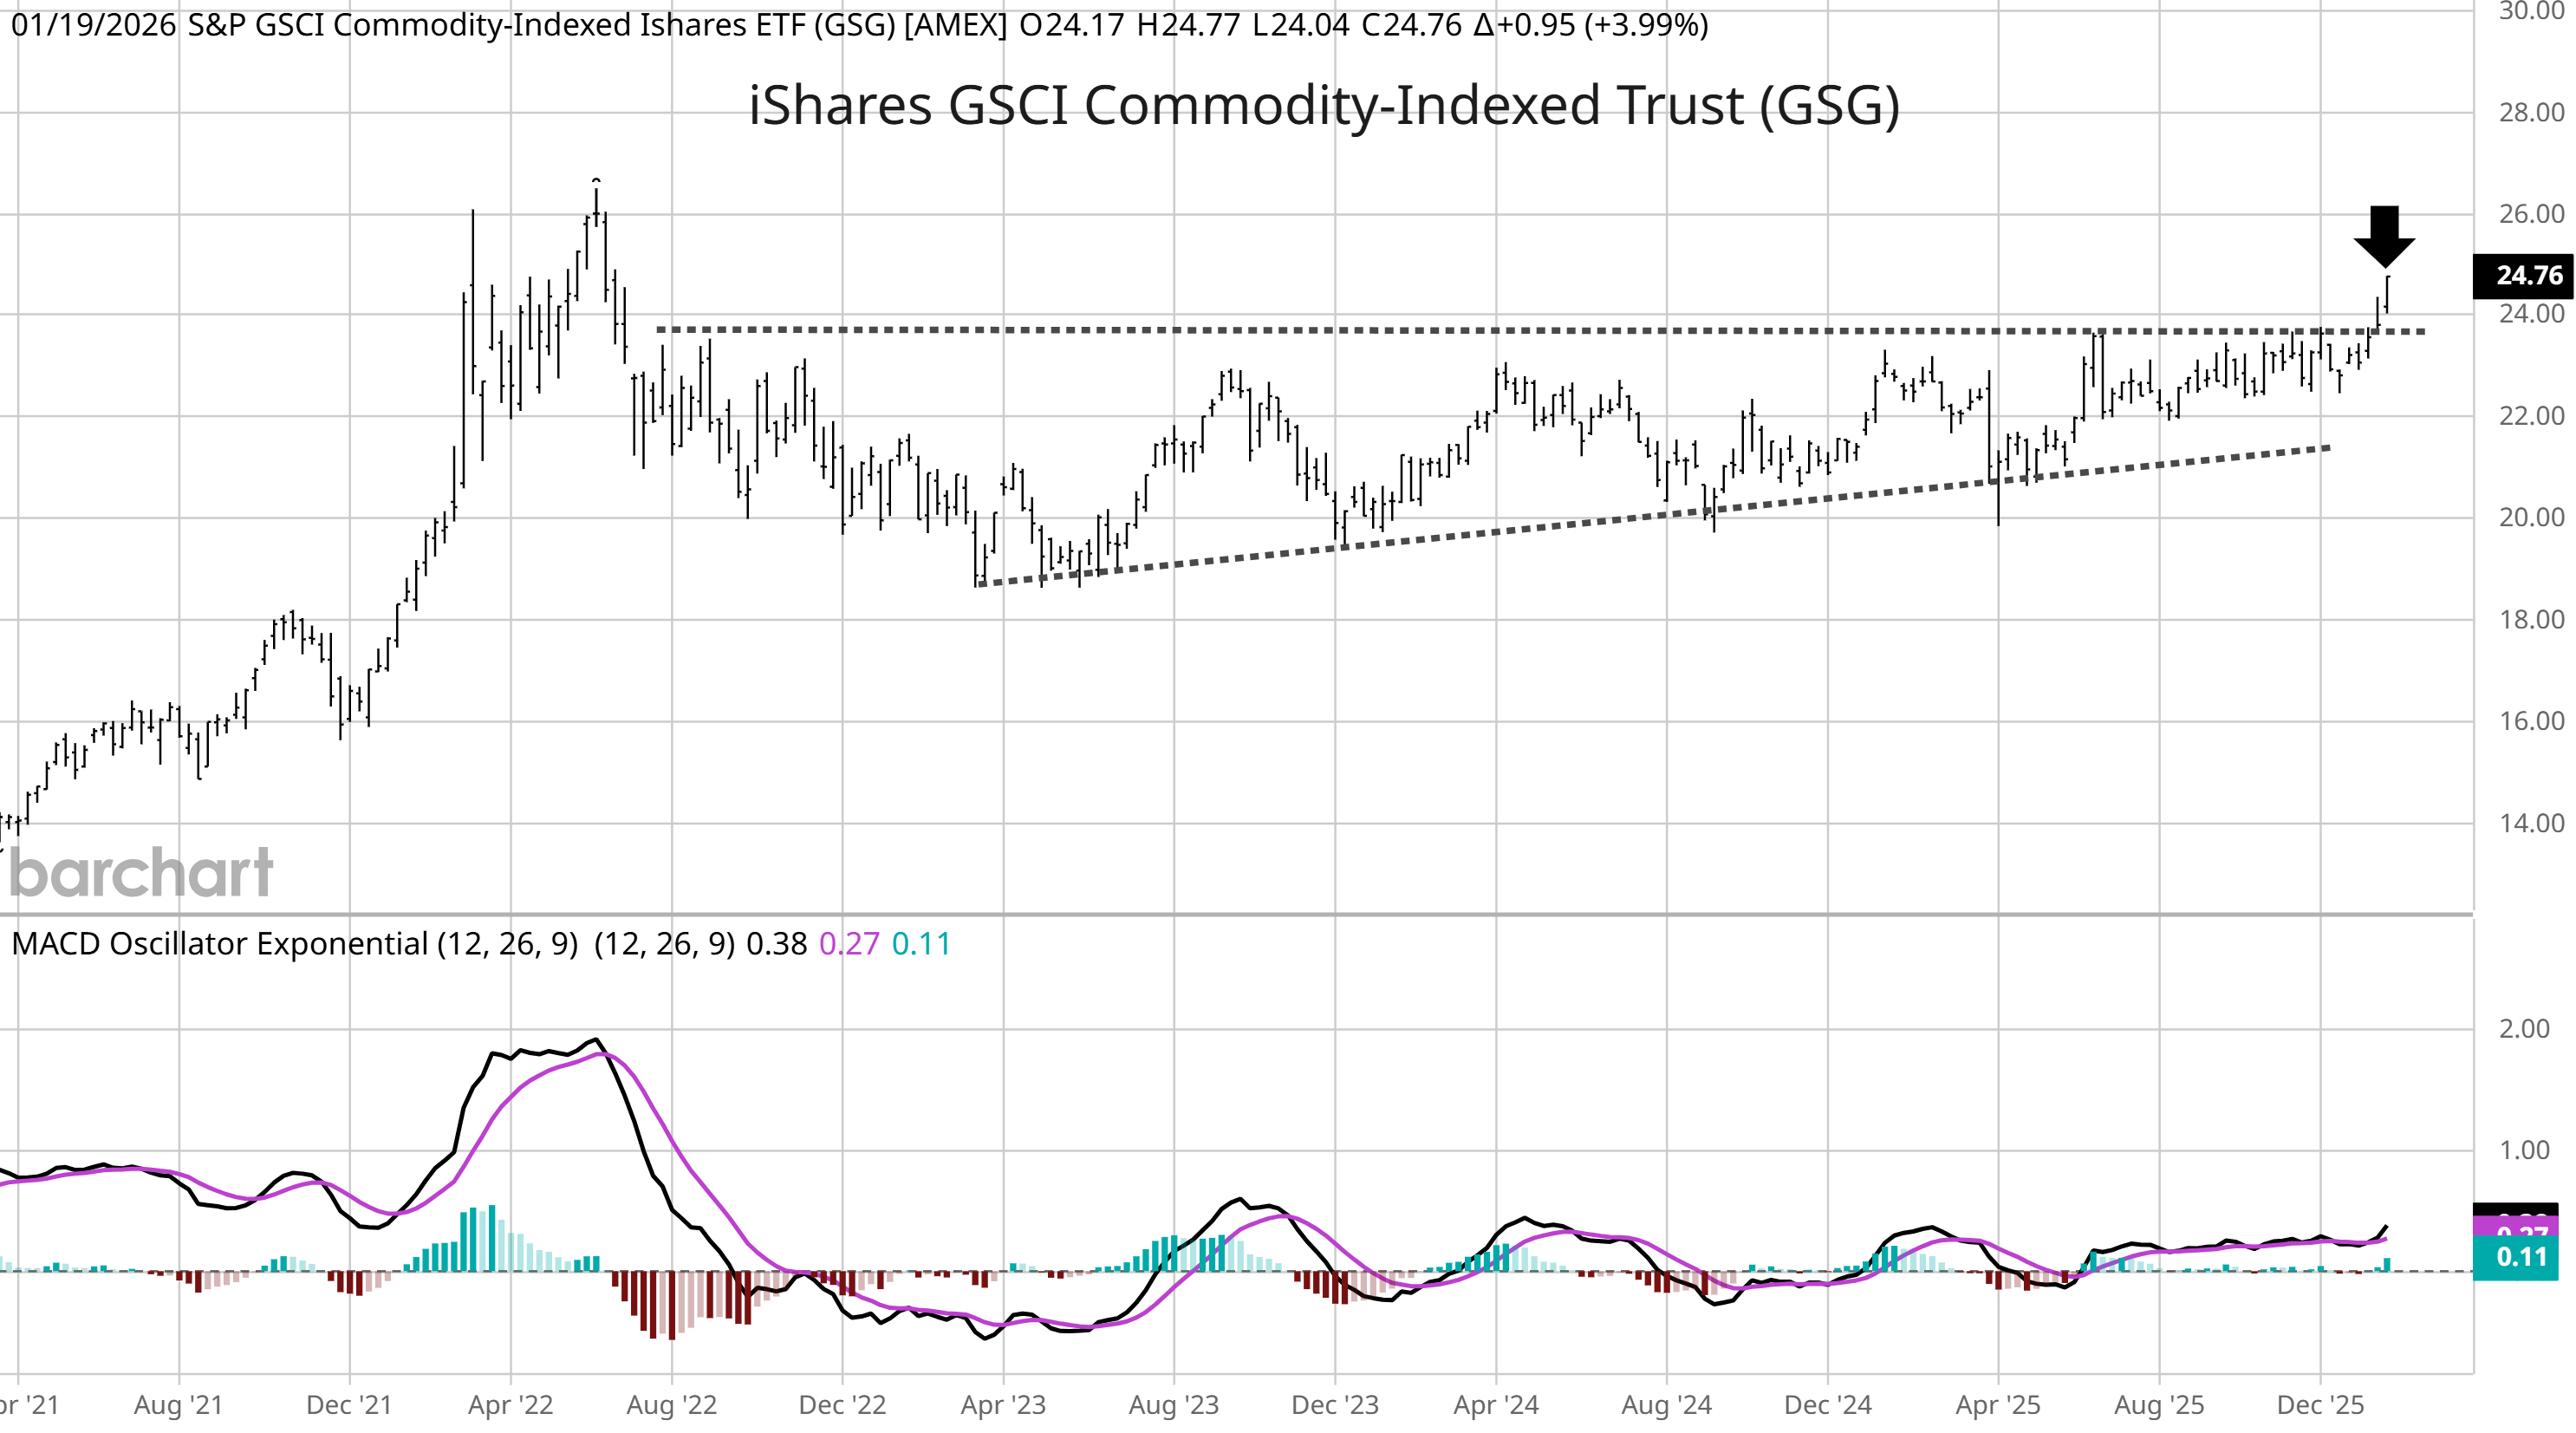
But something else extremely important should be catching your attention, and that’s the breakout in broader commodity indexes. Precious metals like gold and silver are capturing headlines, and so is the rally in base metals like copper.
But even oil prices are finding firmer footing which is driving the S&P GSCI Commodity-Indexed iShares ETF (GSG) to a breakout from a multi-year ascending triangle pattern (chart below). This has massive implications for the inflation outlook ahead, and comes at an interesting time when you overlay the current inflation cycle with the one from the 1970s (more on that below).
I’m resharing my original post below, in which I detail the most important charts for 2026. All the ingredients are there to drive a positive start to the year (although the indexes might struggle to reflect it), while inflation and the rate outlook could drive significant bond market volatility as the year progresses.
The Chart Report
Loose financial conditions tends to be supportive of equity prices, and has been a major tailwind since this cyclical bull market started in late 2022. Financial conditions refers to the cost and availability of credit, which is correlated to economic activity (and thus the earnings outlook). The chart below shows a measure of financial conditions overlaid with the ISM gauge of manufacturing activity. Conditions are now at the loosest levels since 2021, which remains supportive of economic activity and stock prices as we enter the new year.

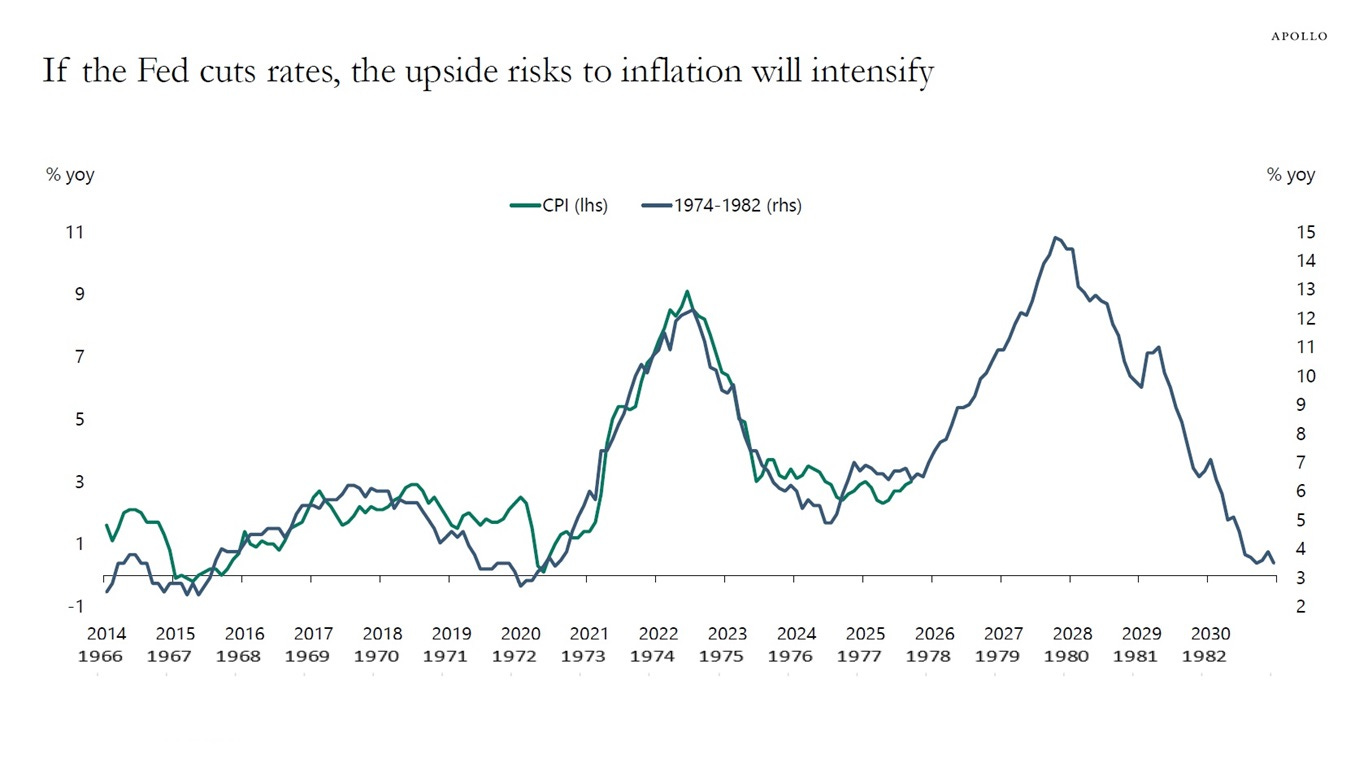
Loose monetary policy and an expanding global money supply are key drivers behind bullish financial conditions. But if those conditions also deliver stronger than expected economic growth, inflation could become more problematic in the year ahead. Core measures of consumer inflation have remained near the 3% level on a year-over-year basis, with the disinflation trend since mid-2022 stalling out well above the Fed’s 2% inflation target. If inflation does show signs of accelerating in 2026, then consumer inflation could repeat the trend seen during the 1970s which happened in two distinct waves. The chart below overlays the consumer price index (CPI) since 2014 with the stagflation period around the 1970s. If the cycle continues tracking, there could be another inflation wave ahead in 2026.
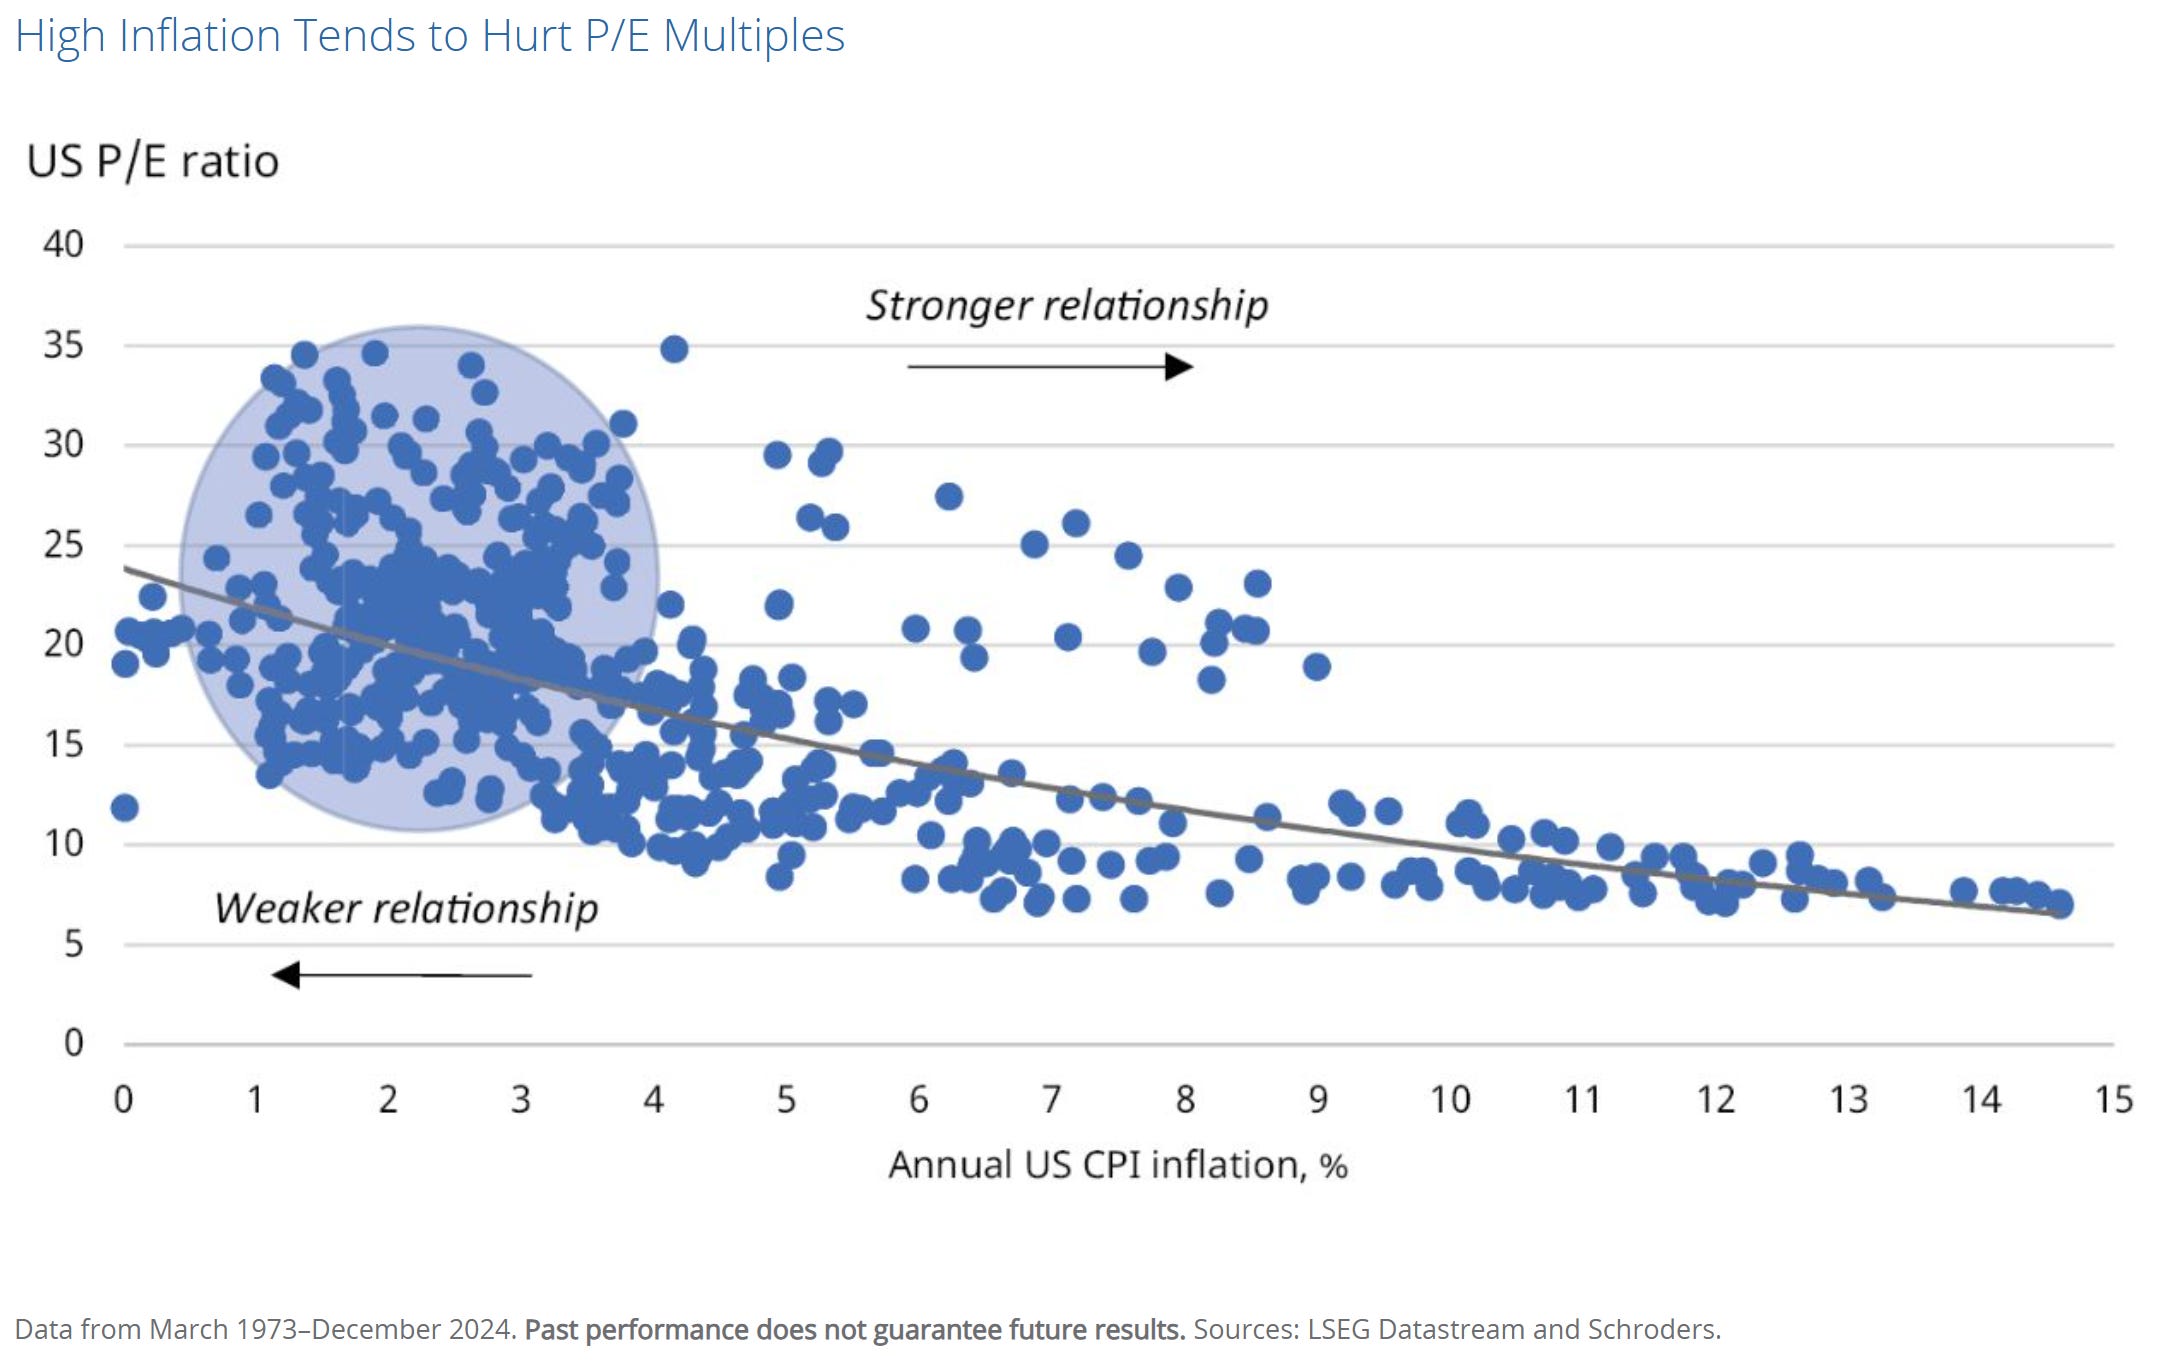
Various measures of stock market valuations are running near historic extremes. The S&P 500’s forward price-to-earnings (P/E) ratio sits at 22.0, which is 13% above the 30-year average and has only been higher during the internet bubble and the peak heading into 2022’s bear market. While optimism around the earnings outlook and loose financial conditions can support elevated valuation multiples for now, the prospect of rising inflation in 2026 could pressure valuations. The chart below plots the P/E ratio against consumer inflation. Low levels of inflation under 3-4% tends to have a low correlation to valuations levels. However, as inflation rises you can see a stronger relationship on dragging market valuation multiples lower.
Stocks leveraged to the artificial intelligence (AI) theme are playing a major role in driving large-cap valuations to extremes. The top 10 stocks by weight in the S&P 500 comprise over 40% of the index, and includes companies like Nvidia (NVDA) and Microsoft (MSFT). But stocks in the mid- and small-cap sector have not seen a corresponding jump in valuations, and are now trading at a historically cheap levels relative to large-caps. The chart below plots the forward P/E ratio of mid-cap stocks relative S&P 500. The relative valuation ratio is hitting the lowest level since the late 1990s period heading into the internet bubble peak.

While investors are captivated with the strong gains seen in precious metals, the surge in gold and silver could be flagging concerns over rising U.S. debt levels and deficit spending. The U.S. Dollar Index (DXY) also saw a historically weak start to 2025, and finished the year with one of the worst annual declines in nearly a decade. The moves in precious metals and DXY are worth monitoring given a massive amount of U.S. Treasury securities that mature in 2026. About 34% of all outstanding Treasuries will mature in 2026, or about $9 trillion in total (chart below). In addition, continued deficit spending means that there’s an additional $1.7 trillion in new debt that must be issued as well. Watch for any signs of bond market volatility that could spillover into the equity markets in the year ahead.

Heard in the Hub
The Traders Hub features live trade alerts, market update videos, and other educational content for members.
Here’s a quick recap of recent alerts, market updates, and educational posts:
Tariff and trade war headlines driving the narrative.
A common price pattern to track on QQQ and Bitcoin.
A pair of “must watch” charts to time the AI bubble pop.
How to use charts to tune out the noise and determine the trend.
What infrastructure stock breakouts mean for our newest position.
You can follow everything we’re trading and tracking by becoming a member of the Traders Hub.
By becoming a member, you will unlock all market updates and trade alerts reserved exclusively for members.
Trade Idea
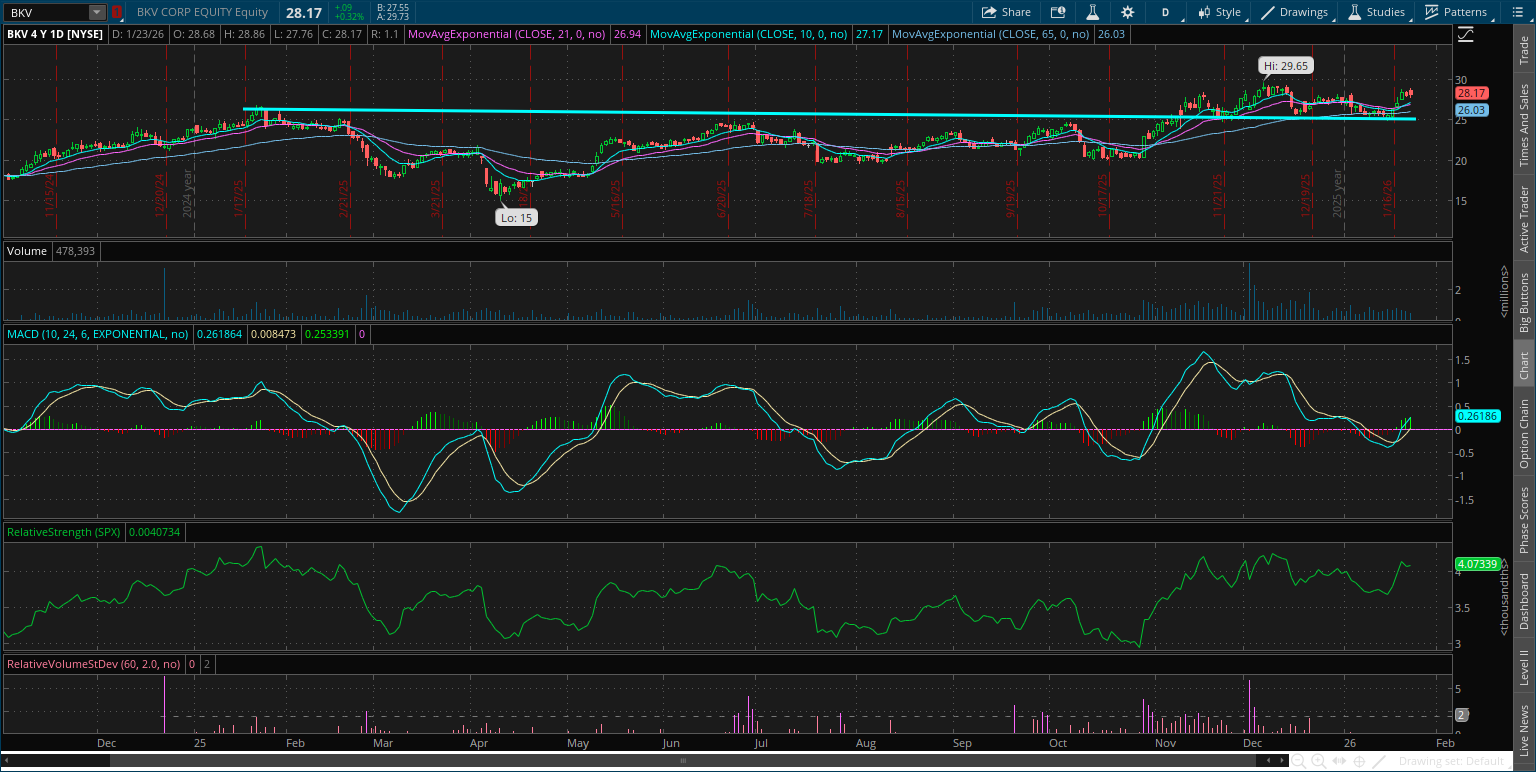
BKV Corp (BKV)
Natural gas stock that could create a base-on-base pattern following a breakout over the $25 level in November. BKV is back testing that area as support several times while creating a new resistance level at $30. Need to see one smaller pullback with a bullish MACD reset above zero.
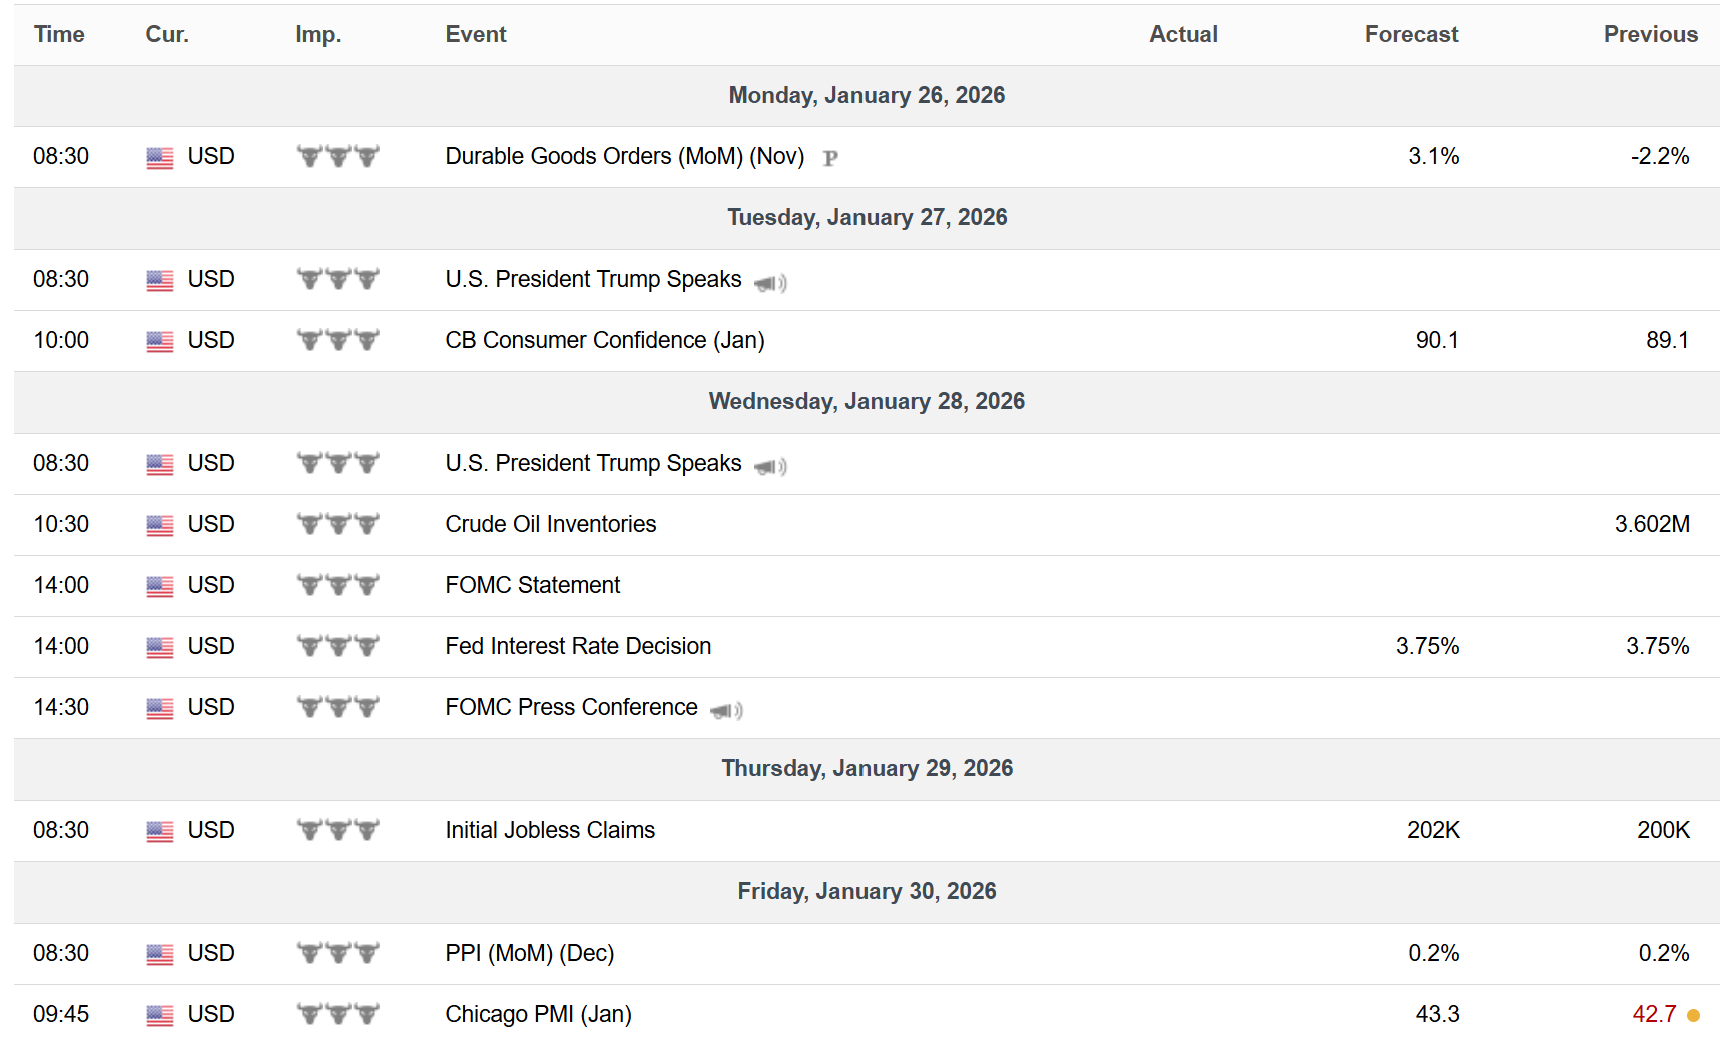
Key Upcoming Data
Economic Reports
Earnings Reports

I hope you’ve enjoyed The Market Mosaic, and please share this report with your family, friends, coworkers…or anyone that would benefit from an objective look at the stock market.
Become a member of the Traders Hub to unlock access to:
✅Model Portfolio
✅Members Only Chat
✅Trade Ideas & Live Alerts
✅Mosaic Vision Market Updates + More
Our model portfolio is built using a “core and explore” approach, including a Stock Trading Portfolio and ETF Investment Portfolio.
Come join us over at the Hub as we seek to capitalize on stocks and ETFs that are breaking out!
And if you have any questions or feedback, feel free to shoot me an email at mosaicassetco@gmail.com
Disclaimer: these are not recommendations and just my thoughts and opinions…do your own due diligence! I may hold a position in the securities mentioned in this report.