
The Market Mosaic 12.14.25
Monetary and Fiscal Stimulus Fueling a Stock Market Boost.

👋Welcome back to The Market Mosaic, where I gauge the stock market’s next move by looking at macro, technicals, and market internals. I’ll also highlight trade ideas using this analysis.
If you find this report helpful please hit that “like” button, share this post, and become a subscriber if you haven’t already done so!
🚨And be sure to check out Mosaic Traders Hub. It’s a members-only platform to alert trade ideas, track a model portfolio of open positions, and further analyze the message coming from the capital markets (👇be sure to check out our offer to join the Hub below).
Now for this week’s issue…
The Federal Reserve is taking actions to boost liquidity and loosen financial conditions further.
At their final meeting of 2025, the Fed cut interest rates by another 0.25% as widely expected heading into the meeting. It was the third consecutive cut since the Fed resumed reducing rates in September.
But the central bank also announced a fresh round of money printing. While not referring to the program as quantitative easing, the Fed is back to expanding its balance sheet by purchasing $40 billion in Treasury bills every month.
The Fed is resuming balance sheet expansion the same month that quantitative tightening was ended, which is where government fixed income securities were allowed to mature without reinvesting the proceeds.
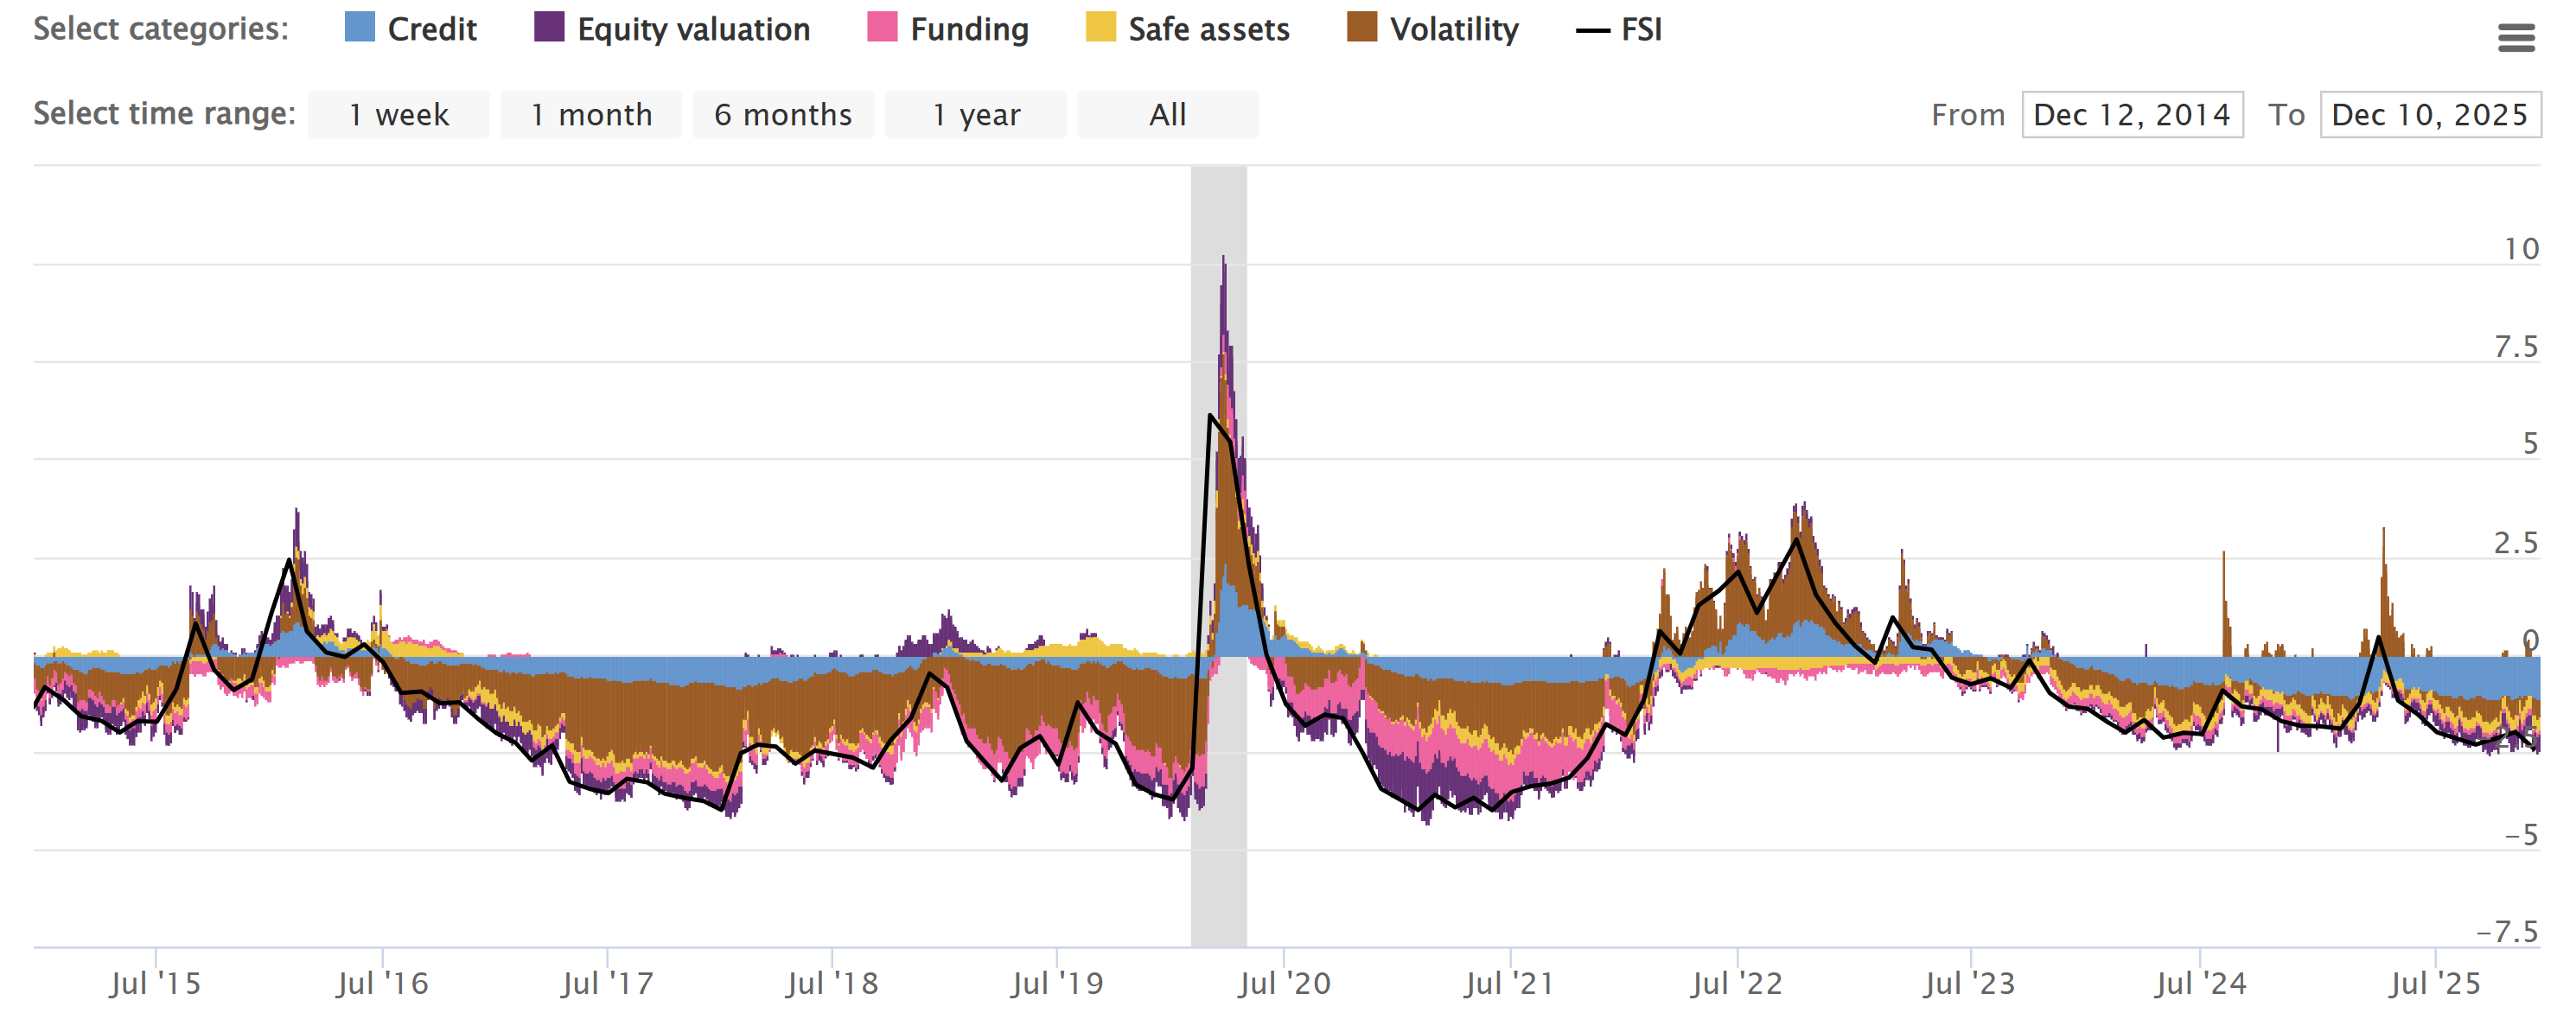
The rate cuts and fresh round of asset purchases comes at a time when financial conditions are already running much looser than average. The chart below plots a measure of global financial stress, where a reading below zero points to stress levels below average.
The boost to liquidity is also coinciding with solid economic growth and fiscal stimulus arriving next year due to tax and spending provisions contained in the One Big Beautiful Bill.
That’s a perfect storm of conditions to keep driving the bull market into the new year. With valuations historically extended, a positive earnings outlook is critical to support additional gains in the stock market.
This week, lets take a closer look at monetary and fiscal stimulus set to arrive with the stock market already hovering near record highs. We’ll also look at market breadth and conditions to spark a year-end rally, and why the Fed could become a volatility flashpoint in 2026.
The Chart Report
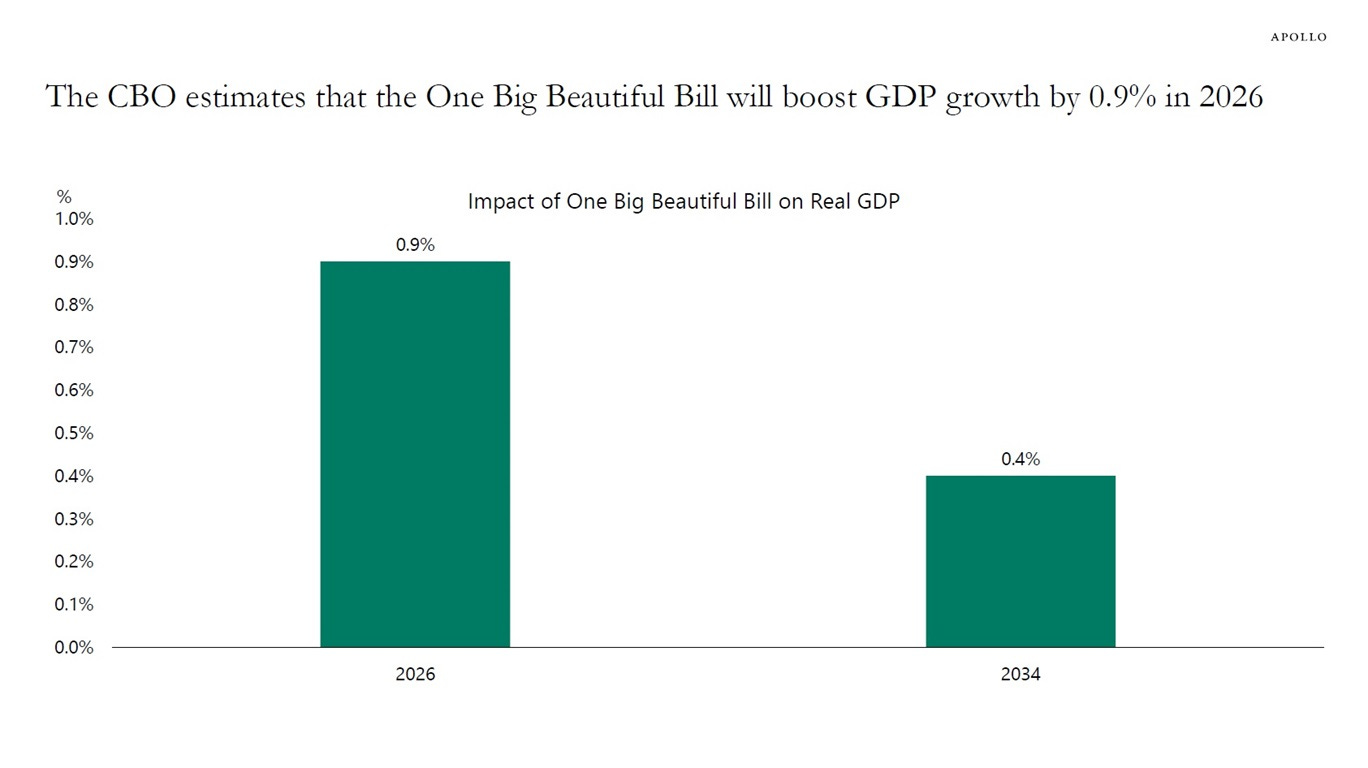
At a time when market liquidity is receiving a boost from monetary sources, a large round of fiscal stimulus is set to arrive as well. The One Big Beautiful Bill isn’t receiving much attention as 2026 draws near, but numerous provisions go into effect that will be a tailwind for the economy and consumer spending. The bill includes things like increasing the standard tax deduction and child tax credit, as well as deductions for overtime pay and interest on auto loans. All together, the tax and spending provisions in the bill are forecasted to boost GDP growth by 0.9% in 2026 (chart below).
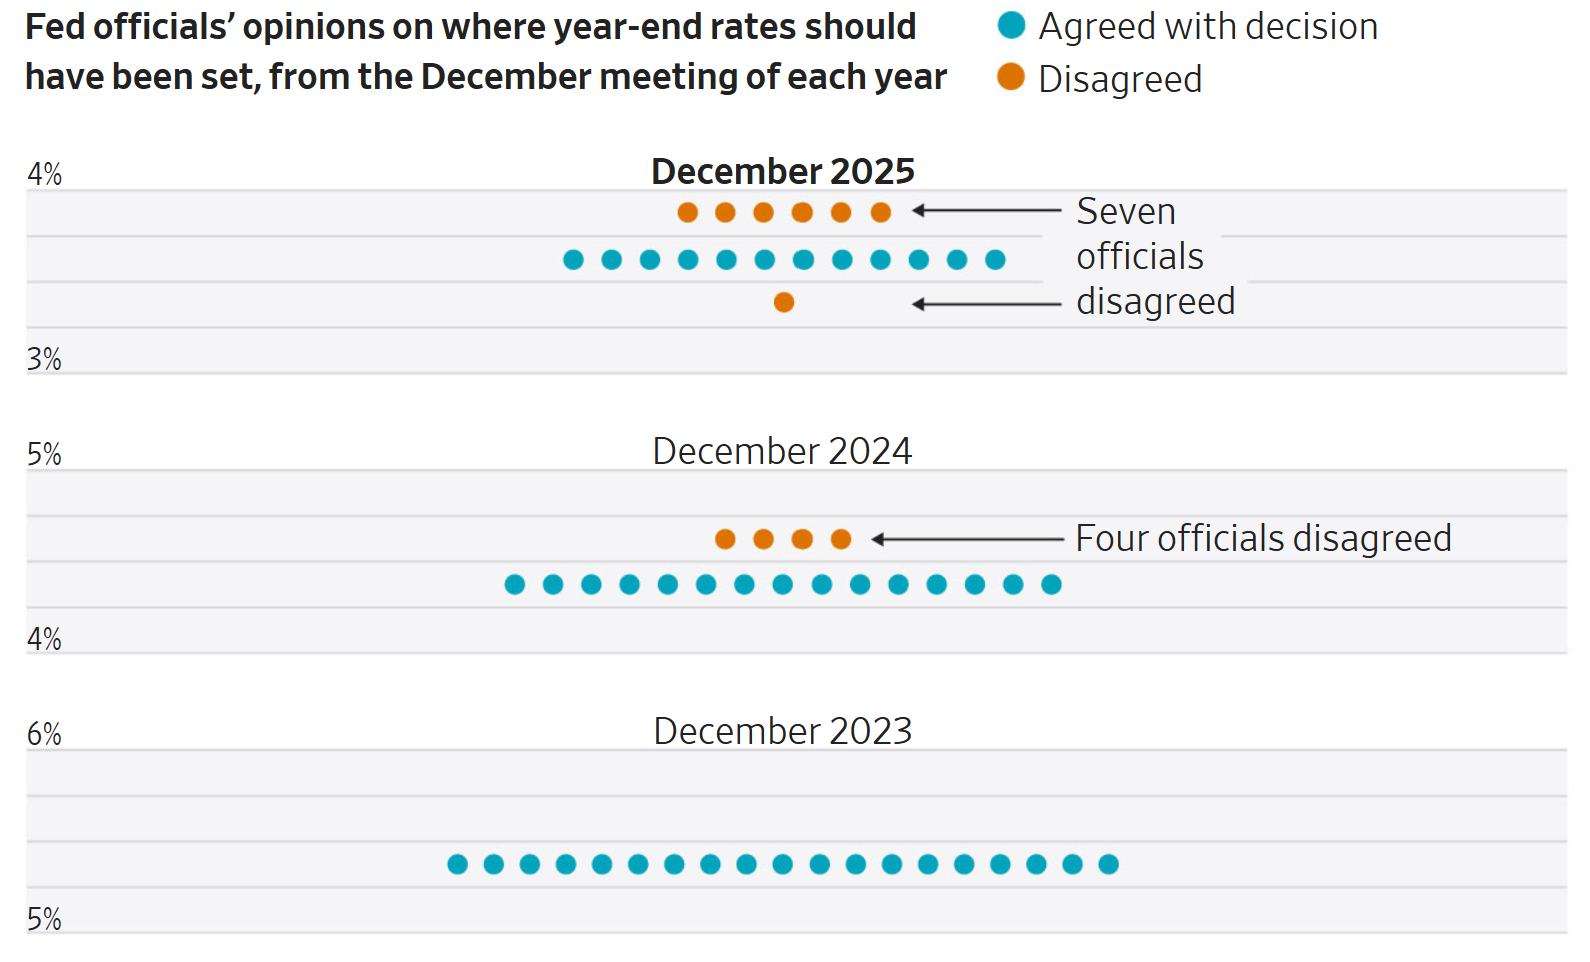
The Fed will be a key catalyst for driving stock market volatility into the new year. While recent actions to cut rates and boost market liquidity are tailwinds for the bull market, the narrative could change as Jerome Powell’s position as Fed Chair ends in May. There is intense political pressure on the Fed to keep cutting interest rates. But at the same time, consumer inflation is running well above the Fed’s 2% target while the labor market has not deteriorated as sharply as feared. Measures of economic activity are holding up and more fiscal stimulus is set to arrive next year. That’s driving dissent within the Fed to levels never seen during Powell’s term. The chart below shows where each official (though not all are voting members) at the Fed’s December meeting believed the short-term fed funds rate should end each year. Following a unanimous decision in 2023, disagreements are increasing over the last two years. Uncertainty over the outlook for monetary policy could be a major theme in the year ahead.
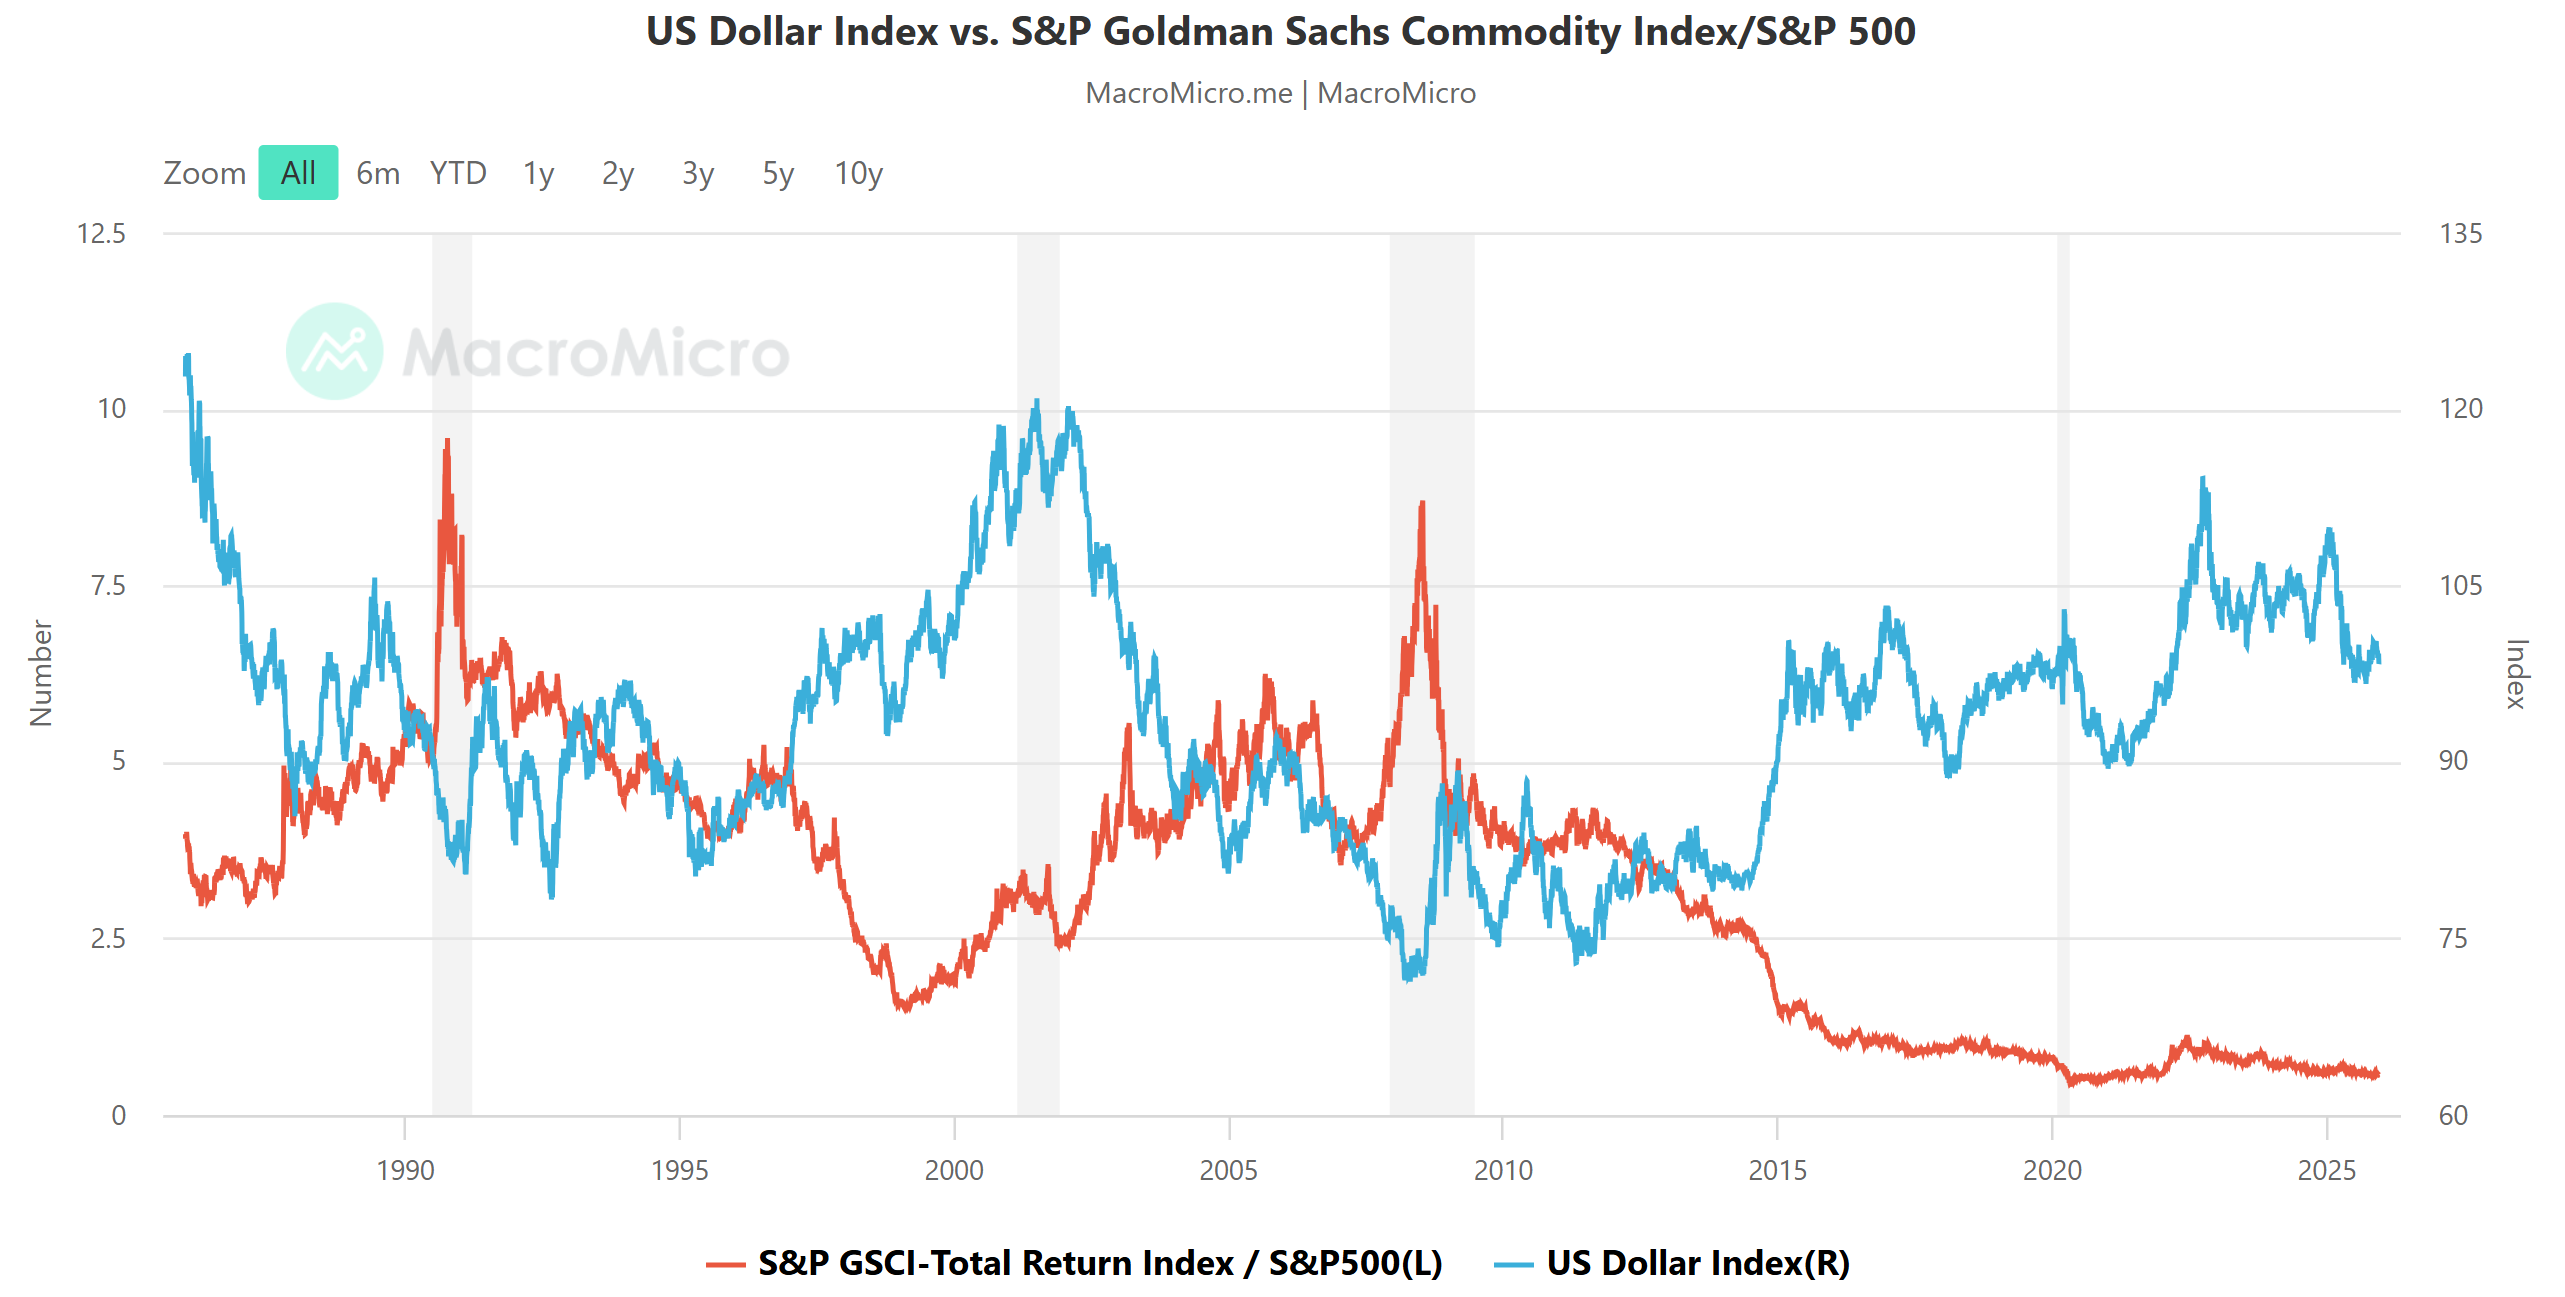
Following the Fed’s decision to cut interest rates and resume purchasing Treasury securities, the U.S. Dollar Index (DXY) is weakening once again. DXY turned lower following a test of the key 100 level, and is losing support at both the 50- and 200-day moving average. The Fed’s trade weighted dollar index also shows the dollar running at levels that are still historically overvalued. If DXY remains weak into 2026, that could be a huge boost for the commodities trade. The chart below shows DXY (blue line) against the ratio of commodities to the S&P 500 (red line). You can visually see the inverse correlation, where a falling dollar drives commodities to outperform the S&P 500. The commodities ratio is hovering near the cheapest levels ever seen.
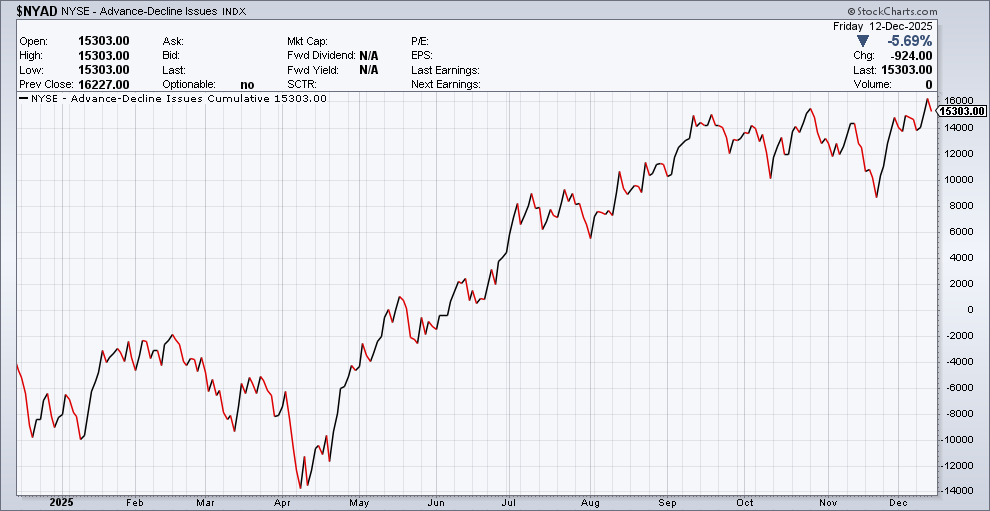
Popular stocks leveraged to the artificial intelligence (AI) and growth trade are weighing on the stock market recently. Nvidia (NVDA) is trading near a three month low, while companies like Broadcom (AVGO) and Oracle (ORCL) have seen their stock prices imploding. But that is masking strength seen elsewhere in the market. Following the Fed’s decision to cut rates and expand the balance sheet, there was a jump in the number of new highs across the market. That’s driving indexes of the average stock out to new highs, including the NYSE’s advance/decline line which is a cumulative sum of daily net advancing stocks on the exchange (chart below). The jump to new highs shows strong participation by the average stock.
Historical stock market seasonality could play a key role in the final weeks of 2025. While November marked the start of strong six month stretch for the S&P 500, the index is struggling recently to make it past the highs seen in late October. While the S&P is trading sideways during the first couple weeks of December, that aligns with seasonal trends looking back. The chart below shows how the S&P has tracked during December using data back to 1950. The first half of the month tends to experience volatile sideways trading before strength emerges during the second half of the month. With the Fed delivering a boost to liquidity along with strong breadth recently, I believe conditions could support a similar path this year as well.

Heard in the Hub
The Traders Hub features live trade alerts, market update videos, and other educational content for members.
Here’s a quick recap of recent alerts, market updates, and educational posts:
Tracking the top catalyst driving stock prices.
Quantifying the impact of fiscals stimulus in 2026.
Why the U.S. dollar could still be historically overvalued.
The chart setup that could tip problems ahead for inflation.
The biggest challenge facing the stock market in the New Year.
You can follow everything we’re trading and tracking by becoming a member of the Traders Hub.
By becoming a member, you will unlock all market updates and trade alerts reserved exclusively for members.
🚨Gold mining stocks could be setting up another round of breakouts. Hub members are currently sitting on gains of 141% and 93% on mining positions, while our silver trade is up 77%. Click the link below for a special discount to join the Hub today!
👉You can click here to join now👈
Trade Idea
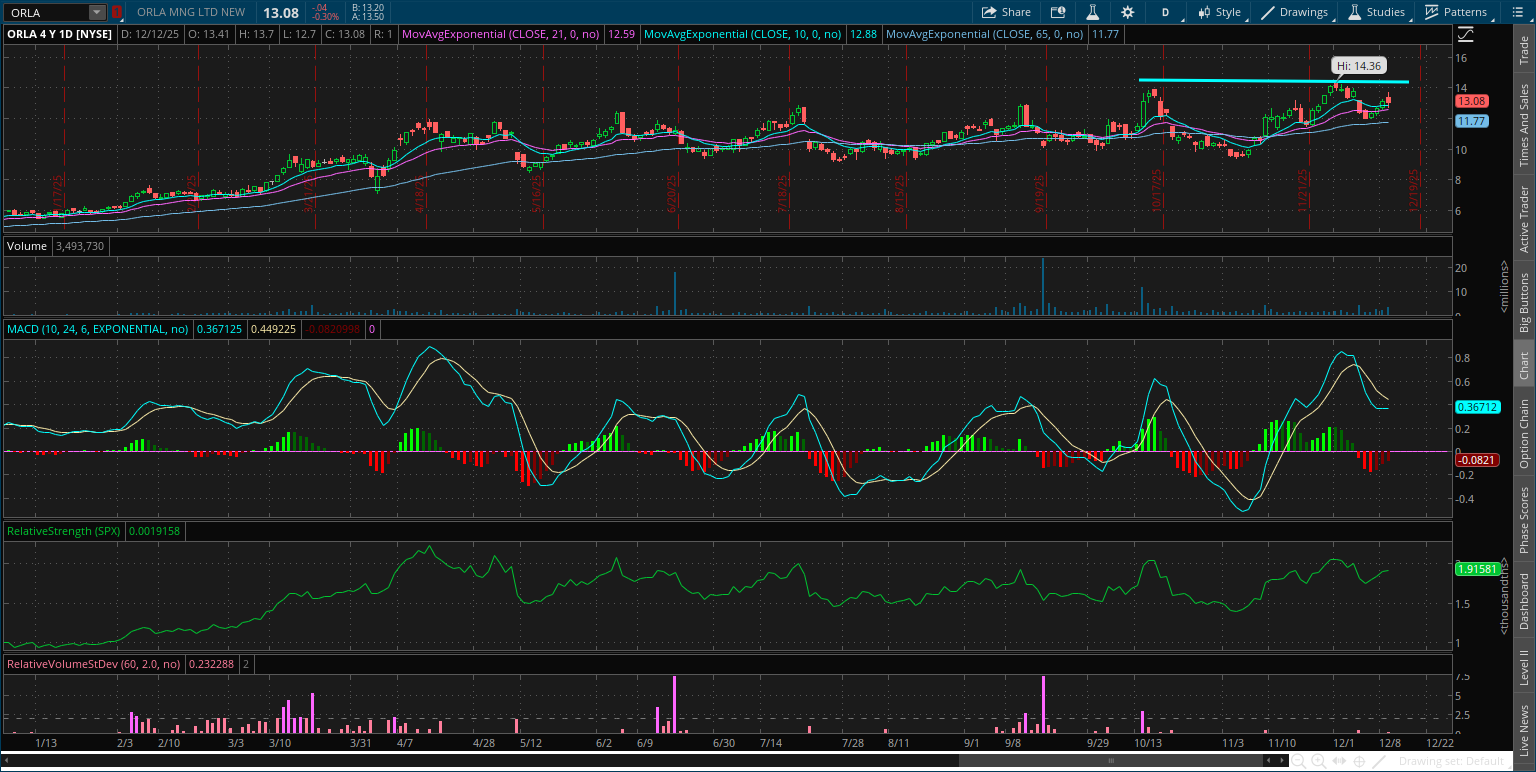
Orla Mining (ORLA)
Mining stock that was trading in a loose basing pattern since April. The stock recently made a new high near $14 and is retesting that level at the start of December. ORLA is now seeing a smaller pullback off that level. I’m watching for a breakout over $14.
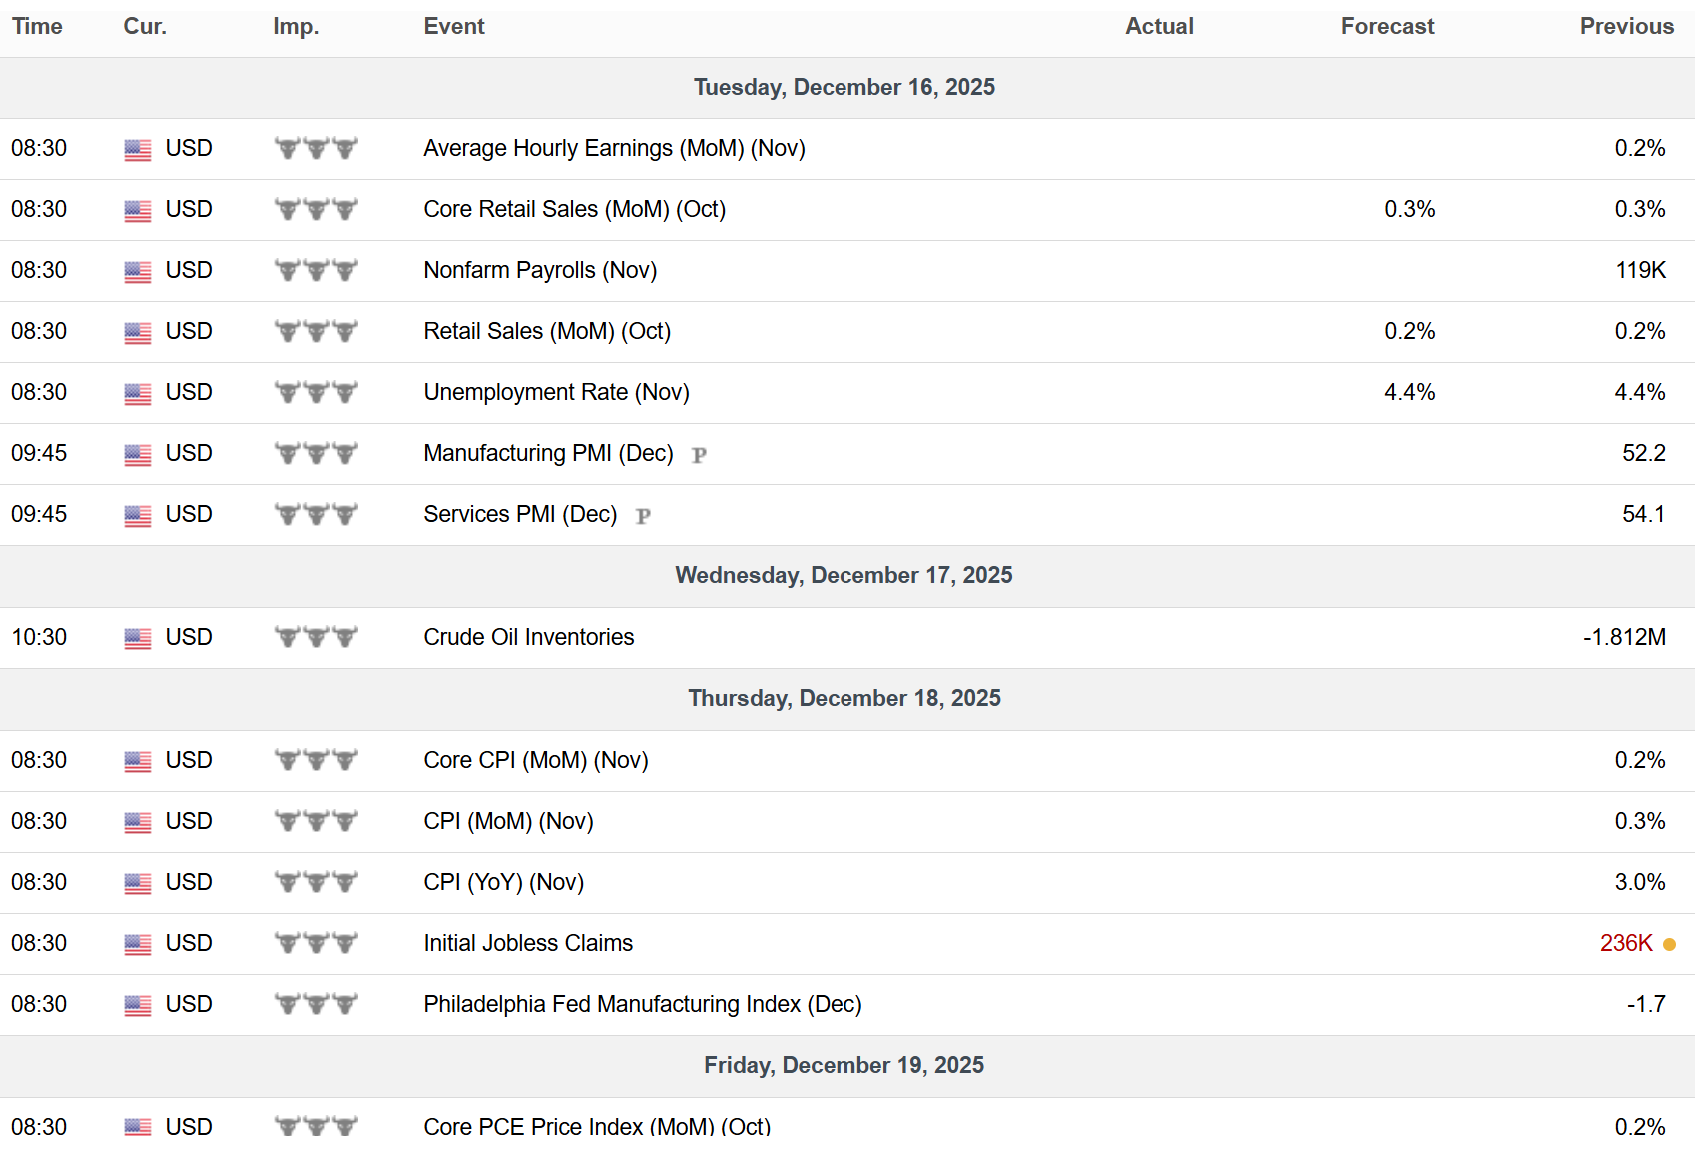
Key Upcoming Data
Economic Reports
Earnings Reports

I hope you’ve enjoyed The Market Mosaic, and please share this report with your family, friends, coworkers…or anyone that would benefit from an objective look at the stock market.
Become a member of the Traders Hub to unlock access to:
✅Model Portfolio
✅Members Only Chat
✅Trade Ideas & Live Alerts
✅Mosaic Vision Market Updates + More
Our model portfolio is built using a “core and explore” approach, including a Stock Trading Portfolio and ETF Investment Portfolio.
Come join us over at the Hub as we seek to capitalize on stocks and ETFs that are breaking out!
And if you have any questions or feedback, feel free to shoot me an email at mosaicassetco@gmail.com
Disclaimer: these are not recommendations and just my thoughts and opinions…do your own due diligence! I may hold a position in the securities mentioned in this report.