The Market Mosaic 12.1.24
S&P 500: 3 catalysts for a strong finish to 2024.
Welcome back to The Market Mosaic, where I gauge the stock market’s next move by looking at macro, technicals, and market internals. I’ll also highlight trade ideas using this analysis.
If you find this content helpful please hit that “like” button, share this post, and become a subscriber if you haven’t already done so!
And be sure to check out Mosaic Traders Hub. It’s a members-only platform to alert trade ideas, track a model portfolio of open positions, and further analyze the message coming from the capital markets.
Now for this week’s issue…
A holiday-shortened week for investors in the U.S. completed a trifecta of bad news on the inflation front.
During the week, a report on the personal consumption expenditures price index (PCE) increased by 2.3% in October (blue line) compared to last year. The core measure gained by 2.8% (green line), with the chart below showing the year-over-year change in headline and core PCE going back six years.
While the increases were in line with economist estimates, both the headline and core figure accelerated from September’s pace shown with the red circle. That’s another sign that the disinflation trend since mid-2022 is stalling out at levels well above the Fed’s 2% inflation target.
That’s especially the case with core inflation, including recent reports on the Consumer Price Index (CPI) and Producer Price Index (PPI). In fact, for the first time since February 2022, core CPI, PPI, and PCE all accelerated at the same time as you can see below.
As a result, the 2-year Treasury yield that historically leads changes in the fed funds rate is now only 0.56% below current fed funds. That implies the bond market expects just two more 0.25% rate cuts ahead.
Accelerating inflation and the impact on monetary policy were major factors driving 2022’s bear market in stocks. So growing uncertainties around the rate outlook might have investors wondering how much upside is left for the S&P 500.
But despite the challenges posed to the interest rate outlook by the latest round of inflation data, stocks can keep rallying into year-end driven by three factors serving as tailwinds for stock prices.
3 Catalysts for a Strong Finish
While there might be growing uncertainties around the pace and magnitude of how quickly the Fed can cut rates looking ahead, there are three underlying catalysts that can sustain the bull market into year-end.
One of those factors comes down to participation in the trend. Stock market breadth looks at how many stocks are joining the major indexes in a directional move.
When the S&P 500 is moving higher, you want to see the gains supported by a large number of stocks. On the other hand, narrow breadth shows the rally foundation is crumbling and is a warning sign.
And recently, there are signs that the average stock is leading the major indexes higher. I recently posted a video here showing how an equal-weight version of the S&P 500 is leading the capitalization-weighted version over the near-term.
Small-caps stocks are also surging to new all-time highs. The weekly chart below shows the iShares Russell 2000 ETF (IWM) that tracks small-caps.
Small-caps recently broke out from an ascending triangle pattern shown with the dashed trendlines. After back testing the breakout level (where price resistance became support), IWM is making its way higher and surpassing the prior peak shown at the arrow.
A jump in the average stock is also taking net new 52-week highs (chart below) to levels not seen in over three years. Net new highs takes the number of stocks across the major exchanges making a new 52-week high and subtracts those making a new 52-week low.
You can see in the chart a cluster of net new highs pushing toward the 700 level shown with the arrows. That’s the highest level since early 2021, and comes as small-caps mentioned above are finally breaking out.
At the same time, a favorable seasonal stretch is ahead for investors. I previously outlined how the week of Thanksgiving through the Santa Claus rally experiences strong average gains for both large- and small-cap stocks.
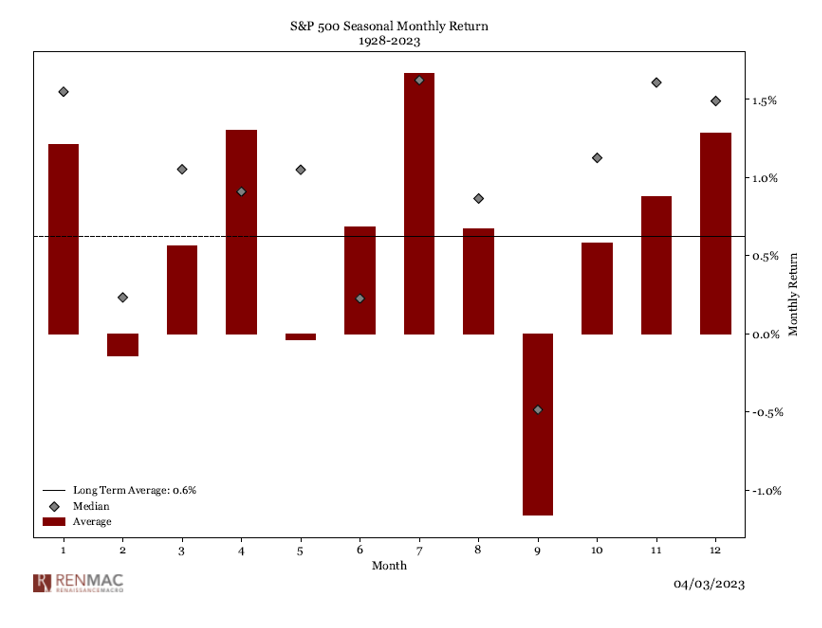
The chart below also takes a look at calendar month seasonality for the S&P 500 going back to 1928. The bars show the average gain by month, while the diamond is the median return. The next two months historically see an average and median return that are well above the historical average.

It’s worth noting that the December’s average and median gain are relatively close together, which speaks to December's high win rate historically. Since 1950, December has the best win rate of any month.
Finally, despite the uncertainties around the outlook for monetary policy, the next rate cut appears locked in for now. Market-implied odds point to a 66% chance that the Fed cuts by another 0.25% at its last meeting of the year on December 18.
That’s just another factor supporting loose financial conditions overall, which reflects the cost and availability of credit. Financial conditions can serve as a headwind or tailwind for stock prices. As the S&P 500 made a peak in late 2021 ahead of the following year’s bear market, financial conditions were already trending tighter as you can see below.
A reading above zero represents tighter than average conditions, and below zero is looser than average. Conditions are currently running at their loosest level in nearly three years, and are still trending looser overall.
The combination of strong market breadth, positive historic seasonality, and loose financial conditions can help sustain the bull market into year-end. But looking ahead, accelerating inflation could deliver a major change in stock market leadership.
Now What…
Catalysts are aligning for a strong finish to the year for the stock market in general. But I believe reaccelerating inflation could drive a major shift in stock market leadership as we head into 2025.
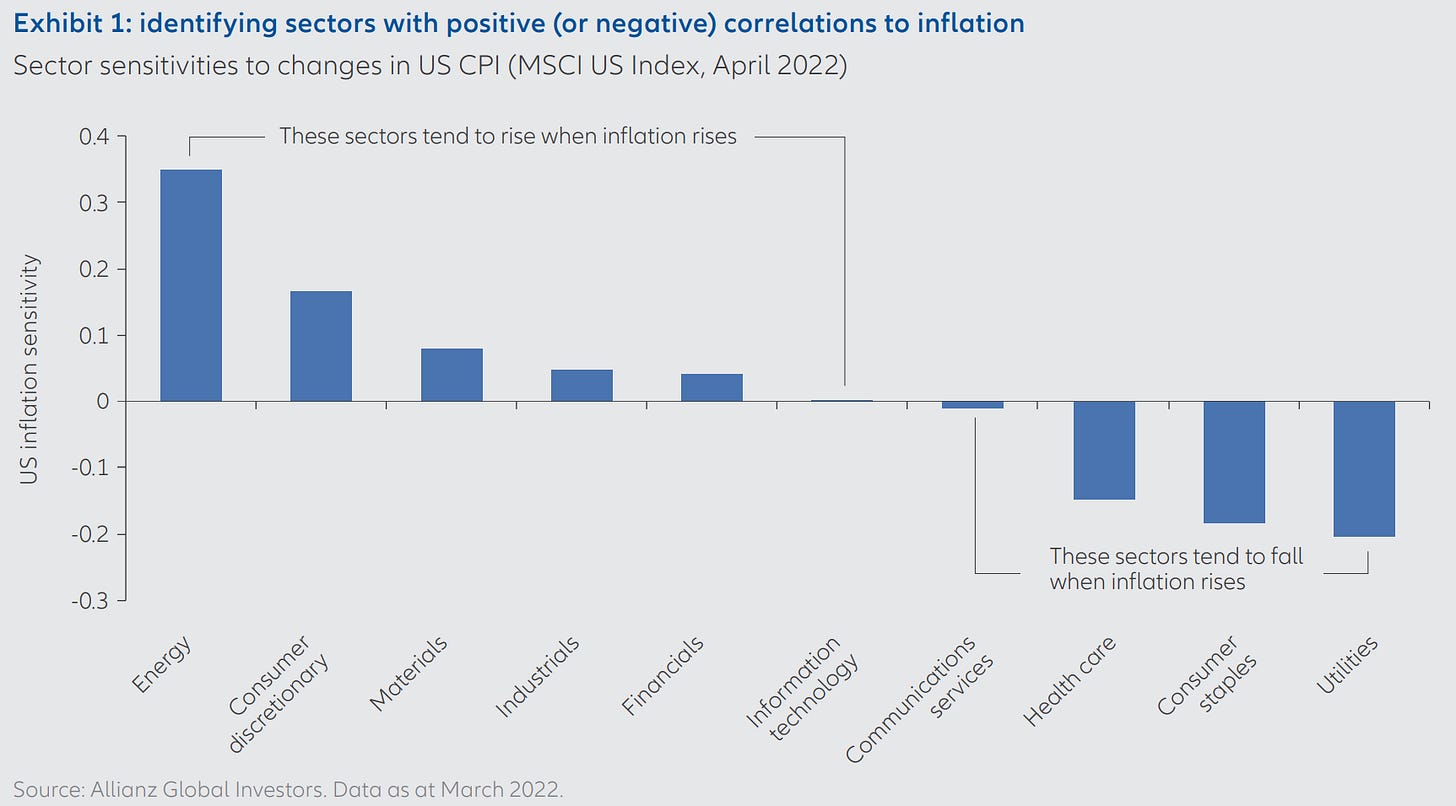
Recent sector performance is also confirming that rising inflation could lie ahead. Energy and consumer discretionary sectors are most highly correlated to rising inflation as you can see below.
Those are among the sectors and industries breaking out from major basing patterns in recent weeks, where I’ve alerted several trades to members of the Traders Hub. At the same time, weekly measures of momentum show that those uptrends could be in the very early stages.
That has significant implications on where to look for market leadership next year. For example, tech stocks are one of the worst sectors ranked by inflation-adjusted returns during periods of high and rising inflation.
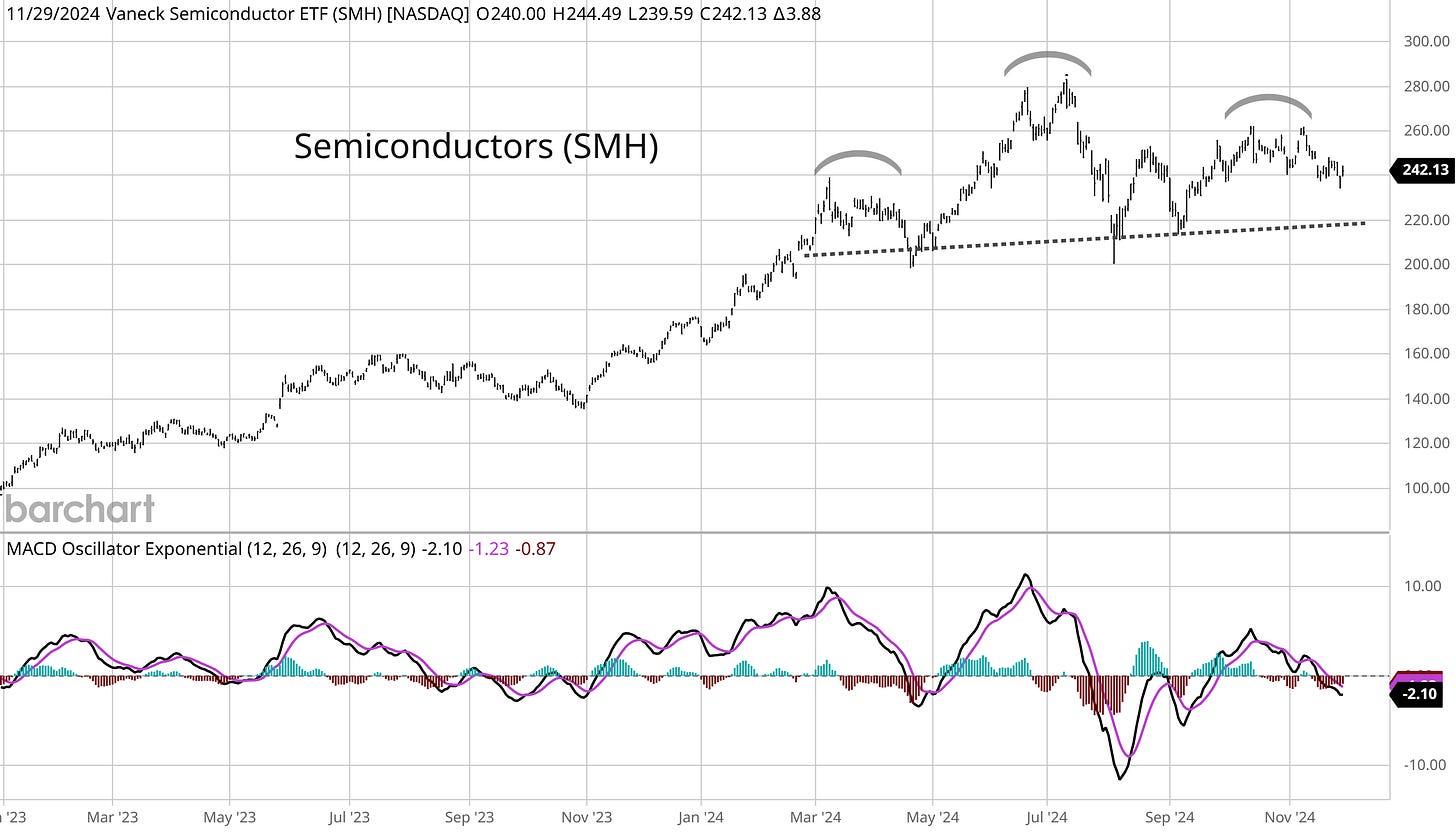
That makes it quite interesting that the VanEck Semiconductor ETF (SMH) has not made a new high with the S&P 500, especially since SMH previously led the way throughout this cyclical bull.
SMH remains below the July peak, and is potentially making a bearish head and shoulders pattern shown with the arches in the chart. In an ideal head and shoulders setup, the “right shoulder” should be below the left. It’s not in this case, but is still a pattern worth monitoring. A move below $210 would confirm that chip stocks are transitioning to a downtrend.
Meanwhile, commodities could be set up for a major rebound. The chart below shows the ratio of the S&P GCSI commodities index to the S&P 500. When the S&P 500 is outperforming commodities (represented by a falling line), that momentum trends for extended periods of time where the line in the chart grinds lower.
But when commodities see a jolt in performance, the sector tends to see a rapid mean-reverting move that sends the ratio quickly higher. You can see that with the spikes into 1990 and 2008. Commodities are among the strongest performing sectors of the capital markets during inflationary environments.
I’ll have more about my outlook for 2025 and the top sectors primed to perform in the coming weeks. I already have my focus list of stocks and ETFs prepared for members of the Traders Hub that I’m watching for the year ahead.
The Invesco DB Base Metals Fund (DBB) is one to keep on your watchlist. DBB holds industrial metals like copper, zinc, and aluminum. The weekly chart below goes back four years, with the shaded box showing the $22 resistance level to monitor for a breakout. More recently, DBB is testing that level several times since May and is making a bullish triangle continuation pattern since then.
That’s all for this week. The week ahead will feature several important economic reports, including the ISM report on manufacturing activity. We’ll also get the November payrolls report on Friday, which follows the unexpectedly weak figures from October. I’ll be keeping an eye on key sector performance, and what it says about the inflation outlook heading into next year.
I hope you’ve enjoyed The Market Mosaic, and please share this report with your family, friends, coworkers…or anyone that would benefit from an objective look at the stock market.
Become a member of the Traders Hub to unlock access to:
✅Model Portfolio
✅Members Only Chat
✅Mosaic Chart Alerts
✅Trade Ideas & Live Alerts
✅Mosaic Vision Market Updates + More
We’re alerting and tracking trades in our model portfolio, including Bitcoin and other cyclical sectors that are breaking out.
We recently locked in a 32% gain on a Bitcoin ETF in less than one month, and captured a 73% partial gain on a growth stock where the trailed position is now up triple-digits.
Our model portfolio is built using a “core and explore” approach, including a Stock Trading Portfolio and ETF Investment Portfolio. Come join us over at the Hub as we seek to capitalize on stocks and ETFs that are breaking out!
And if you have any questions or feedback, feel free to shoot me an email at mosaicassetco@gmail.com
Disclaimer: these are not recommendations and just my thoughts and opinions…do your own due diligence! I may hold a position in the securities mentioned in this report.


