The Market Mosaic 1.21.24
The right stock sectors are leading the way.
Welcome back to The Market Mosaic, where I gauge the stock market’s next move by looking at macro, technicals, and market internals. I’ll also highlight trade ideas using this analysis.
If you find this content helpful please hit that “like” button, share this post, and become a subscriber to this always free report if you haven’t already done so!
And be sure to check out Mosaic Chart Alerts. It’s a midweek update covering chart setups among long and short trade ideas in the stock market, along with levels I’m watching.
Now for this week’s issue…
Speakers from the Federal Reserve are keeping investors on their toes. Over a month ago, it was Fed Governor Christopher Waller’s unexpected dovish tone that helped set the table for interest rate cuts this year.
However just last week, Waller tempered expectations by saying the central bank can take their time to do it right.
Others echoed views that Wall Street is expecting too many rate cuts and too soon. For instance, Atlanta Fed President Bostic is targeting the third quarter for the first round of rate cuts.
Following remarks from various Fed speakers last week, market implied odds for a March rate cut dropped sharply to 46% from 77% the week before (chart below). There is also one less rate cut being priced in for the year.
Trying to follow and interpret the qualitative messaging from Fed speakers has become its own economic sideshow and captured plenty of headlines last week. But despite the attention lobbed at the Fed, that wasn’t the most important economic development last week.
In my opinion, the most important data point belongs to Taiwan Semiconductor (TSMC), and is flying under most investors’ radar.
TSMC is a semiconductor bellwether and reported fourth quarter earnings last Thursday. TSMC reported sales and earnings per share ahead of expectations, but it was the company’s outlook that drove its stock price out of a six month basing pattern (chart below).
Regardless of Fed speculation and when 2024 will see its first rate cut, TSMC’s guidance provides another glimpse into the key catalyst needed to keep the stock market’s rally going.
More Positive Signals for the Economy
TSMC is a semiconductor foundry making chips for customers like Apple and Nvidia. They account for 58% of global chip making capacity, and their chips go into everything from consumer electronics to vehicles.
Given the growing electronic content in everything from smartphones to cars, tracking chip stocks as an economic indicator is similar to using transportation stocks to take the temperature of the economy. That means TSMC has a front row seat to developments with the global economy.
And in their release, the company now expects revenues to increase by more than 20% in 2024. Keep in mind that TSMC generated $69 billion in revenue in 2023. Moving that amount by more than 20% is no easy task unless demand trends are strong.
And it’s not just TSMC sensing improving demand trends. Chip sales growth across the global industry (chart below) just went positive for the first time in 14 months…another sign of an improving rate of change showing up in other economic indicators that I highlighted here.
And TSMC was hardly the only company with a notable earnings report last week. Industrial products giant Fastenal (FAST) saw its stock jump to new all time highs after reporting fourth quarter results. The company specifically highlighted manufacturing end markets doing well in its press release.
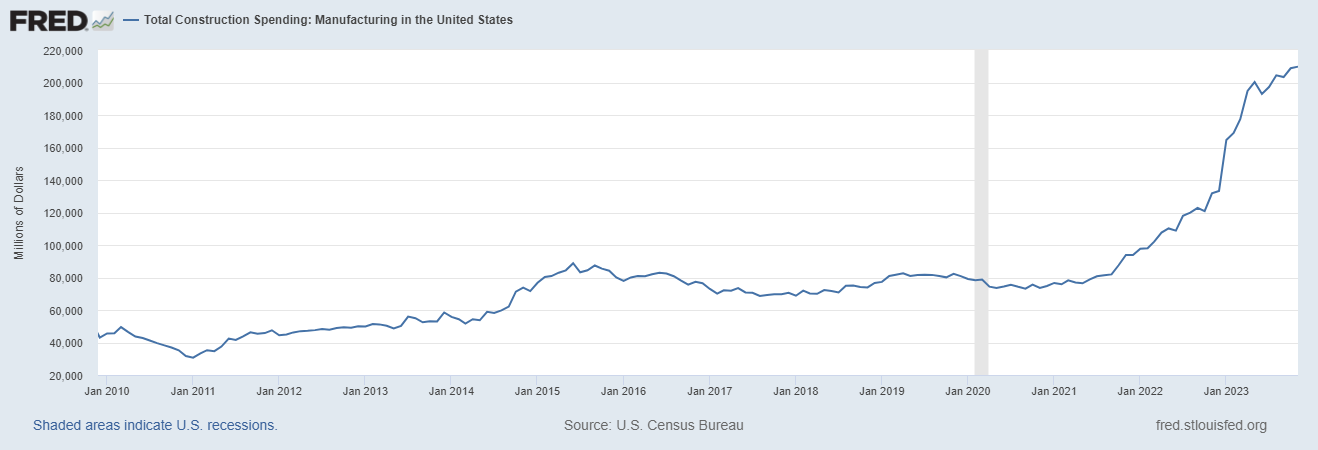
They should be benefiting from the massive boom in construction spending across the manufacturing sector (chart below) that’s making its way through the economy. More than $2 trillion in federal spending coming from bills like the Infrastructure Investment and Jobs Act and CHIPS Act are making their way into the broader economy via construction spending.
It is yet more evidence that economic growth could be set to accelerate despite prevailing talk around recession. Economic growth is central to my current view that an ongoing earnings recovery will support new highs in the S&P 500.
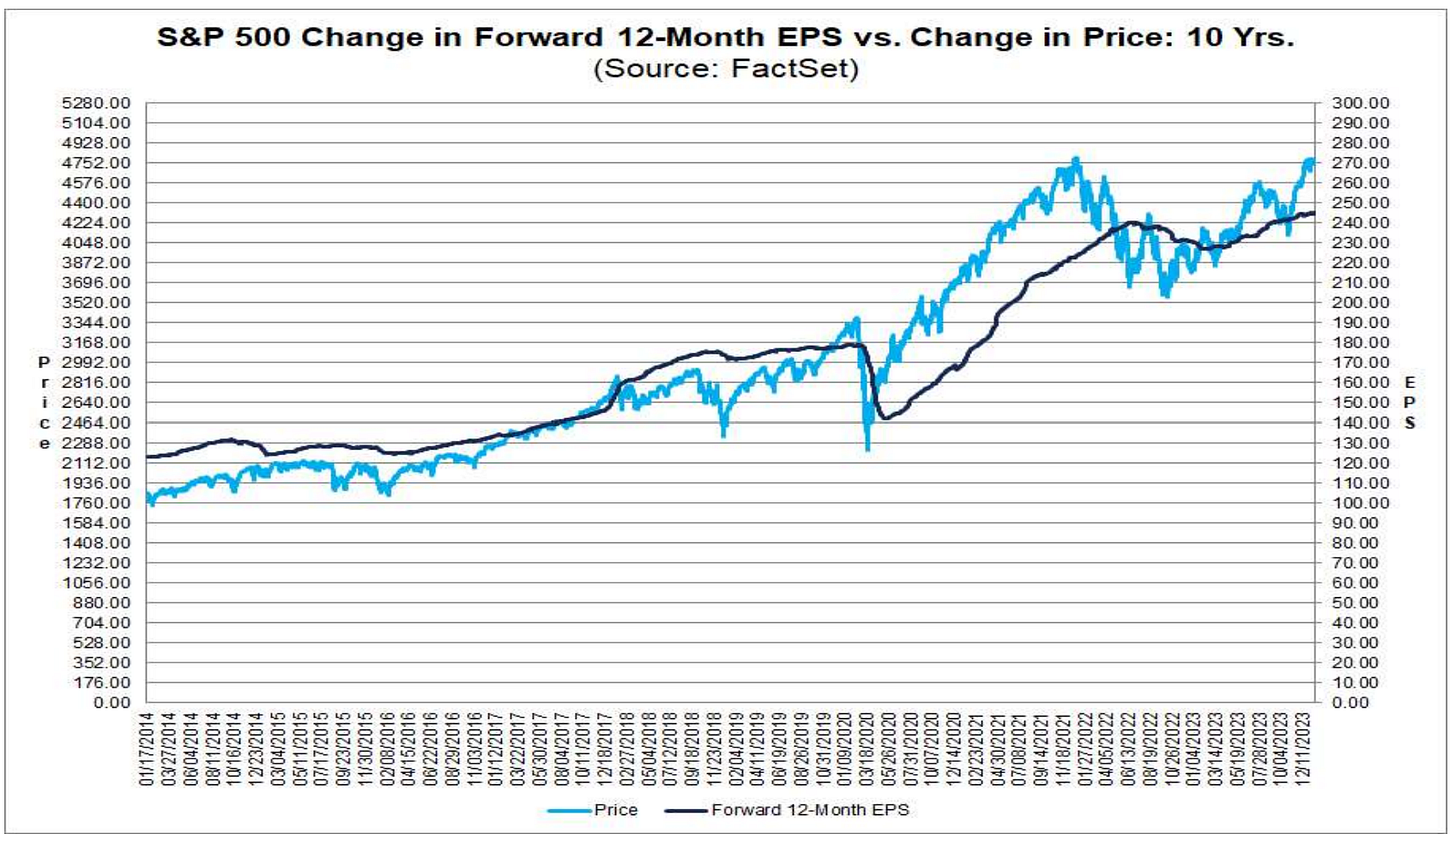
Going into this earnings season, forward earnings estimates were already moving to new high ground as you can see below…ahead the the S&P’s breakout last week.
As companies update earnings guidance based on the current dynamics of their respective end markets, that shows up in earnings estimates put out by analysts following these companies. More signs of recovering forward estimates are needed to keep the bull market going.
Now What…
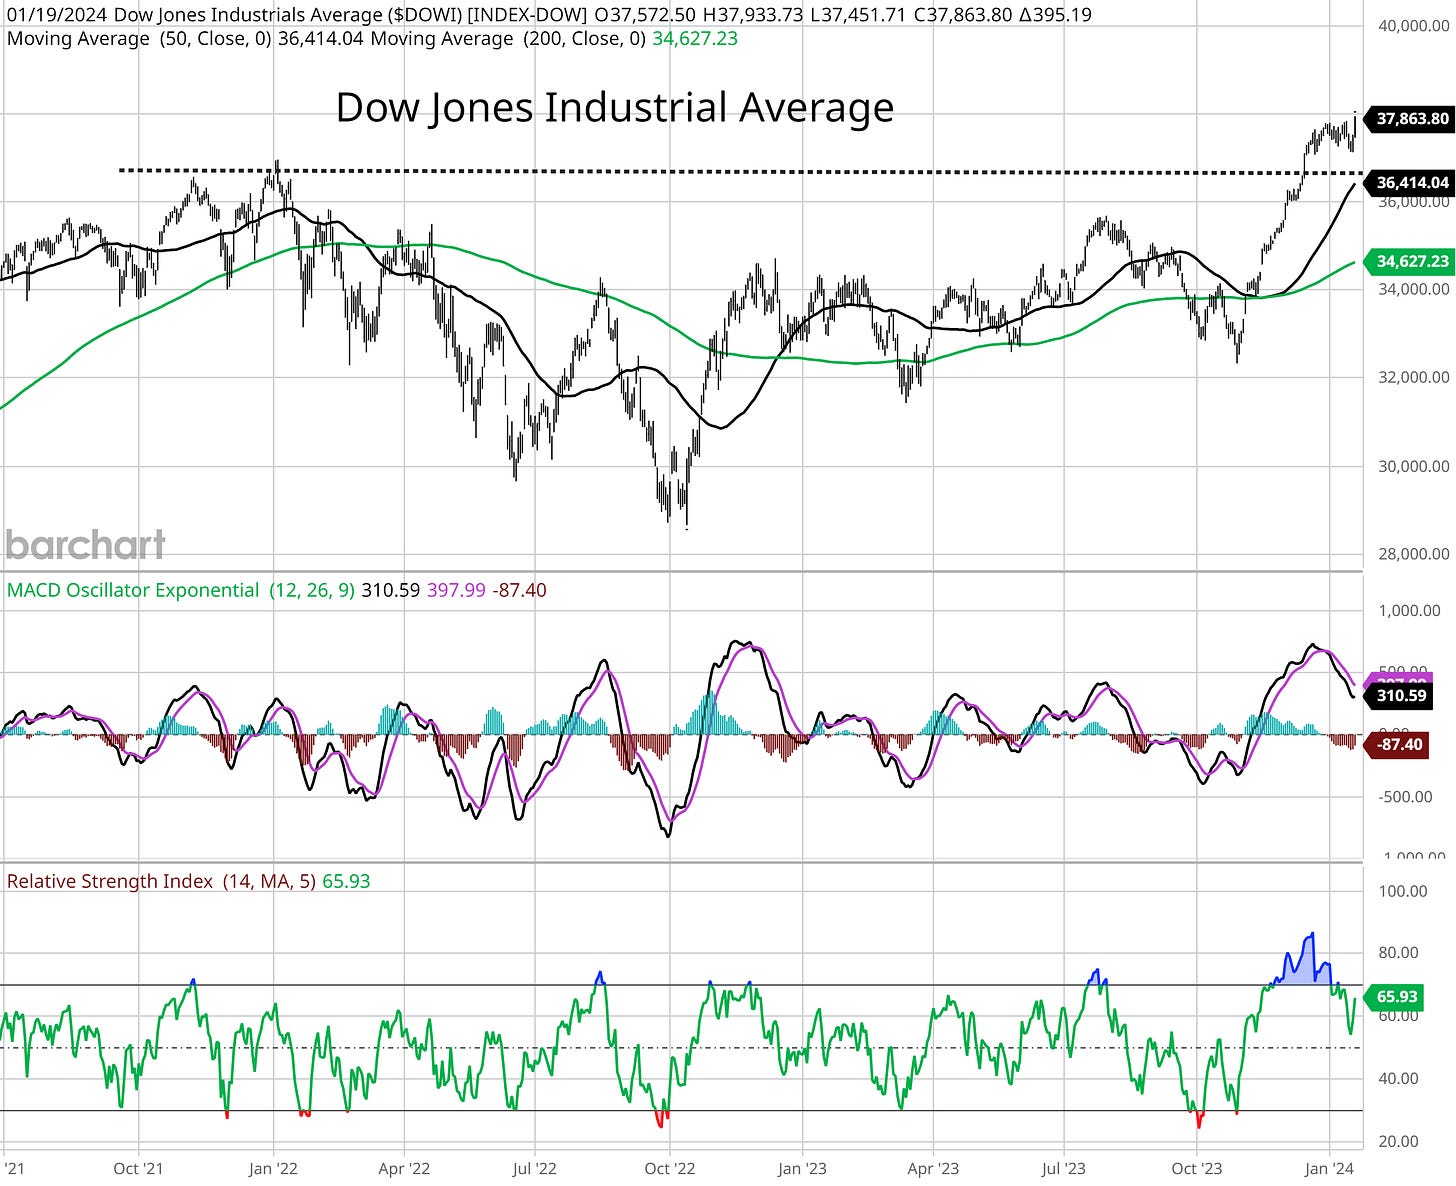
Many seem surprised by the S&P 500’s jump to new all time highs on Friday. But forward earnings estimates are pointing the way higher and the S&P is hardly the first major index getting there. The Dow broke out to new highs back in December, and after trading in a tight range for the past month is making new highs again (chart below).
Breadth still remains a concern right here. Recently I’ve been highlighting the percent of stocks across the market trading above their 20-day moving average. While that metric is near oversold levels, it still only stands at 35% despite new highs for the S&P. That largely reflects the bigger pullback and underperformance of small-cap stocks since late December.
And while the S&P 500 was breaking out to new highs on Friday, the number of stocks making net new 52-week highs actually finished in negative territory the same day. That’s another sign of narrow leadership on this most recent move higher.
I’m not arguing that stocks have to pull back from these levels, or that the breakout in the S&P 500 is somehow unjustified. After all, I value price action above all else. But the breadth trends under the hood still bear close monitoring especially as bullish sentiment is quickly reversing higher.
Despite the near-term breadth divergences, I’ve maintained that the outlook for the economy and stock market remains solid based on signals from various corners of the capital markets. As TSMC’s report and stock price reaction shows, the right sectors are still leading the way.
And when I updated my chart scans on Friday, there are many bullish tight continuation flags forming in cyclical stocks. Like with homebuilding supply stock Builders FirstSource (BLDR). You can see in the chart below that BLDR is trading in a tight range after moving to new highs in December. Many stocks across the homebuilding industry feature a similar pattern.
I’m also following the action in several transport stocks, like with trucking company SAIA (SAIA). The stock has tested resistance near the $450 area several times since July, and is making a series of higher lows since October. A breakout would just add to the list of cyclical stocks putting in favorable moves.
That’s all for this week. The coming week will see the pace of earnings reports pick up, with companies like IBM and Intel reporting results. I will be watching to see if other semiconductor and manufacturing companies are forecasting similar trends as TSMC and Fastenal, and how the overall earnings outlook evolves. I’ll also be tracking if breadth trends can improve following the S&P 500’s breakout.
I hope you’ve enjoyed The Market Mosaic, and please share this report with your family, friends, coworkers…or anyone that would benefit from an objective look at the stock market.
And make sure you never miss an edition by subscribing here:
For updated charts, market analysis, and other trade ideas, give me a follow on X: @mosaicassetco
And if you have any questions or feedback, feel free to shoot me an email at mosaicassetco@gmail.com
Disclaimer: these are not recommendations and just my thoughts and opinions…do your own due diligence! I may hold a position in the securities mentioned in this report.


