


The Market Mosaic 12.10.23
Did the stock market rally go too far, too fast?

Welcome back to The Market Mosaic, where I gauge the stock market’s next move by looking at macro, technicals, and market internals. I’ll also highlight trade ideas using this analysis.
If you find this content helpful please hit that “like” button, share this post, and become a subscriber to this always free report if you haven’t already done so!
And be sure to check out Mosaic Chart Alerts. It’s a midweek update covering chart setups among long and short trade ideas in the stock market, along with levels I’m watching.
Now for this week’s issue…
Even after the November payrolls report showed a larger than expected addition of 199,000 jobs during the month, investors are holding steady in their view that the first rate cuts by the Federal Reserve are coming soon.
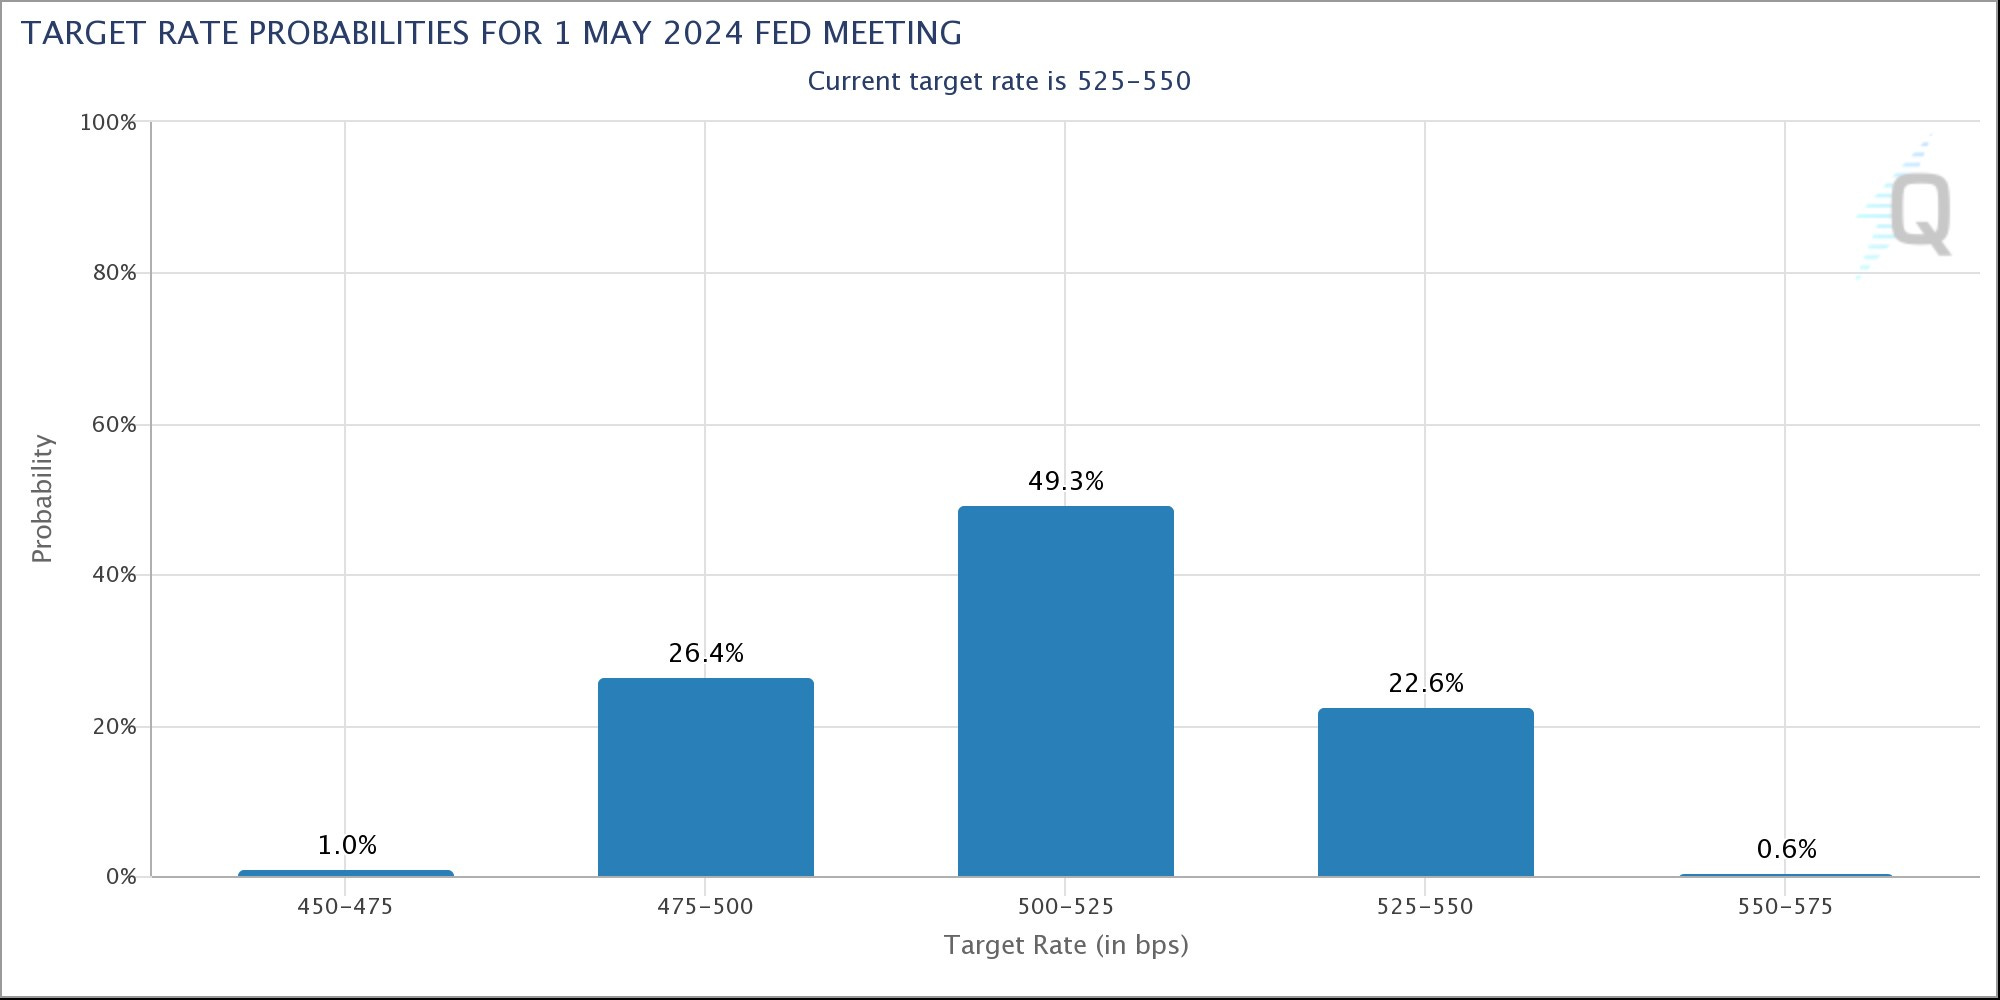
Market-implied odds for a rate cut at the Fed’s March meeting are still running at 45%. And there’s a 77% chance that rates will be lower at the Fed’s May meeting compared to current levels (chart below).
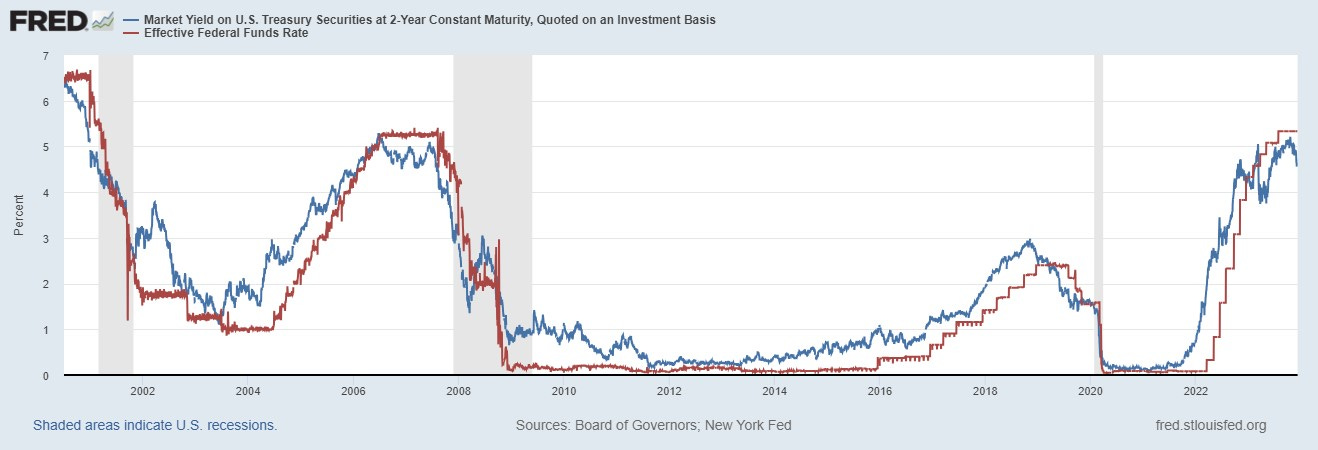
The 2-year Treasury yield, which is often a leading indicator of the fed funds rate, has pulled back to 4.58%. The chart below shows the 2-year yield (blue line) overlaid with fed funds (red line) for the past 20 years. Even longer-dated yields have continued pulling back, with the 10-year Treasury yield down to 4.24% after touching 4.99% in October.
The week ahead will offer plenty of clues if the market is correct to price rate cuts happening sooner. Next week features the last Fed rate-setting meeting of the year, followed by a press conference with Fed Chair Powell.
Investors will also receive key inflation reports, with the Consumer Price Index (CPI) for November coming out the day before the Fed’s interest rate decision. The Producer Price Index (PPI) comes out the day the Fed concludes their meeting.
But with the pullback bond yields and expectations for a Fed pivot to cutting rates early next year, more speculative areas of the stock market that are sensitive to changing rate outlooks are rallying.
Since the stock market started rallying in October, more speculative sectors are leading the way. Like with the IWO small-cap growth ETF, and the IPO ETF that tracks new stock issues coming to the market (chart below). Plus Bitcoin has rallied 75% in just the last three months.

Falling yields and rallying stocks are quickly shifting investor attitudes. That investor enthusiasm is also showing up in key figures of sentiment.
Going into a pivotal week, gauges of investor sentiment are now approaching bullish extremes…indicating a quick shift to greed and away from the fear that coincided with late October’s rally.
Does a quick shift in investor sentiment mean the stock market rally went too far, and too fast? Here’s how how I track sentiment, and how it relates to the stock market’s trend.
Tracking the Investor Mood of Investors
With the S&P 500 erasing a three month long correction of 10% in just three weeks, a sense of euphoria has overcome the stock market.
That has many questioning whether the rally since late October has gone too far and too fast, with another pullback needed to clear out speculative excesses.
After all, conventional wisdom says you should fade the extremes. Perhaps Warren Buffett put it best when he said that you should “be fearful when others are greedy and to be greedy only when others are fearful.”
There are many ways to gauge the mood of investors and if those fearful or greedy emotions are taking hold. There are market-based indicators, surveys that ask about investor outlooks, and metrics that track how professional investors are positioning their own portfolios.
CNN’s Fear & Greed Index is comprised of market-based metrics, like the Volatility Index (VIX) and high-yield spreads to track if investors are becoming greedy or fearful. After touching extreme fear territory in October, the Fear & Greed Index has quickly swung back to greed as you can see below.

Surveys are also reflecting a rise in investor bullishness. The American Association of Individual Investors (AAII) conducts a survey every week of its members, which are mainly retail investors. In the most recent survey, retail investors with a bullish outlook hit 47%. That compares to a historical average of 37%, and is a quick jump from 24% at the start of November. The spread between bull and bears is also near the highest levels of the past year (chart below from AAII).

We can also track positioning of so-called professional investors. For instance, you can track open interest of stock index futures. Hedge funds and commodity trading advisors (CTAs) utilize futures to position for directional moves in stock indexes or to hedge a bet. Extremes in positioning can often mark key turning points in market direction.
The National Association of Active Investment Managers (NAAIM) also asks fund managers about positioning in their investment portfolios, which is turned into an index. The most bearish positioning of the past two years marked the October 2022 bottom in the S&P 500, while the most bullish readings coincided with late July’s peak.
Their most recent index value of 76 is near the high end of the range as you can see below. Those positioning surveys show even the pro’s are susceptible to their own emotions, and get it wrong at key turning points.

With various gauges of investor sentiment becoming exceedingly bullish, the question now becomes if the rally since late October has gone too far and sucked in everyone who could buy. Here’s how I put sentiment indicators into context, and what it means for the stock market now.
Now What…
While investor sentiment features heavily in my stock market analysis, I don’t view it in isolation. My process focuses on the intersection of investor sentiment, the stock market’s trend, and participation in that trend (breadth)…my market mosaic.
Investor sentiment can hit extremes, and stay there for longer than you think. Like during 2021’s rally when the proportion of AAII bulls remained at high levels for much of the year. Or during 2022’s bear market when the proportion of AAII bulls stayed at a low reading for months (chart below).

In my opinion and experiences, breadth is key when interpreting the message coming from sentiment. When investor fear or greed are approaching extreme levels and breadth divergences appear…those are the ingredients for a powerful signal.
I outlined the bearish sentiment and bullish breadth divergences at the end of October here. Those divergences gave way to breadth thrusts, and now we’ve seen a more persistent regime of net new 52-week highs across the stock market.

I’m watching for negative divergences as a reason to become cautious, especially with the level of bullish investor sentiment. But as long as strong breadth figures accompany the rally, then the trend can continue regardless of investor sentiment or next week’s economic headlines.
I also wrote last week about the signal coming from stock market sectors that often serve as leading indicators. That includes semiconductors, where the action continues developing favorably in my opinion.
Heavy-weights in the space like Nvidia (NVDA) and Advanced Micro Devices (AMD) get most of the attention. But other stocks in the sector are developing favorable breakout setups as well.
That includes Rambus (RMBS) that is recently testing resistance at the prior high around $70. The MACD became extended on that test, which led to a small retracement of the rally since October. That's resetting the MACD back at the zero line, and I’m now watching for a breakout over $70.

That’s all for this week. You’ll probably start hearing a growing chorus of calls for a selloff given elevated levels of bullish investor sentiment. Next week’s macro events can certainly drive volatility as well. But instead of getting caught up in every headline or anticipating every economic report, you can achieve much clarity by just focusing on the price action in the stock market instead.
I hope you’ve enjoyed The Market Mosaic, and please share this report with your family, friends, coworkers…or anyone that would benefit from an objective look at the stock market.
And make sure you never miss an edition by subscribing here:
For updated charts, market analysis, and other trade ideas, give me a follow on Twitter: @mosaicassetco
And if you have any questions or feedback, feel free to shoot me an email at mosaicassetco@gmail.com
Disclaimer: these are not recommendations and just my thoughts and opinions…do your own due diligence! I may hold a position in the securities mentioned in this report.