
The Market Mosaic 11.9.25
The Most Hated Bull Market Ever?

👋Welcome back to The Market Mosaic, where I gauge the stock market’s next move by looking at macro, technicals, and market internals. I’ll also highlight trade ideas using this analysis.
If you find this report helpful please hit that “like” button, share this post, and become a subscriber if you haven’t already done so!
🚨And be sure to check out Mosaic Traders Hub. It’s a members-only platform to alert trade ideas, track a model portfolio of open positions, and further analyze the message coming from the capital markets (👇be sure to check out our special offer below).
Now for this week’s issue…
The partial federal U.S. government shutdown is now the longest in history, and there are concerns that the extended closure is taking a large bite out of the economy and leading to other disruptions.
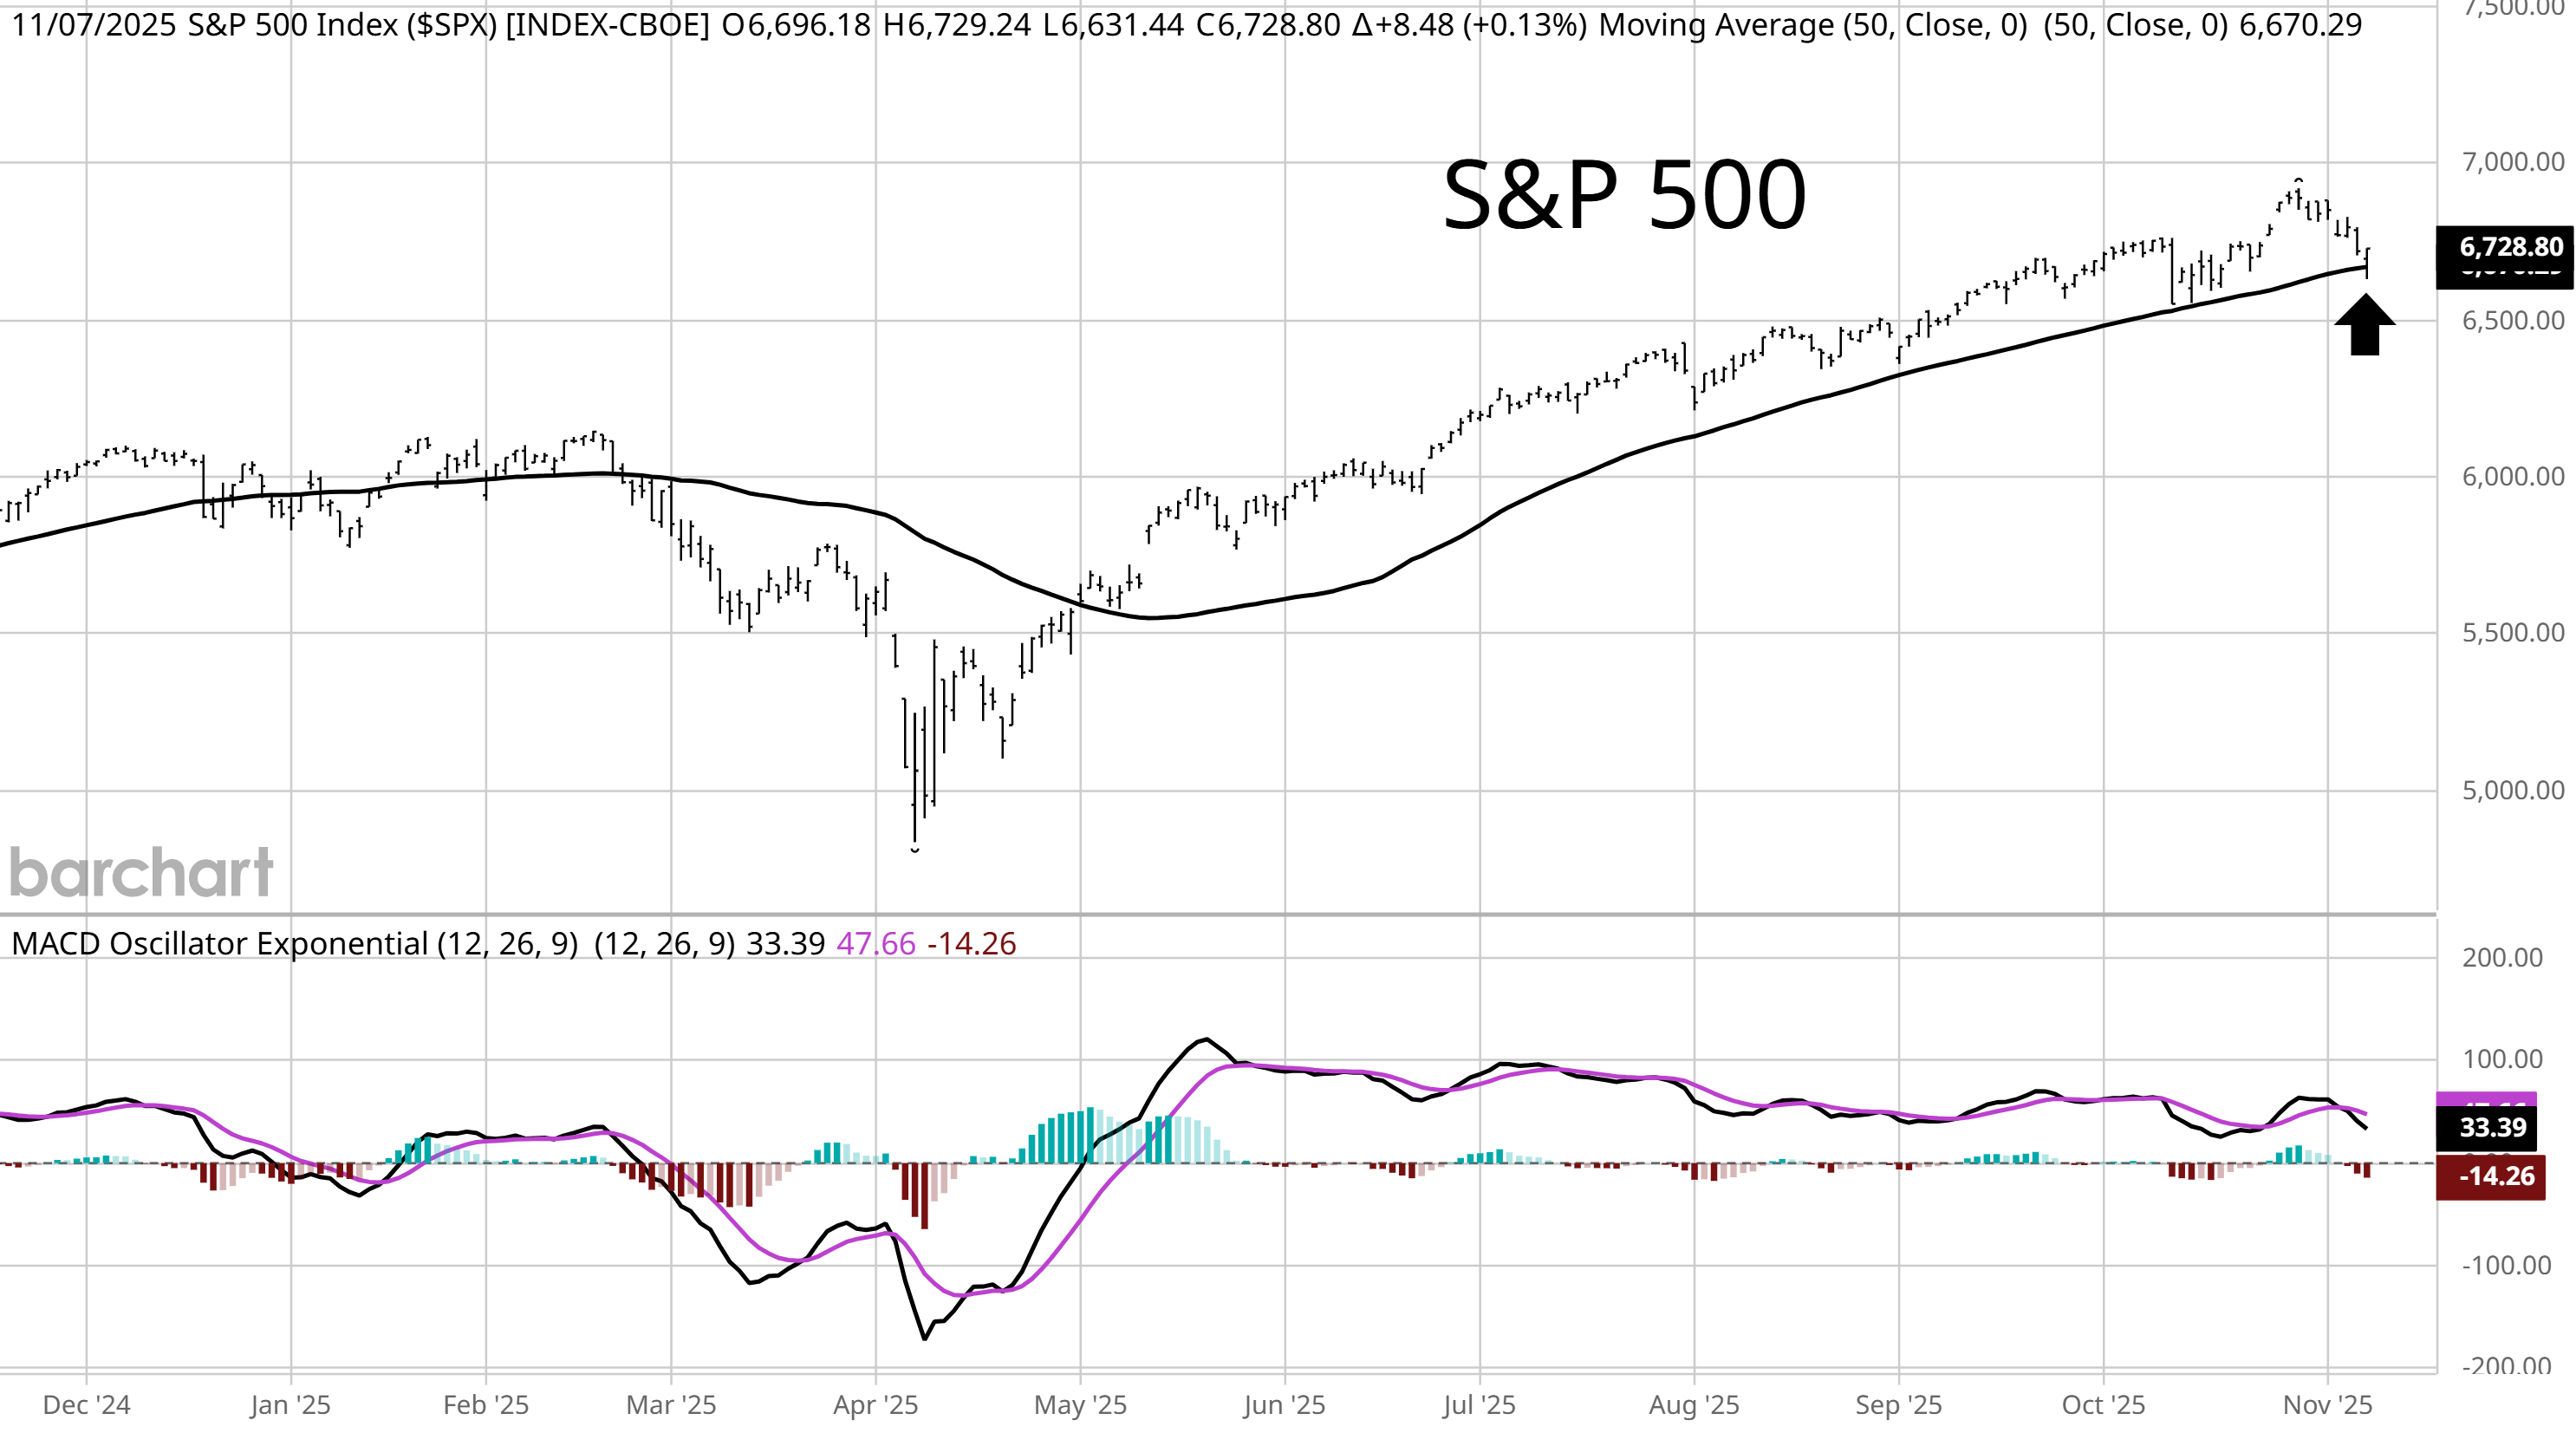
That’s causing an increase in stock market volatility. The S&P 500 is 2.4% off the highs made at the end of October, while the Nasdaq lost 3% on the week for its worst weekly showing since April.
The uptick in volatility also featured a rare test of the 50-day moving average (MA) by the S&P 500. While the S&P made an intraday move below the 50-day MA on Friday, a late day recovery was driven by speculation of a deal to reopen the government. That extends the S&P 500’s streak of 133 trading sessions above the 50-day MA.
While the impact of the government shutdown and speculation over its longevity is driving headlines, private sector data points to an economic backdrop that’s still supportive of the earnings outlook.
The ADP report on private sector payrolls showed the addition of 42,000 jobs in October, which was better than expected and compares to September’s loss of 29,000. Other reports covering activity in the manufacturing and services sector of the economy are showing improvements in leading indicators.
That includes a report from the Institute for Supply Management showing service sector activity expanding in October while the new orders component surged to 56.4. A reading above 50 indicates expanding activity, with new orders considered to be a leading indicator.
At the same time, conditions could emerge to support the rally into year end. Several measures of investor sentiment are pointing to excessive levels of fear, while market breadth is starting to approach oversold territory.
This week, lets unpack signs that the economy is holding up against the government shutdown, and the impact companies reporting earnings are reflecting in their outlook. We’ll also look at evidence that the “wall of worry” can drive the stock market higher, and why this might be the most hated bull market ever.
The Chart Report
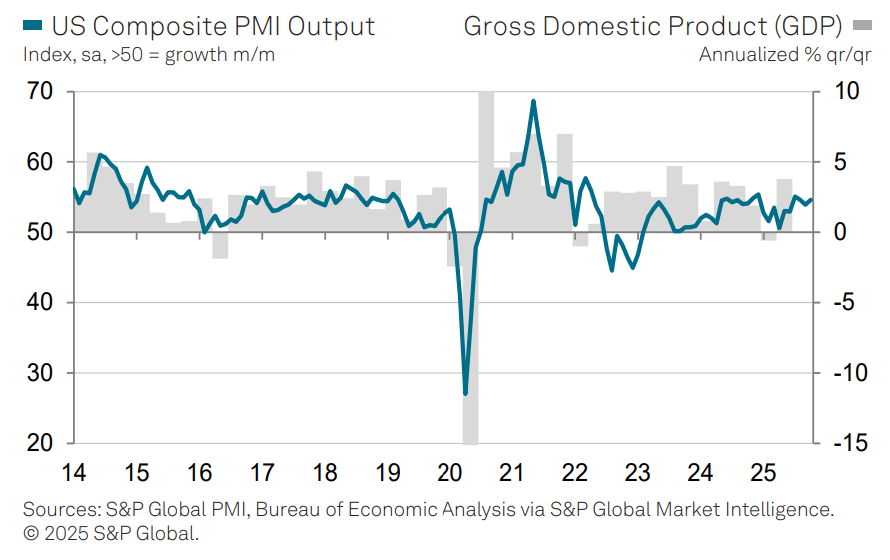
While economic data typically released by various U.S. government agencies is being delayed during the shutdown, private sector companies continue updating key metrics. In addition to the ADP report on private sector payrolls showing better than expected job growth in October, a report on manufacturing and service sector activity from S&P Global is holding near the highs seen over the last few years. S&P Global’s US Composite PMI is constructed so that a reading above 50 indicates expansion while below 50 points to contracting activity. The composite PMI rose to 54.6 last month from 53.9 in September (chart below) which was driven by increasing activity in both manufacturing and service sector output. That’s consistent with expanding GDP growth, which are the gray bars in the chart.
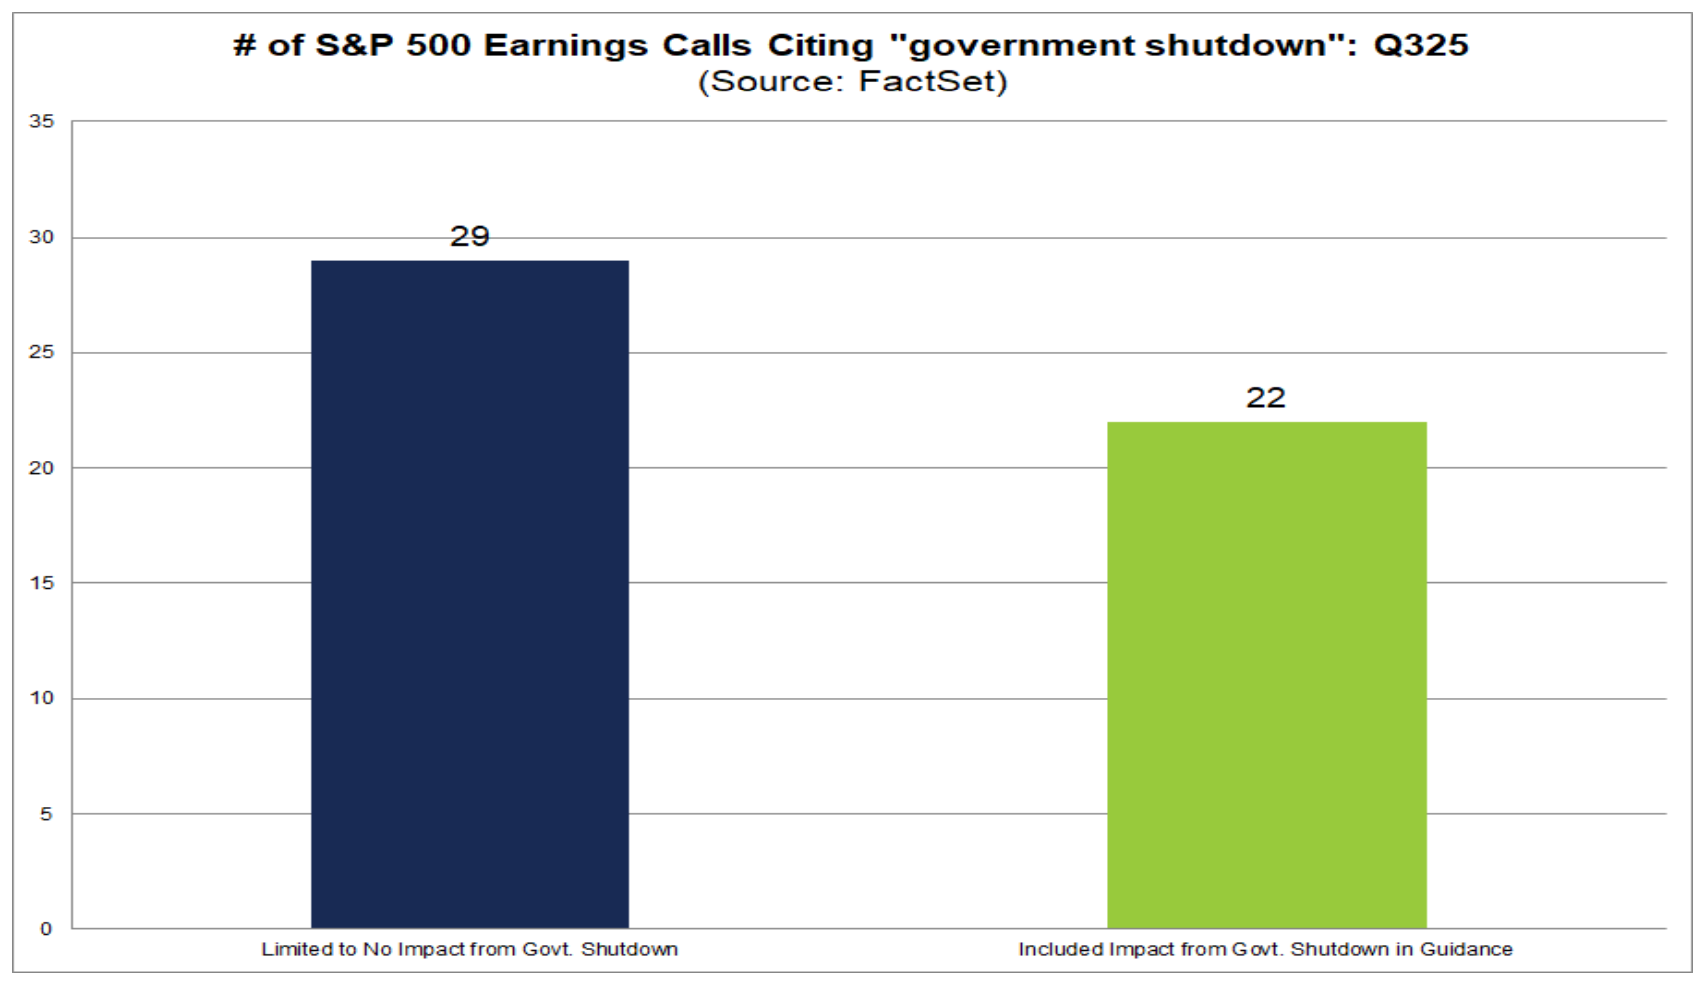
Estimates vary widely on the economic impact from the ongoing government shutdown, with forecasts ranging from $7 to $16 billion every week. There has also been a spike in mentions of the shutdown on S&P 500 earnings calls. There have been 76 companies mentioning the shutdown on their earnings call, which is in line with mentions during the last government shutdown in late 2018. Of the companies noting the shutdown, 22 included an impact or potential impact on guidance for the fourth quarter or full year. At the same time, 29 companies stated that they were seeing little or no impact from the shutdown on financial results (chart below).
While several PMI reports covering the manufacturing and services sector of the economy are evolving favorably for the outlook, the prices paid component continues to warn on inflationary pressures ahead. Prices paid measures changes in input costs and raw materials for services and manufacturing firms, and continues running at elevated levels. The ISM Services PMI showed the prices paid component rising to 70 in October, which is the highest reading since the last inflation wave in late 2022. The chart below overlays the ISM prices paid component (red line), which is shown with a six month lead, with the Consumer Price Index (CPI - white line).

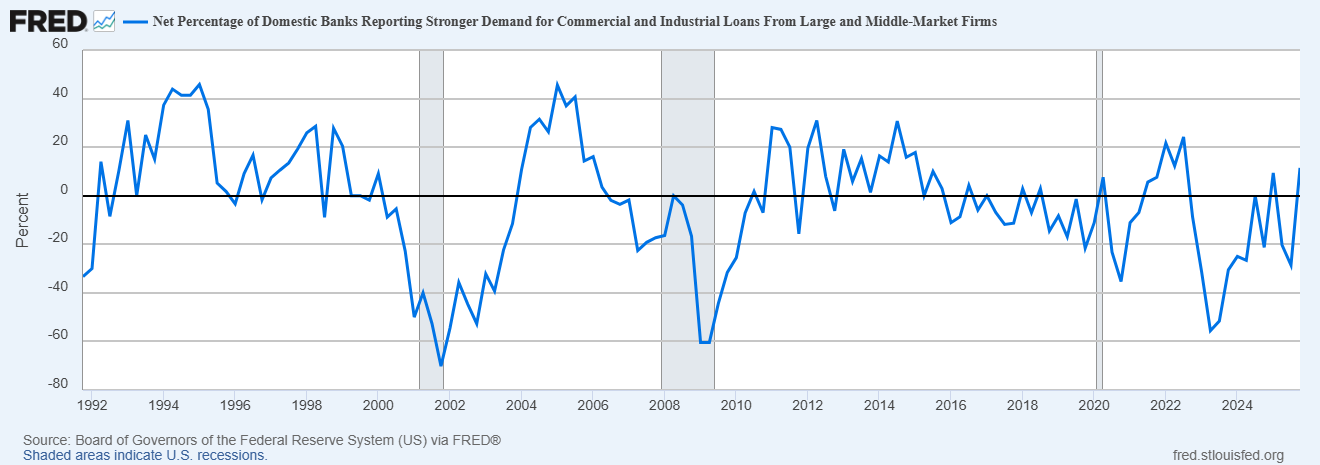
The past week saw an updated Senior Loan Officer Opinion Survey (SLOOS) on Bank Lending Practices, which a quarterly survey conducted by the Fed. The report gauges the appetite for credit by various businesses, and the willingness of banks to extend loans. The demand for credit is continuing to expand during this cycle, and is hitting the highest levels seen since 2022. The chart below shows the net percentage of domestic banks reporting stronger demand for commercial and industrial loans from large and middle-market firms. Following a sharp pullback during the last Fed tightening cycle into 2023, loan demand is hitting a new high for this cycle and could be supported further from loose financial conditions and recent rate cuts.
If the stock market climbs a “wall of worry”, then this recent leg of the stock market rally could be unprecedented in terms of investor fear relative to market gains. Despite the S&P 500 only being 2.4% off the high and trading above the 50-day MA for 133 consecutive days, CNN’s Fear & Greed Index currently sits in “extreme fear” territory. Additionally, the AAII’s survey of retail investors has seen those with bearish outlooks outnumber bullish outlooks during 11 of the past 22 weeks despite the relentless climb in the S&P 500 since the April lows. Over the full year, the spread between bulls and bears is running at -10.9%. A reading that low has only occurred during years featuring negative S&P 500 returns including 1990, 2008, and 2022 (chart below).

Heard in the Hub
The Traders Hub features live trade alerts, market update videos, and other educational content for members.
Here’s a quick recap of recent alerts, market updates, and educational posts:
A growing negative breadth divergence.
Why profit growth needs to drive the rally.
More evidence of strength behind earnings.
The constraining factor behind more rate cuts.
Why Tesla (TSLA) could be the next Mag 7 in the spotlight.
You can follow everything we’re trading and tracking by becoming a member of the Traders Hub.
By becoming a member, you will unlock all market updates and trade alerts reserved exclusively for members.
🚨Hub members recently locked in gains of 244.4% and 165.4%. Check out the special offer below to join the Hub today!
👉You can click here to join now👈
Trade Idea
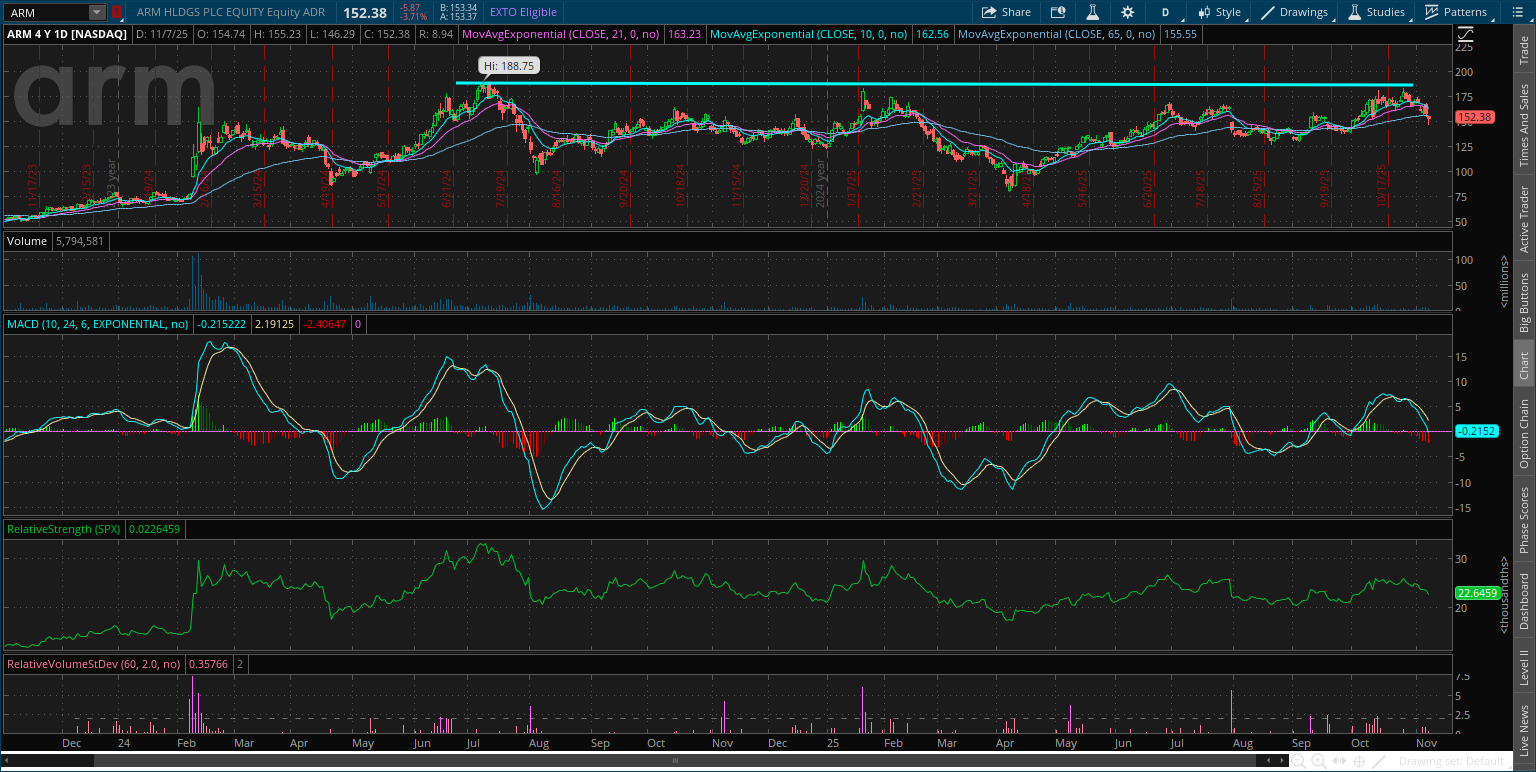
Arm Holdings PLC (ARM)
ARM could be the next semiconductor stock to see a massive breakout. The stock is making a smaller pullback after testing the prior highs around the $185 level. That’s creating a bullish MACD reset above the zero line. I’m watching for a breakout over $190.
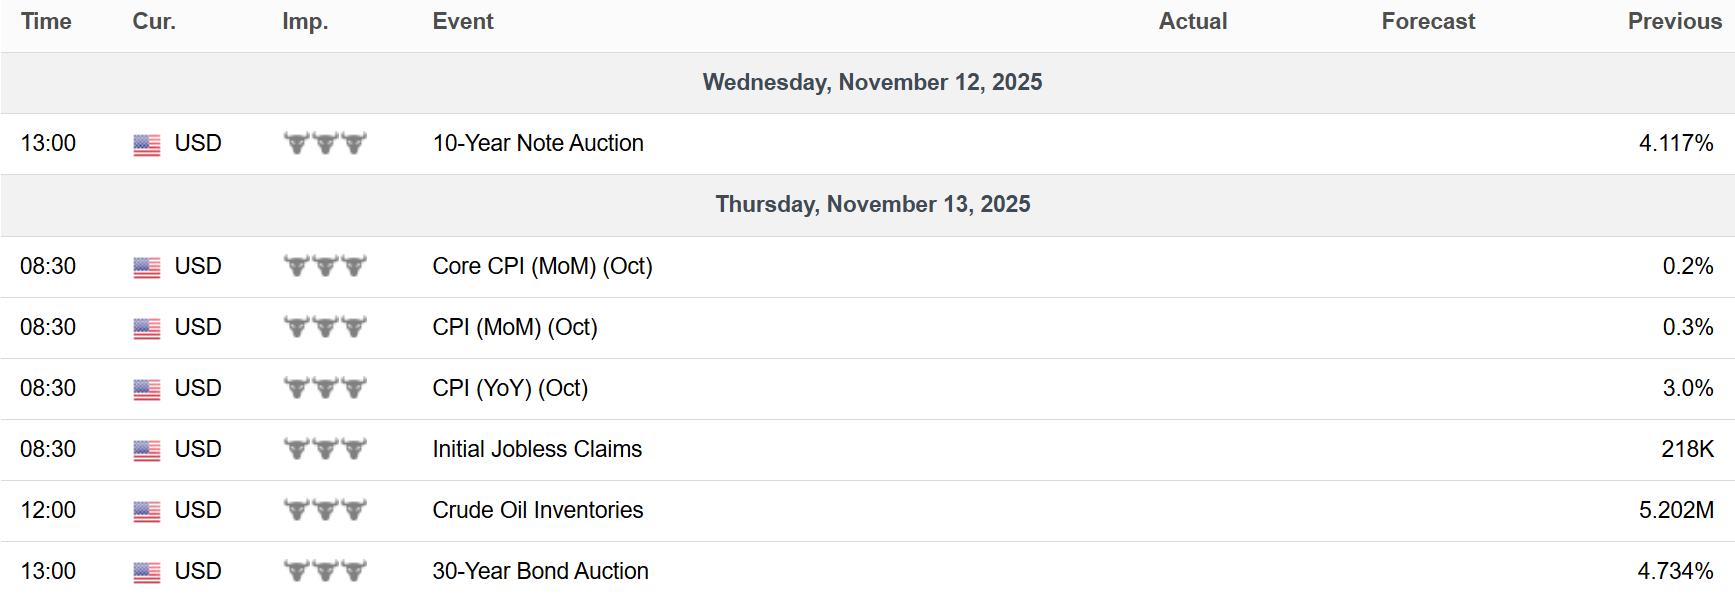
Key Upcoming Data
Economic Reports
Earnings Reports

I hope you’ve enjoyed The Market Mosaic, and please share this report with your family, friends, coworkers…or anyone that would benefit from an objective look at the stock market.
Become a member of the Traders Hub to unlock access to:
✅Model Portfolio
✅Members Only Chat
✅Trade Ideas & Live Alerts
✅Mosaic Vision Market Updates + More
Our model portfolio is built using a “core and explore” approach, including a Stock Trading Portfolio and ETF Investment Portfolio.
Come join us over at the Hub as we seek to capitalize on stocks and ETFs that are breaking out!
And if you have any questions or feedback, feel free to shoot me an email at mosaicassetco@gmail.com
Disclaimer: these are not recommendations and just my thoughts and opinions…do your own due diligence! I may hold a position in the securities mentioned in this report.