
The Market Mosaic 1.18.26
S&P 500: Mag 7 Stumbles While the Average Stock Powers Ahead.

👋Welcome back to The Market Mosaic, where I gauge the stock market’s next move by looking at macro, technicals, and market internals. I’ll also highlight trade ideas using this analysis.
If you find this report helpful please hit that “like” button, share this post, and become a subscriber if you haven’t already done so!
🚨And be sure to check out Mosaic Traders Hub. It’s a members-only platform to alert trade ideas, track a model portfolio of open positions, and further analyze the message coming from the capital markets.
Now for this week’s issue…
Geopolitical risks are flaring up once again, which is igniting a fresh round of tensions and delivering new threats of tariffs and the trade war.
Following President Trump’s move to implement a new round of tariffs on European nation’s opposing his desire to acquire Greenland, the European Union is hitting back by threatening to scrap the trade deal reached with the U.S. following last spring’s trade war.
While investors will be fixated on the prospect for rising volatility around tariff and geopolitical headlines this week, the recent market action has remained extremely bullish to start the year.
Small-cap stocks are on a notable win streak against large-caps, cyclical sectors are building on breakouts, while measures of the average stock continue making fresh record highs.
The cumulative NYSE advance/decline line in the chart below is one way to track the performance of the average stock, and is near record highs following a breakout from a basing period that lasted from September into the start of the new year.
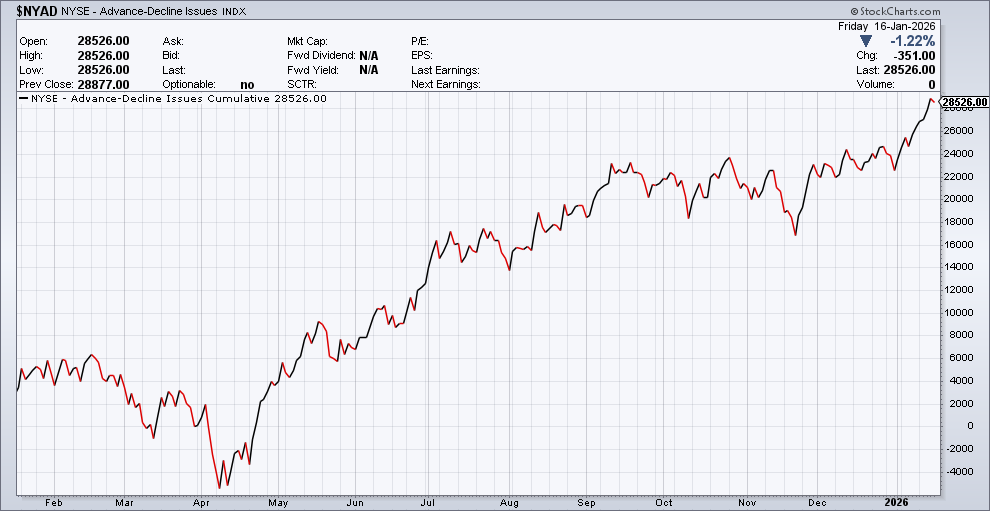
That’s a notable change of character in the stock market, where past leadership has been concentrated in mega-cap stocks leveraged to the artificial intelligence (AI) theme. Several of those stocks remain well below their record highs which is weighing on the major indexes.
Another key development over the past week has been on the commodity front. While gold and silver keep garnering all the investor attention, a recent breakout in broader commodity indexes has massive implications for the inflation outlook.
This week, I want to look at the strong start to the year for the average stock and a key factor driving the performance. I also want to take a look at the S&P 500’s path during mid-term election years, and the breakout in commodities that you should watch carefully.
The Chart Report
A strong start to 2026 for the average stock is sending small-cap stocks on a historic win streak. The Russell 2000 Index of small-caps has outperformed the S&P 500 for 10 consecutive days (bottom panel in the chart below) which is the longest streak since 1990. But there could be much more relative upside for small-caps relative to large-caps. The top panel in the chart below shows the relative price ratio, where small-caps are recently trading at their cheapest level to large-caps since the peak in the internet bubble during the late 1990s.

While relative price valuations show that small-caps are cheap, an accelerating domestic economy could deliver an earnings boost as well. Small-caps derive a larger share of their revenues and earnings from the domestic economy relative to the S&P 500, where around 40% of S&P sales comes from international sources. Recent GDP figures show strong growth, with the third quarter figure reported at 4.3% annualized and an estimate for the fourth quarter running at 5.3%. Strong growth could persist as pressure to onshore key industries and the data center buildout is fueling a capex boom. The chart below shows the year-over-year change in capex shipments and new orders accelerating over the past two years.

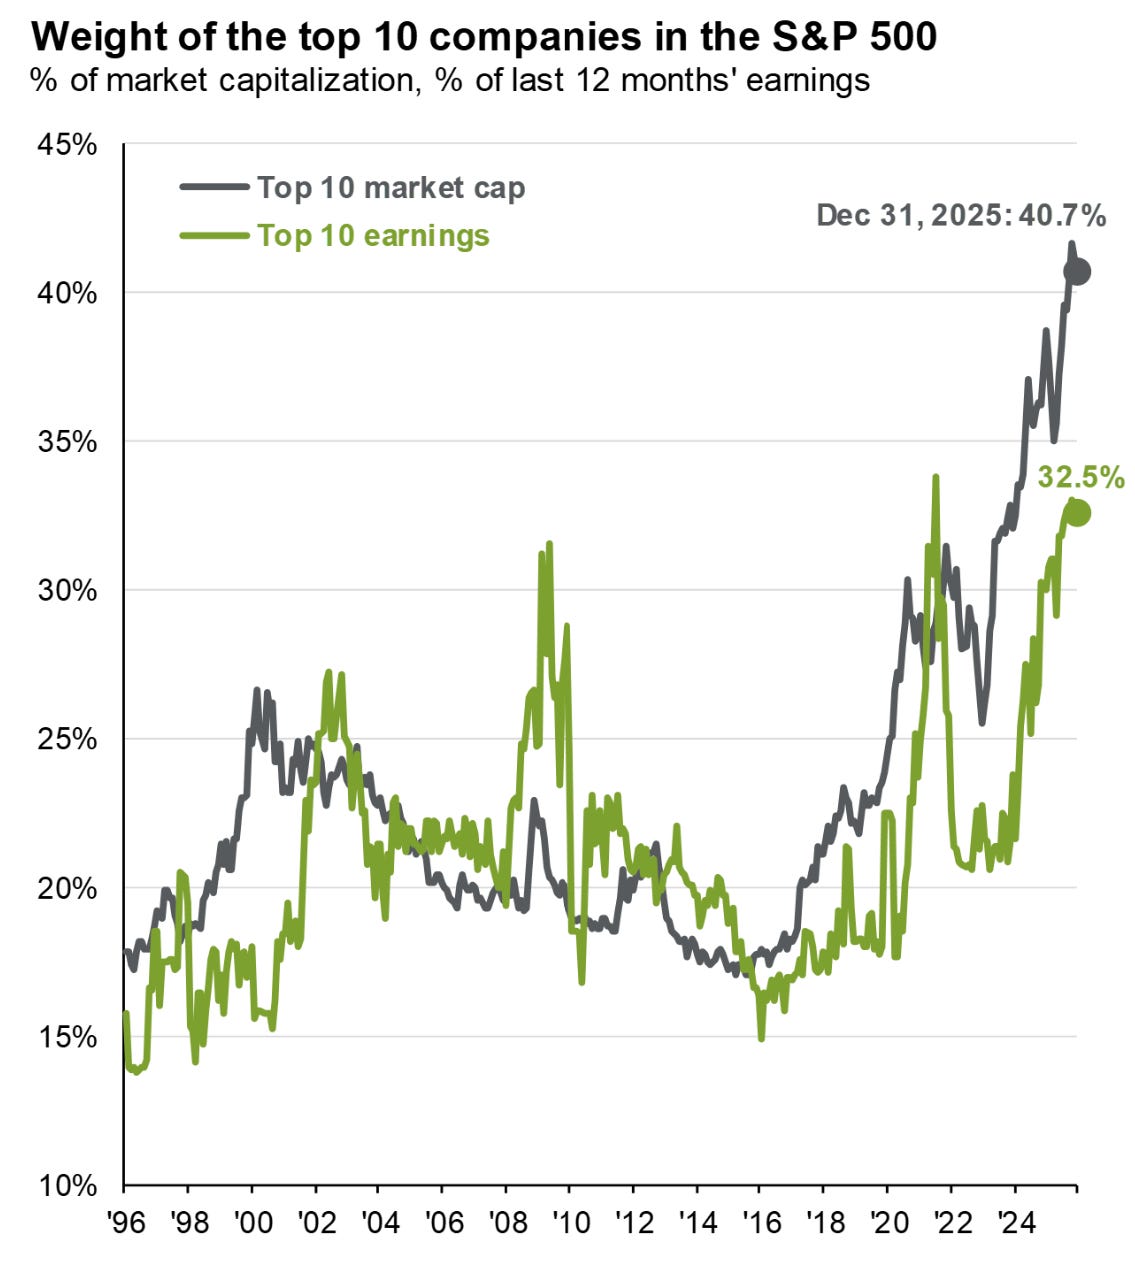
While small-caps are on a winning streak relative to the S&P 500, lagging performance in just a handful of stocks can significantly impact large-cap returns. Many members of the Magnificent 7 leveraged to the AI trade are recently struggling and remain well below their prior highs. Microsoft (MSFT) is currently 16% off the October peak while Meta Platforms (META) is 22% below the highs seen last summer. If the biggest names in the market are lagging, that could weigh on the broader cap-weighted indexes due to concentration. The top 10 stocks in the S&P 500 make up a record 41% of the index at the end of 2025, while their earnings contribution comprised about 32% of the total (chart below). Trying to gauge the broader performance of the stock market using popular cap-weighted indexes is difficult when concentration is running at record levels.
The S&P 500 is susceptible to recurring seasonal patterns over a variety of time intervals. Some months are known for posting large average returns with a high win rate, while periods like the “sell in May and go away” six-month stretch is associated weakness. We can also track how the S&P 500 tends to move during the four year election cycle. The chart below plots the average price movement in the S&P depending on the year in the election cycle (i.e. election year versus midterms). This cycle has tracked fairly well this time around when you consider trend and key turning points. If the cycle continues tracking, the choppy trading action in the S&P 500 could persist until a quick burst of upside sees a peak in April before a downtrend persists into September.

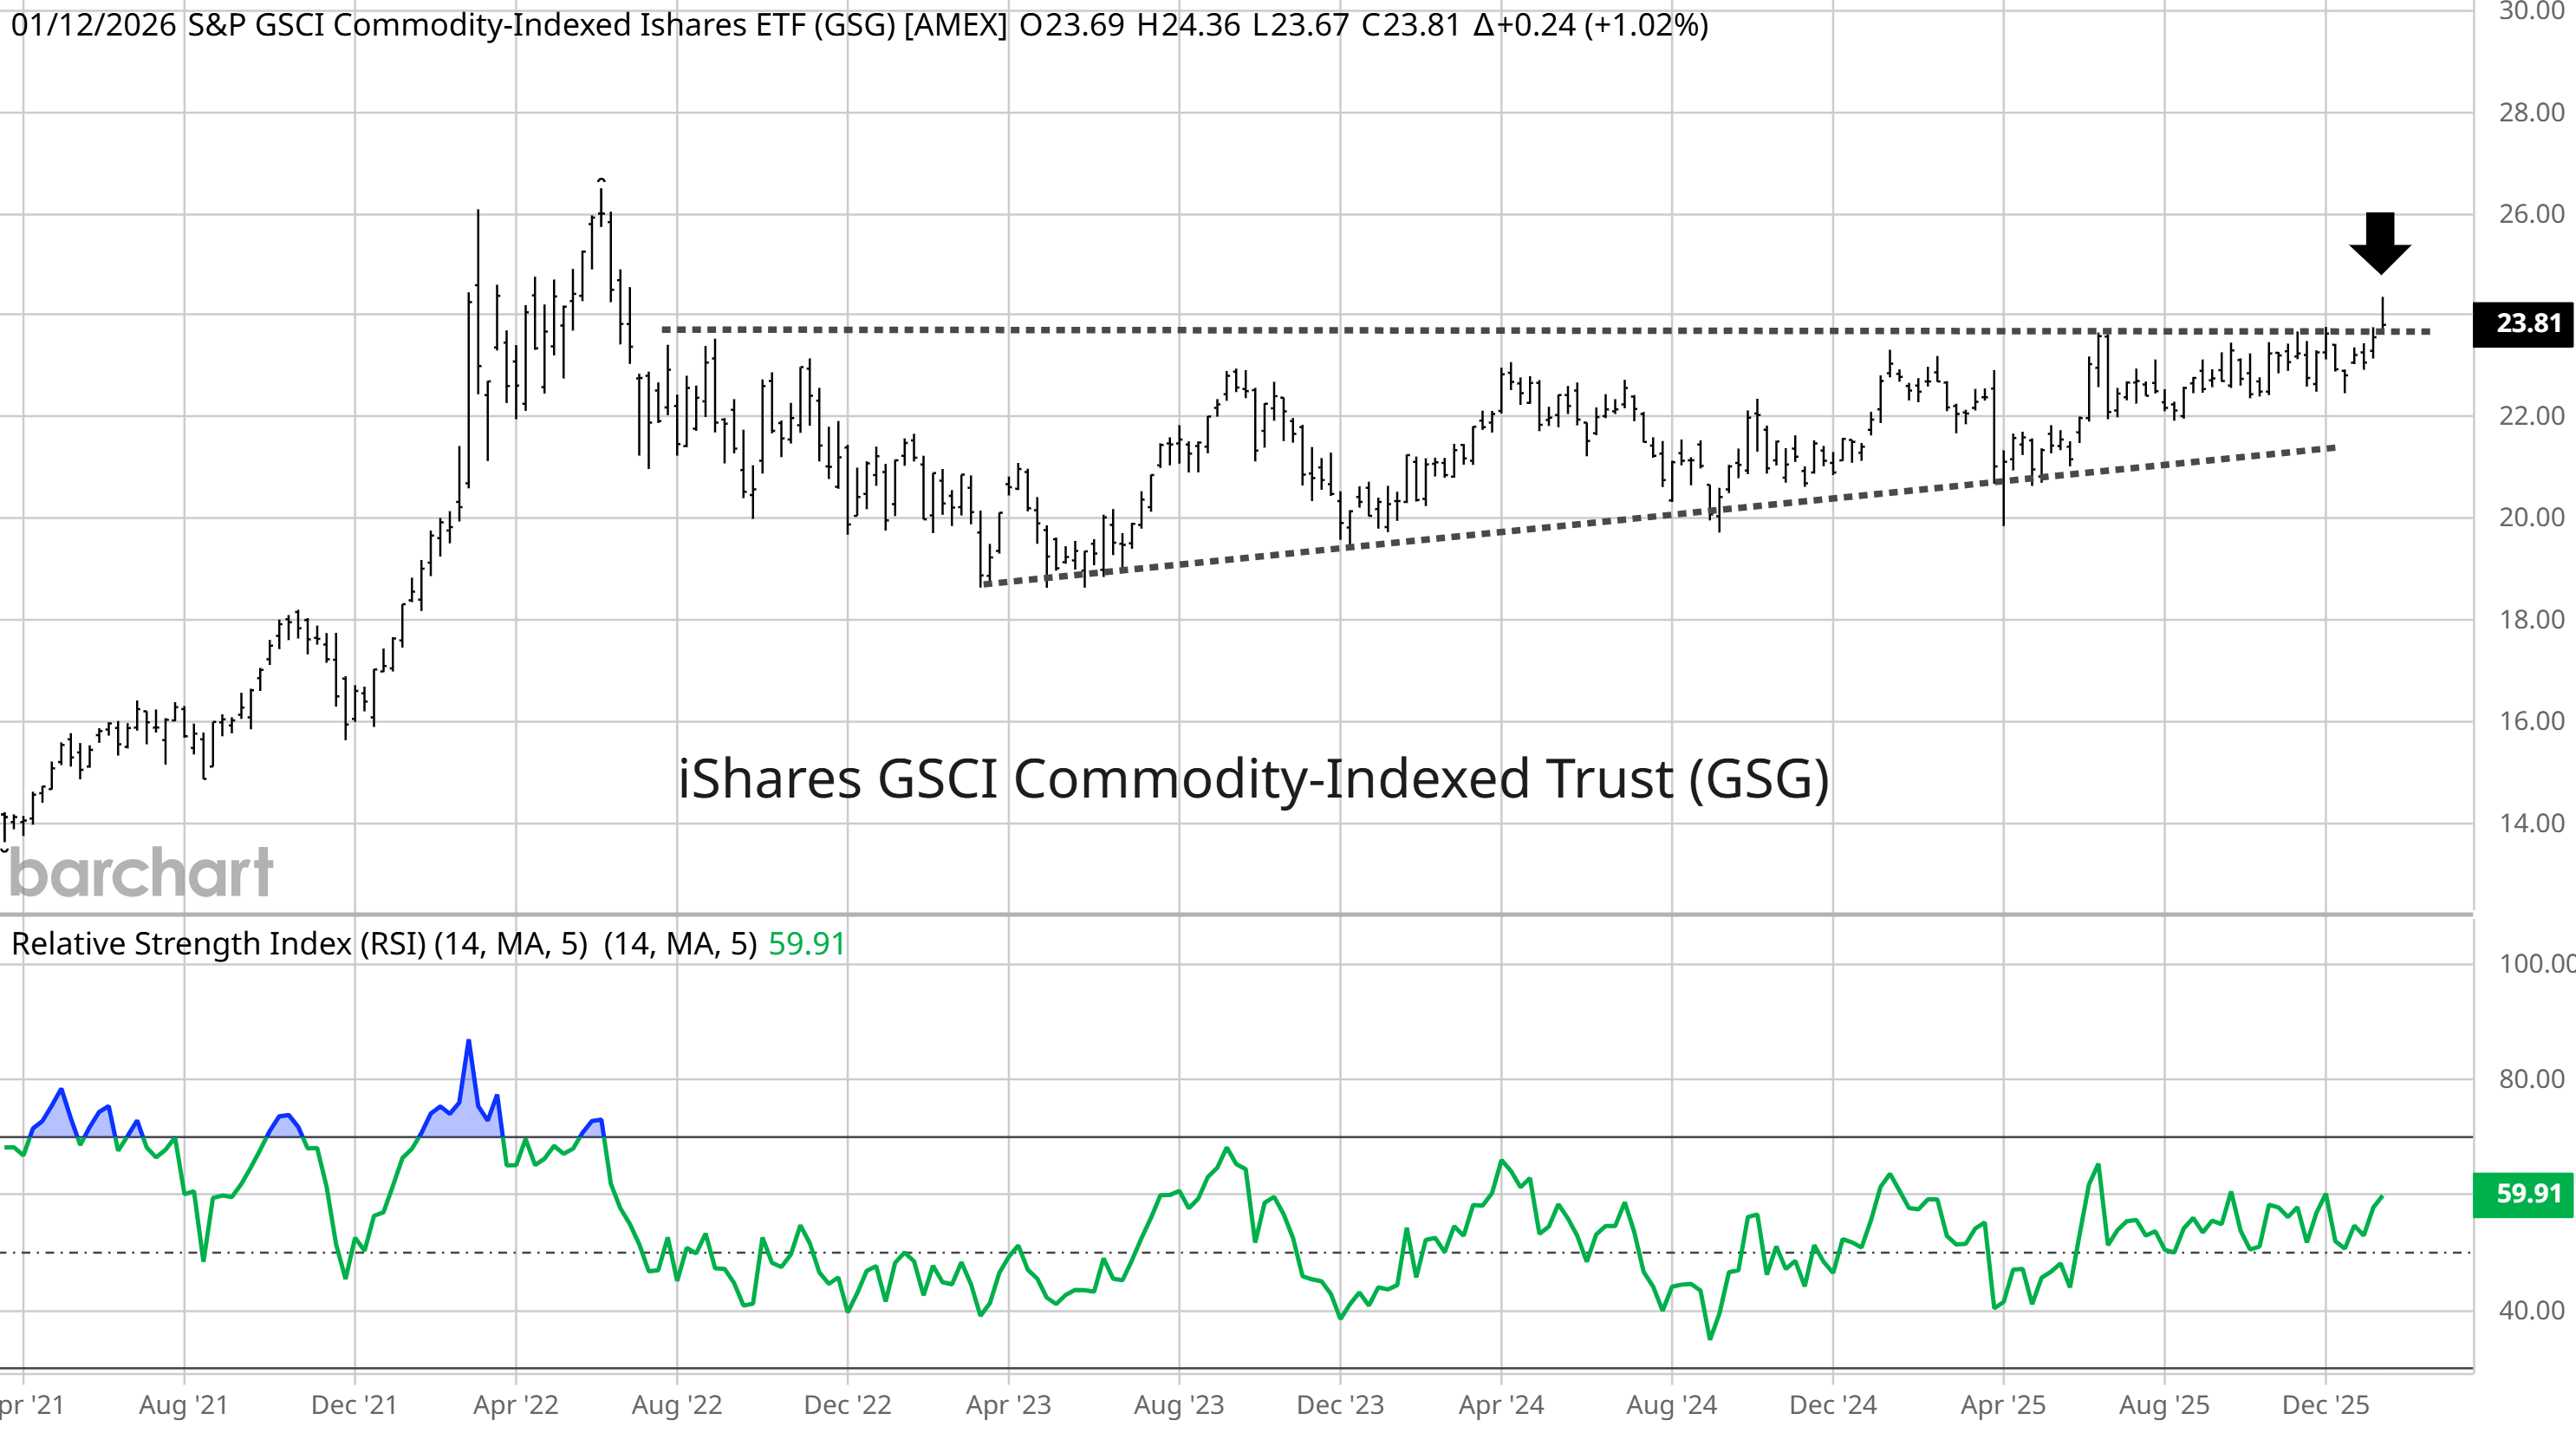
A key breakout could be underway in broader commodity indexes. While the headlines have been focused on the move in precious metals along with shortages in key base metals like copper, the recent rally in oil prices is helping push a broad commodity ETF above a key level. The weekly chart below shows the iShares S&P GSCI Commodity-Indexed Trust ETF (GSG) going back five years. The arrow shows price is attempting to breakout from an ascending triangle pattern that started forming in 2022. Commodity indexes were rallying during the last inflation wave and peaked when the disinflation trend started in mid-2022. If commodities can sustain the breakout, that has serious implications for the inflation outlook ahead.
Heard in the Hub
The Traders Hub features live trade alerts, market update videos, and other educational content for members.
Here’s a quick recap of recent alerts, market updates, and educational posts:
A risk-on signal from QQQ.
The next commodity sector to breakout.
The Bitcoin chart level that matters most.
Why Tesla (TSLA) is the best “Mag 7” setup for 2026.
A multi-year basing pattern that’s moving above a crucial level.
You can follow everything we’re trading and tracking by becoming a member of the Traders Hub.
By becoming a member, you will unlock all market updates and trade alerts reserved exclusively for members.
Trade Idea
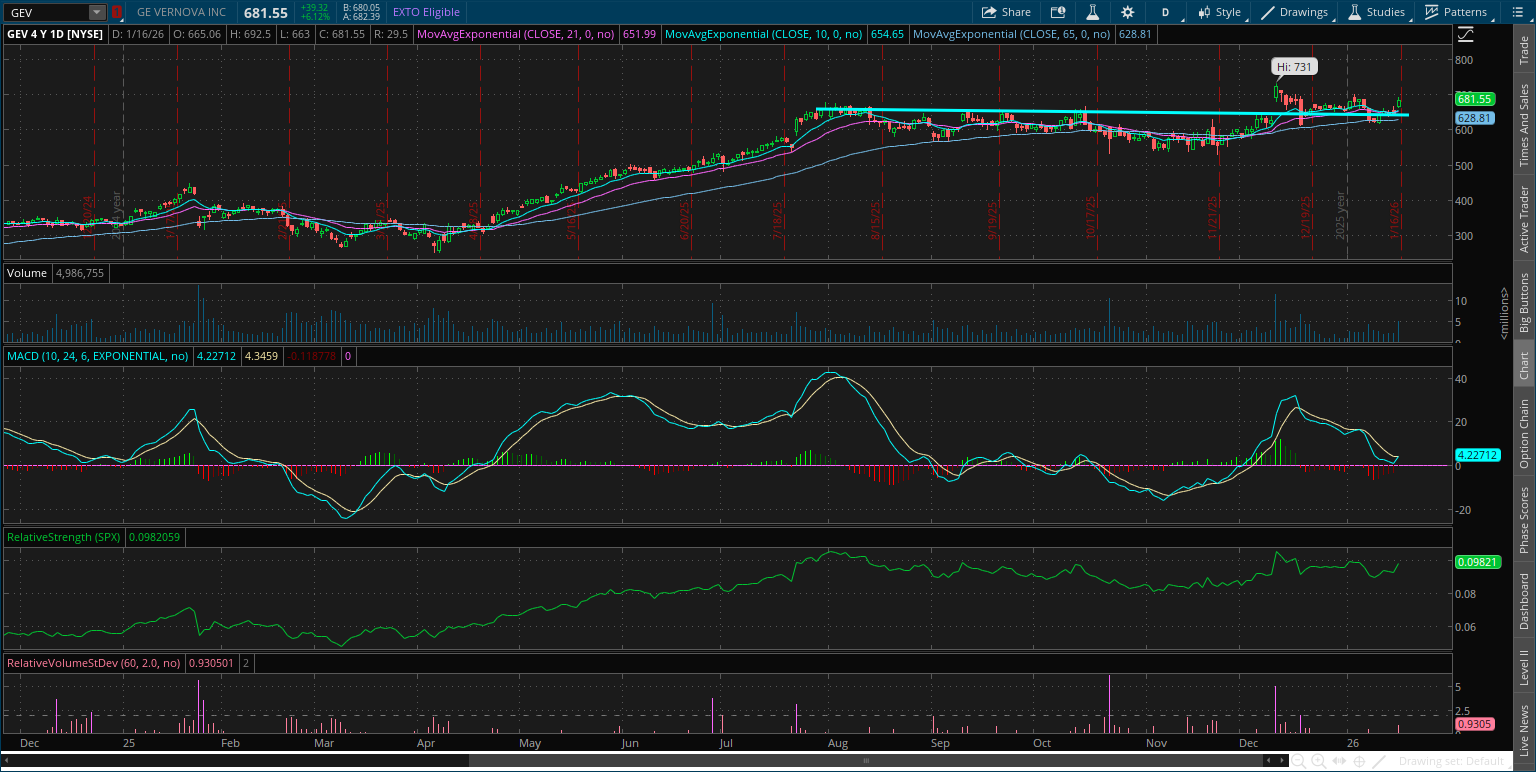
GE Vernova (GEV)
GEV rallied to the $675 level in July and formed a new basing pattern. The stock traded in a relatively tight range and broke out to new highs on a surge in volume in December but the MACD was extended. A pullback saw the stock fill the breakaway gap and is now creating a base-on-base pattern.
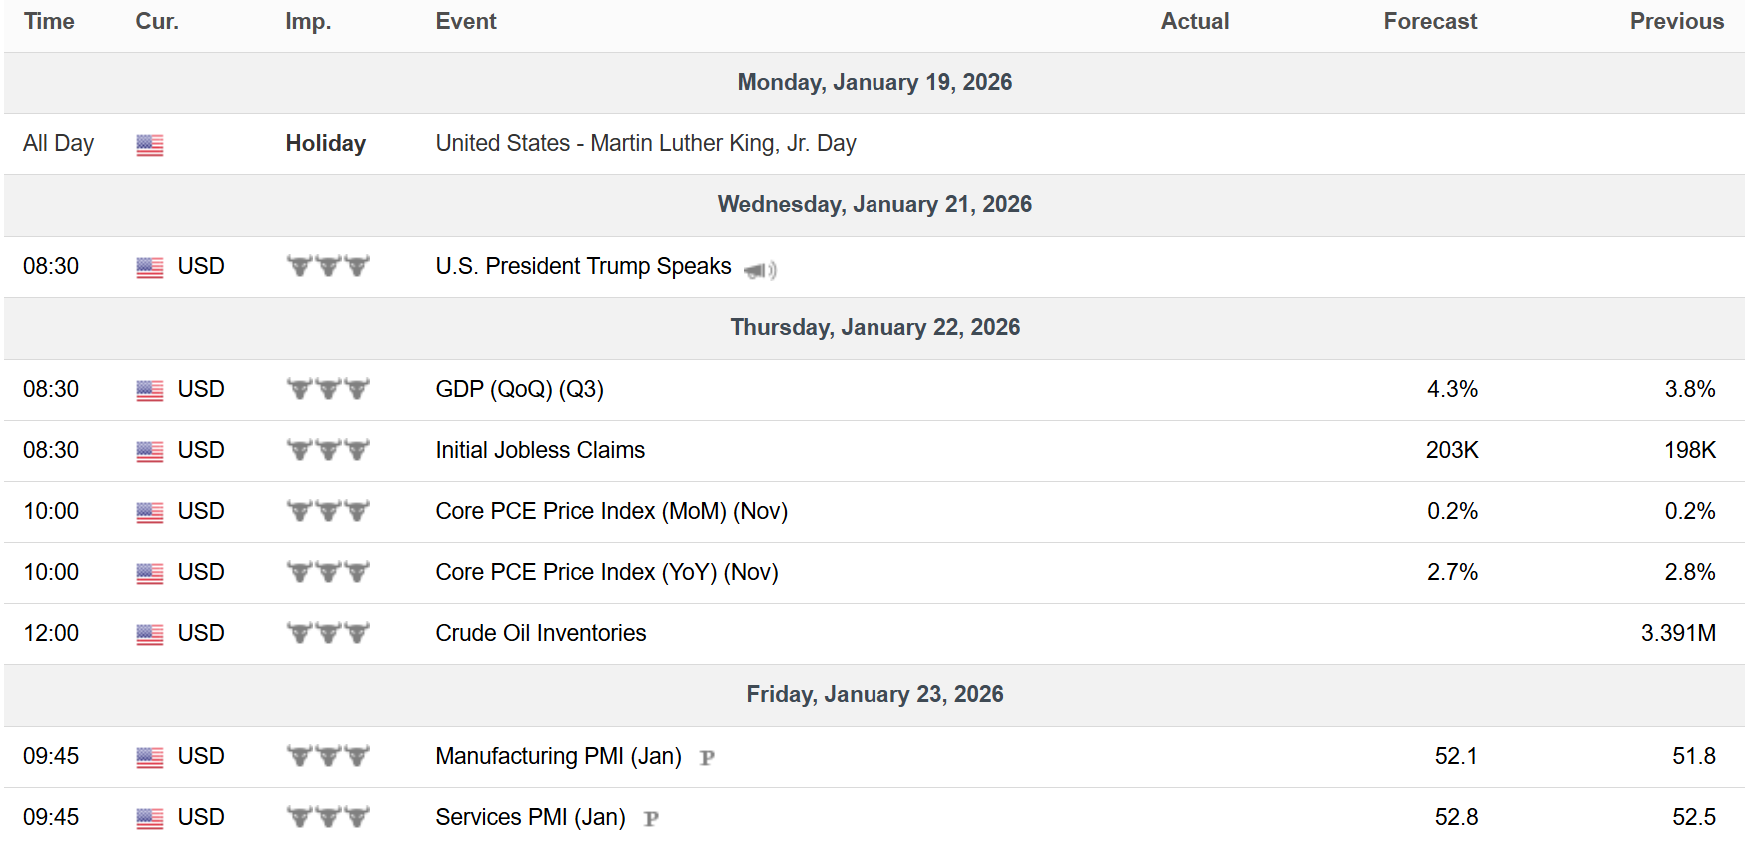
Key Upcoming Data
Economic Reports
Earnings Reports

I hope you’ve enjoyed The Market Mosaic, and please share this report with your family, friends, coworkers…or anyone that would benefit from an objective look at the stock market.
Become a member of the Traders Hub to unlock access to:
✅Model Portfolio
✅Members Only Chat
✅Trade Ideas & Live Alerts
✅Mosaic Vision Market Updates + More
Our model portfolio is built using a “core and explore” approach, including a Stock Trading Portfolio and ETF Investment Portfolio.
Come join us over at the Hub as we seek to capitalize on stocks and ETFs that are breaking out!
And if you have any questions or feedback, feel free to shoot me an email at mosaicassetco@gmail.com
Disclaimer: these are not recommendations and just my thoughts and opinions…do your own due diligence! I may hold a position in the securities mentioned in this report.