The Market Mosaic 11.6.22
Signs of a Jekyll and Hyde stock market, and a look at S&P 500 seasonality into year-end.
Welcome back to The Market Mosaic, where I gauge the stock market’s next move by looking at macro, trends, market internals, and the mood of the crowd. I’ll also highlight one or two trade ideas using this information.
If you find this content helpful please hit that “like” button, share this post, and become a subscriber to this always free newsletter if you haven’t already done so!
Also, be sure to check out Mosaic Chart Alerts. It’s a midweek update covering my best chart setups among long and short ideas in the stock market, along with specific levels that would trigger a trade.
Now for this week’s issue…
When the Federal Reserve raised interest rates by 0.75% for the fourth consecutive meeting, the immediate stock market reaction was somewhat euphoric.
That’s because language indicating a pause in rate hikes was buried in the Fed’s accompanying statement. Specifically, the central bank noted the “the lags with which monetary policy affects economic activity and inflation…”
The implication was that the Fed needs to wait and see if actions taken thus far are having an impact in bringing down inflation which is something I discussed last week.
But I’ve also highlighted the dangers for investors mistaking a pause in rate hikes to an actual pivot toward a more dovish stance. The latter would indicate that the Fed is prepared to stop raising rates entirely, and/or stop the balance sheet runoff.
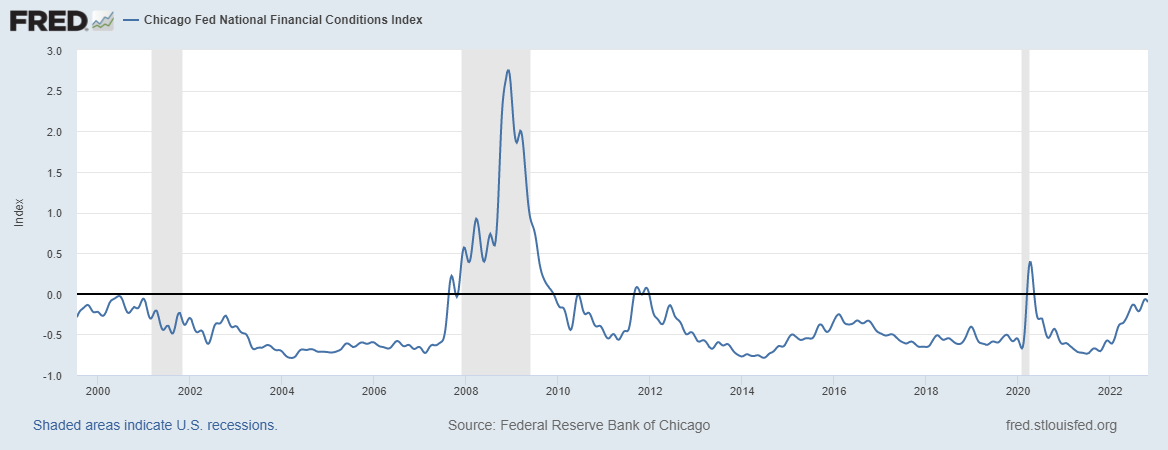
Powell apparently didn’t want any ambiguity either. So during the post-meeting press conference, Powell made sure to squash any hopes that easier monetary policy would be seen anytime soon. I believe Powell struck a hawkish tone because the Fed wants to keep restricting financial conditions (chart below), which are still looser than average despite the aggressive rate hikes.
That tone also sent stocks careening, and is a stark reminder that the Fed continues to drain liquidity from the financial markets.
Along with a hawkish Fed, there are a few other reasons why I’m being cautious near-term. Here’s what I’m watching for stocks as we approach the end of the year.
Seasonally Bullish Except for When It’s Bearish
Historically, this is supposed to be the start of a very strong seasonal period for stocks. But during bear markets, you might as well toss the usual playbook out of the window. The chart below from Topdown Charts shows how seasonality tracks when you separate bull (green line) from bear markets (red line).
The red line shows average movement when stocks finish the year lower. In those scenarios, you’ll notice a rally is historically seen in October through early November which is similar to what we’ve seen unfold over the past month.
But then notice that bear markets tend to finish the year by drifting lower. I’m not saying we have to follow that exact path into year end, but I believe conditions are in place that warrant caution over the near-term.
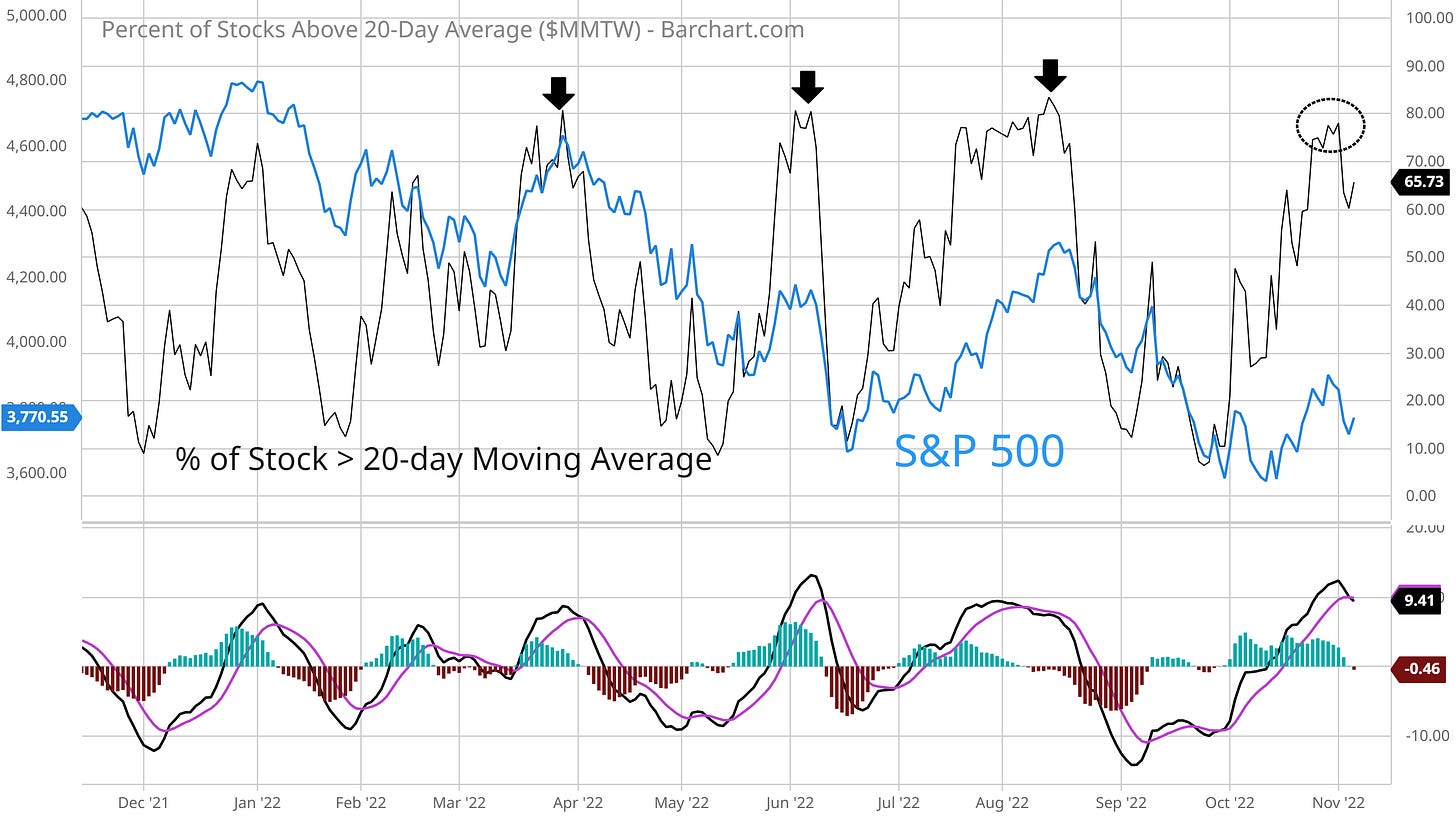
That includes an ongoing overbought condition with my preferred breadth measure: the percent of stocks trading above their 20-day moving average. I’ve highlighted this chart over the past couple weeks, and want to circle back again given the importance of current levels.
This metric is in the early stages of working off an overbought condition after hitting 78% a week ago (circled area). Such conditions preceded the last three waves of selling this year (arrows), which explains my greater focus on this measure lately.
Another concern is with the state of investor sentiment. I mentioned CNN’s Fear and Greed Index last week, which remains in “greed” territory. At the same time, a survey of retail investors by AAII saw bearishness decline sharply over the past week to the lowest levels since March.
As a reminder, sentiment is a contrary indicator, where historically it pays to go against the crowd especially at the bullish/bearish extremes. We’re not at extremes for bullishness, but it’s worth noting how quickly sentiment has changed since the S&P tested the lows in early October.
Now What…
Based on the chart setups I’m monitoring across the stock market and recent trading action, I think we could see a bifurcated market into year-end similar to what unfolded at the start of 2022.
Recall that energy and other commodity-linked stocks were able to rally and buck the trend in the first half of the year (highlighted chart area below)…
…while the S&P 500 is being weighed down by YTD returns on mega-cap stocks like with:
AMZN -47%
TSLA -43%
GOOG -41%
MSFT -35%
In my opinion, many growth stock sectors are set to resume their downtrends. You can see that evidence in growth ETFs like the Ark Innovation fund (ARKK), where I highlighted the downside setup several weeks ago here.
Here’s an updated chart on ARKK below, with a couple key developments to highlight. Price broke the trendline support level (dashed line) in October, then rallied to test the breakdown level along with the 50-day moving average (black line) that I’m highlighting with the arrow. I am watching for price to resume the decline following these tests of resistance.
This past week saw several stocks across other areas of the growth space crash through key support levels, many of which I’ve added to our short watchlist in Mosaic Chart Alerts in recent weeks. That includes S, which I updated in the post below:
I’m also watching the short setup in DDOG, which is breaking through the $75 support zone that stretches back over a year as you can see in the daily chart below.
As for long setups, many emerging opportunities are in the energy space. I’ve highlighted DK, which is holding its breakout over the $30 level.
That’s all for this week. While I’m taking trading opportunities that meet my criteria on both long and short setups, I’m still position sizing conservatively due to the volatility and how quickly stock prices can change direction. Proper risk management is always the most important component of a trading strategy, and that’s especially the case in bear markets!
I hope you’ve enjoyed this edition of The Market Mosaic, and please share this newsletter with anyone you feel could benefit from an objective look at the stock market.
And make sure you never miss an edition by subscribing here:
For updated charts, market analysis, and other trade ideas, give me a follow on Twitter: @mosaicassetco
And if you have any questions or feedback, feel free to shoot me an email at mosaicassetco@gmail.com
Disclaimer: these are not recommendations and just my thoughts and opinions…do your own due diligence! I may hold a position in the securities mentioned in this newsletter.


