
The Market Mosaic 11.5.23
Dead cat bounce or a new stock market rally?


Welcome back to The Market Mosaic, where I gauge the stock market’s next move by looking at macro, technicals, and market internals. I’ll also highlight trade ideas using this analysis.
If you find this content helpful please hit that “like” button, share this post, and become a subscriber to this always free report if you haven’t already done so!
And be sure to check out Mosaic Chart Alerts. It’s a midweek update covering chart setups among long and short trade ideas in the stock market, along with levels I’m watching.
Now for this week’s issue…
If there was ever a time to ignore the headlines and instead focus on action under the stock market’s hood…last week was it.
Macroeconomic events and reports took center stage, starting with the latest Federal Reserve meeting.
While Fed Chair Jerome Powell continues leaving the door open to another increase in the fed funds rate by year end, he also acknowledged tightening financial conditions are helping the central bank’s efforts to slow the economy.
That was met with optimism that the Fed’s rate hiking cycle is finished. Following the meeting, market implied expectations for the fed funds rate shows no further hikes while rate cuts could begin as soon as May as you can see below (h/t Charlie Bilello).

Powell also stressed watching if rate hikes are finally impacting aggregate demand, and perhaps he has a point. Key data points on both manufacturing and service sector activity from the ISM slowed sharply last week. The services gauge dropped to a five month low, while the manufacturing figure fell further into contraction territory.
Then came the October payrolls report. There were 150,000 jobs created during the month. That missed economist estimates, and is a sharp slowdown from September’s pace of 297,000 jobs. And while still a low level at 3.9%, the unemployment rate has crept higher since bottoming at 3.4% in April.
The weight of the evidence may prove Powell’s point that rate hikes are finally catching up to the broader economy and translates to less need for further rate increases.
But at the same time, growth deterioration isn’t enough to stir fears over a recession. In other words, a goldilocks scenario for stocks where economic activity isn’t too hot or too cold…pointing to the “soft landing” scenario for the economy.
The S&P 500 responded by finishing the week 5.9% higher for the best weekly showing since last November. That strength was echoed around the world, with the global equity benchmark seeing its best week in a year as well (chart below).

But while the sudden rally may have caught investors off guard, we’ve been tracking favorable conditions for weeks now. Oversold markets, positive breadth divergences, bearish investor sentiment, and a favorable calendar period were all supportive of a rally.
This is exactly why so much of my analysis focuses on variables impacting the market’s underlying technical structure and mood of participants, and not getting caught up in the headlines.
Now the question becomes if this rally is durable, or just a dead cat bounce from oversold levels. To answer that question, here’s what to watch for next.
Confirming the Rally
The debate among traders will now center around the durability of this rally, or if it’s just short covering from a deeply oversold condition with new lows to be seen.
In order for a new rally to emerge, I will be looking for signs that institutional investors are aggressively scooping up stocks. Institutions own around 80% of the stock market’s capitalization, so you need them on your side for powerful moves.
And to track if institutions are getting aggressive, I monitor for breadth thrusts. That’s indicated by a surge in advancing stocks relative to declining ones, with extreme values signaling the arrival of institutional flows.
One way of measuring breadth thrusts was popularized by Martin Zweig, which looks at advancing stocks on the NYSE as percent of all advancing and declining stocks. A Zweig Breadth Thrust (ZBT) was triggered with Friday’s price action, which historically has very positive implications for market performance.

You can see in the table above (h/t Ryan Detrick) that only 18 ZBT signals have been generated since 1945, with a 100% win rate and average gains of 23% for the S&P 500 a year following the signal.
Another way to monitor for thrusts is simply following the daily ratio of advancing stocks relative declining ones on the New York Stock Exchange (the NYSE A/D ratio), or in the volume of advancers relative to decliners. The chart below shows the NYSE A/D ratio going back to 2022’s bear market bottom.

There’s no hard rule on what level constitutes a thrust. But around 2022’s bottom and before the start June’s breakout over 4200, you see the A/D ratio spike over 10 (shown with the circles in the chart above). We failed to see that level on any daily reading last week, although Thursday’s figure just under 8/1 came close.
Another sign of healthy market activity would be a regime change in net new highs. First time since September 1st, there were more new 52-week highs across the major stock exchanges than new lows as I posted about below. In a sign of how difficult the market has been this year, 63% of trading days in 2023 have seen net new lows.
The switch back to positive territory is a good start, but past rallies with staying power see net new highs stay positive and expand to +300 or better.
While we had a ZBT last week, other ratios of advancers relative to decliners fell slightly short of generating the type of extreme reading seen at other recent notable bottoms. Ideally we receive more confirmation signals soon marked by a cluster of strong A/D readings, along with an ongoing expansion in net new highs.
Now What…
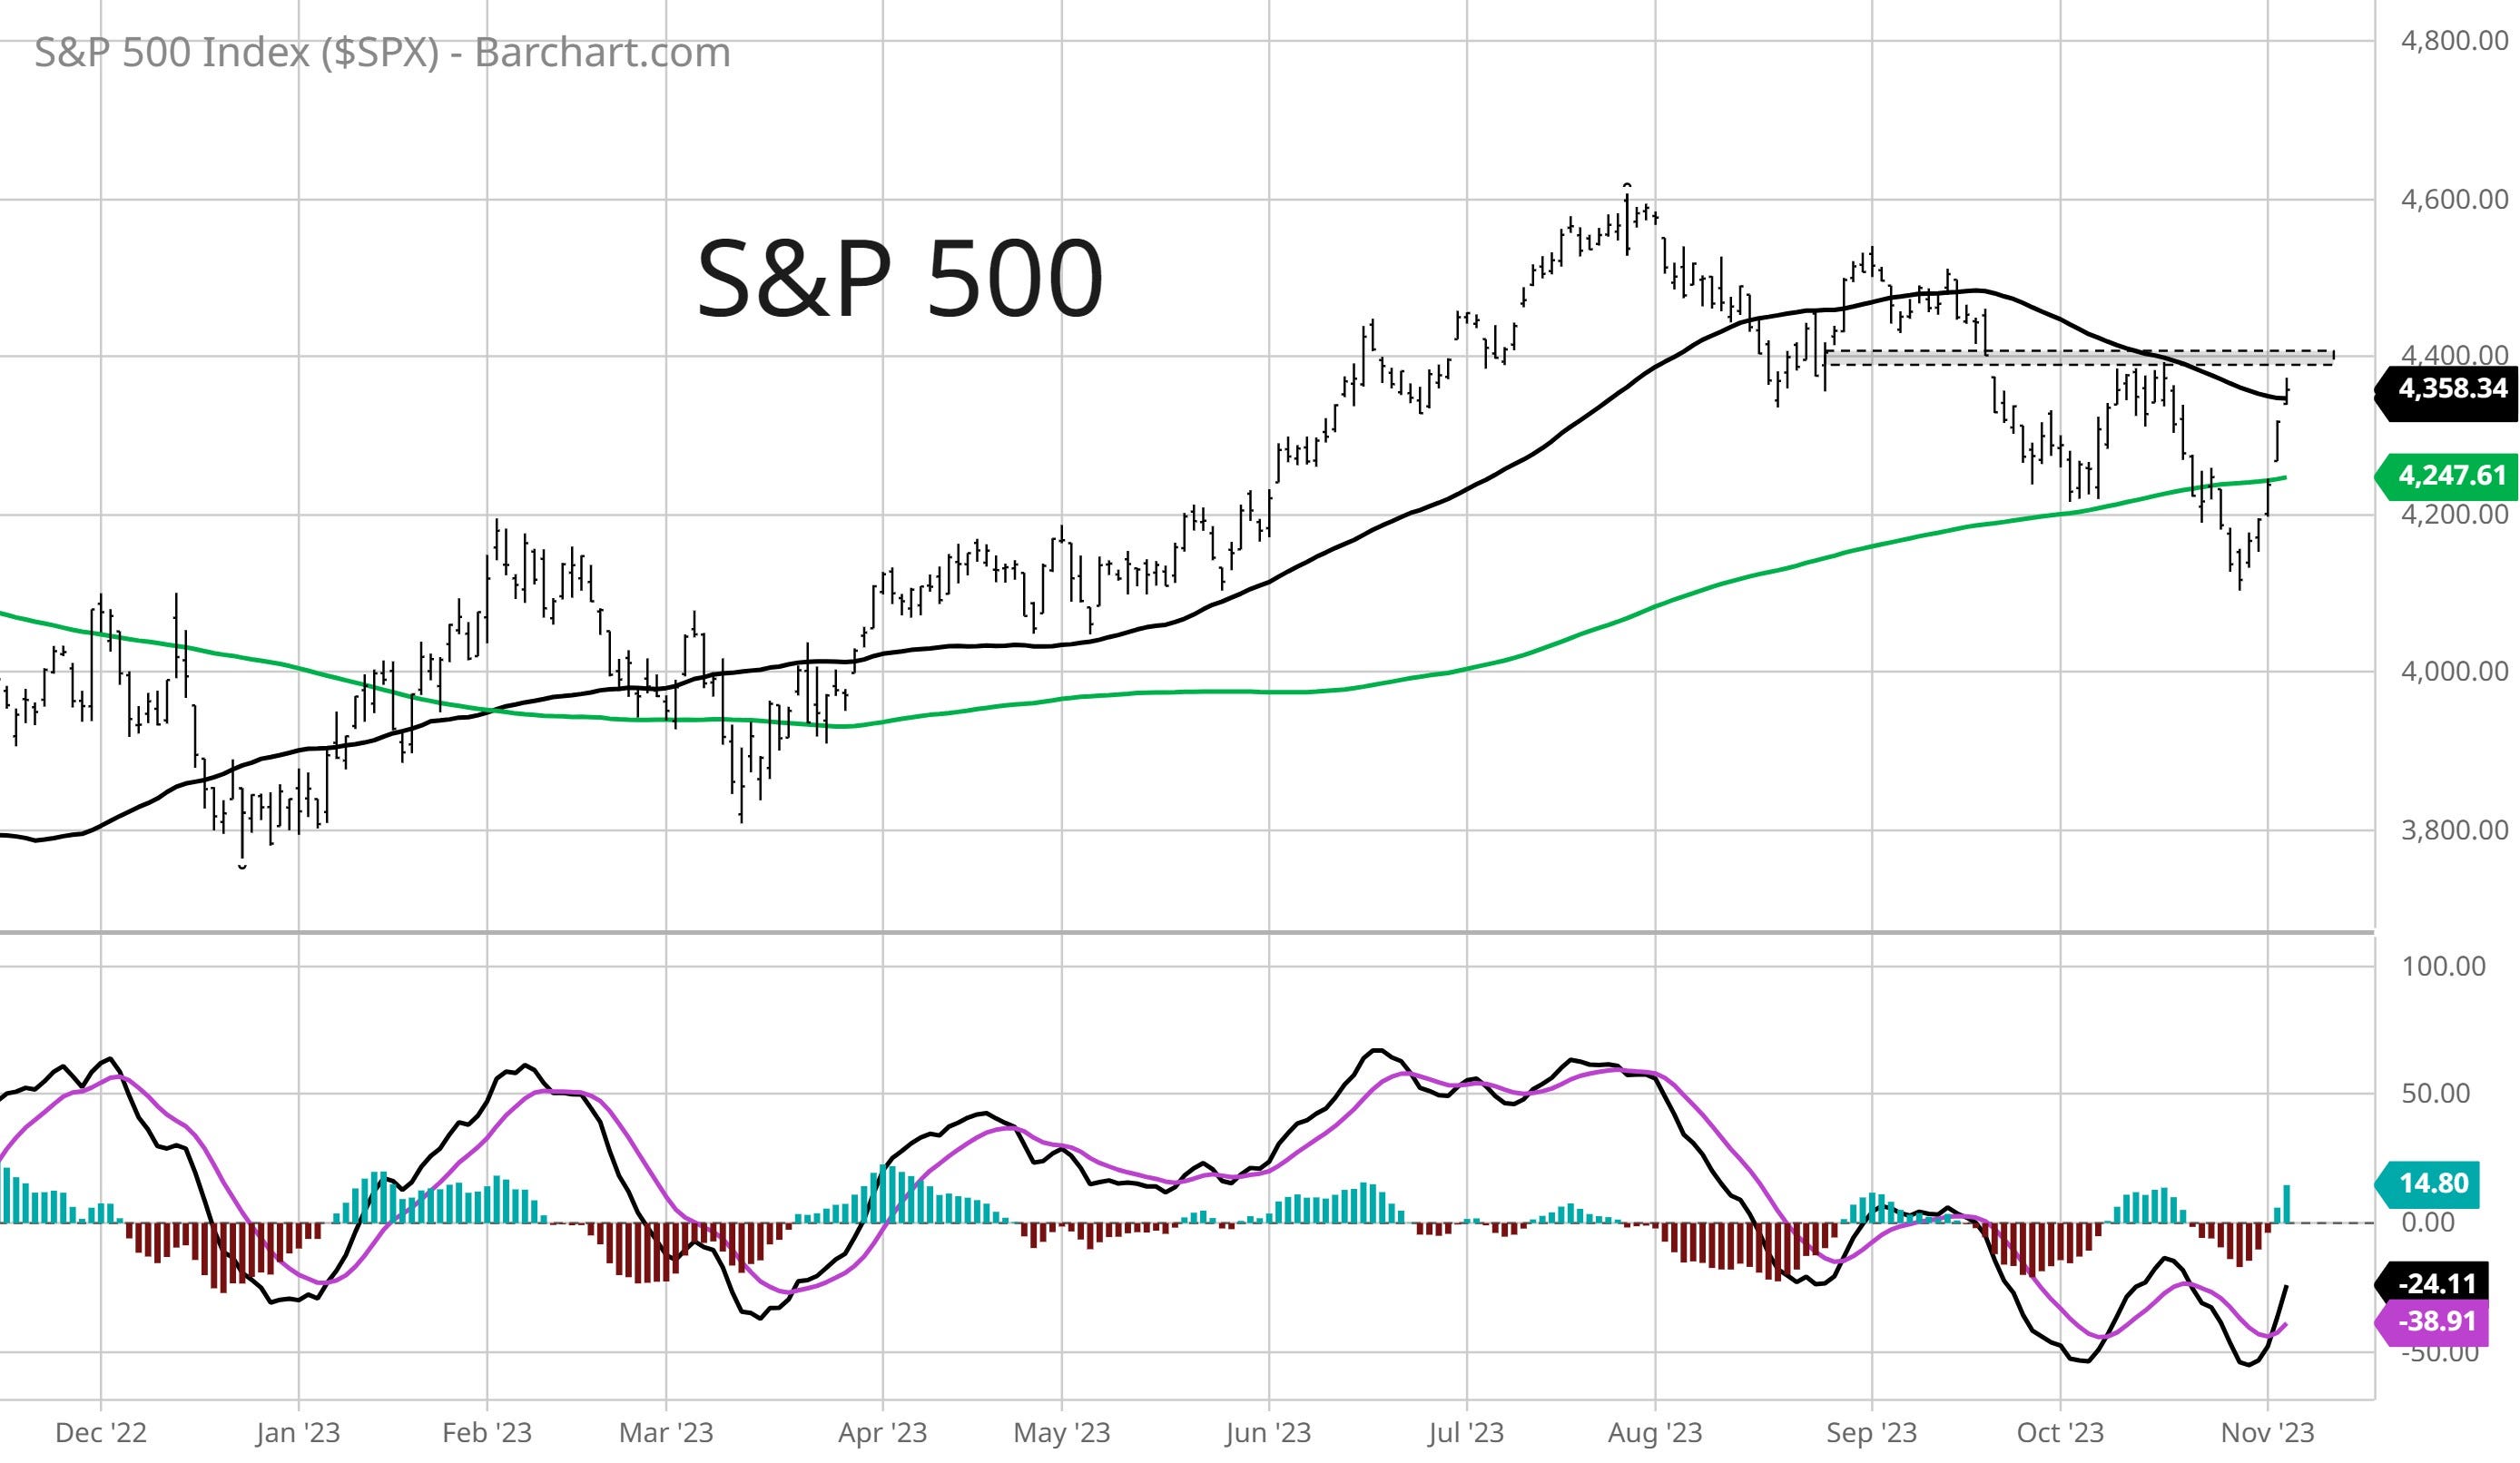
In addition to the metrics above, I will be following the trend. There’s no need to overcomplicate things, so I keep it simple when it comes to trend following. An uptrend is marked by higher highs and higher lows, while a downtrend shows lower highs and lower lows.
The downtrend in the S&P 500 is evident from the July peak. In order to flip the trend, I would like to see the 4400 level recaptured (shown with the shaded line) which was the last lower high during the correction and the breakdown level from the head and shoulders top. Any pullback needs to respect the low made at the end of October around 4110.
Other factors remain positive for the rally to continue. Based on the AAII’s survey of retail investors, bearish sentiment rose to 50% last week which is the highest level in almost a year.
Calendar seasonality also remains a tailwind, with November and December ranking among the top three months for the S&P’s average return gong back to 1945 as you can see below.

I also follow the action from my watchlist to confirm a better trading environment. I noted the shift to a net new high regime in the section above. My breakout setups should complete their patterns with a move to new highs, and be reflected in further expansion of net new high data.
In terms of chart setups, AROC is a good example of what I’m after. A series of smaller pullbacks within the base since August gave way to a breakout on surging volume and confirmation with the relative strength line at new 52-week highs.

That’s all for this week. Many stocks I’m monitoring are rallying hard this past week, but their basing patterns are incomplete which presents higher risk entries. The key is not to give in to fear of missing out. Patience is key and there will eventually be a pullback, and that will go a long way toward helping setups finish their basing patterns. If this is indeed the start of a new uptrend, there will be plenty of trading opportunities ahead.
I hope you’ve enjoyed The Market Mosaic, and please share this report with your family, friends, coworkers…or anyone that would benefit from an objective look at the stock market.
And make sure you never miss an edition by subscribing here:
For updated charts, market analysis, and other trade ideas, give me a follow on Twitter: @mosaicassetco
And if you have any questions or feedback, feel free to shoot me an email at mosaicassetco@gmail.com
Disclaimer: these are not recommendations and just my thoughts and opinions…do your own due diligence! I may hold a position in the securities mentioned in this report.