The Market Mosaic 1.14.24
S&P 500: Short-term pullback on deck?
Welcome back to The Market Mosaic, where I gauge the stock market’s next move by looking at macro, technicals, and market internals. I’ll also highlight trade ideas using this analysis.
If you find this content helpful please hit that “like” button, share this post, and become a subscriber to this always free report if you haven’t already done so!
And be sure to check out Mosaic Chart Alerts. It’s a midweek update covering chart setups among long and short trade ideas in the stock market, along with levels I’m watching.
Now for this week’s issue…
Following the latest round of inflation reports, market implied odds for interest rate cuts by the Federal Reserve are gaining steam.
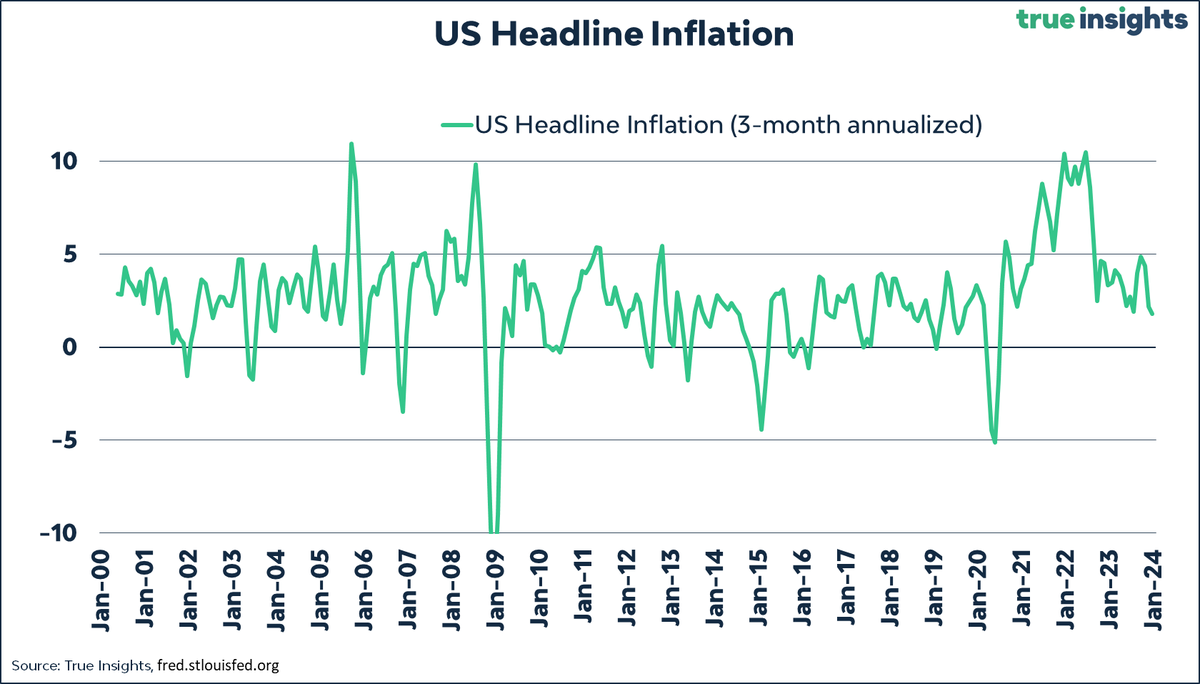
While December’s Consumer Price Index (CPI) came in hotter than expected at 3.4% compared to last year, the annualized gains of more recent months continue pointing to a sharp deceleration. The chart below shows the three-month annualized rate at 1.8%, which is the lowest level since June 2020.

And if there were any concerns around headline CPI’s uptick, the Producer Price Index (PPI) released on Friday extinguished any fears that inflation is ramping back up. The December PPI report showed that wholesale prices rose just 1% in December year-over-year, which was below economist estimates for an 1.4% gain.
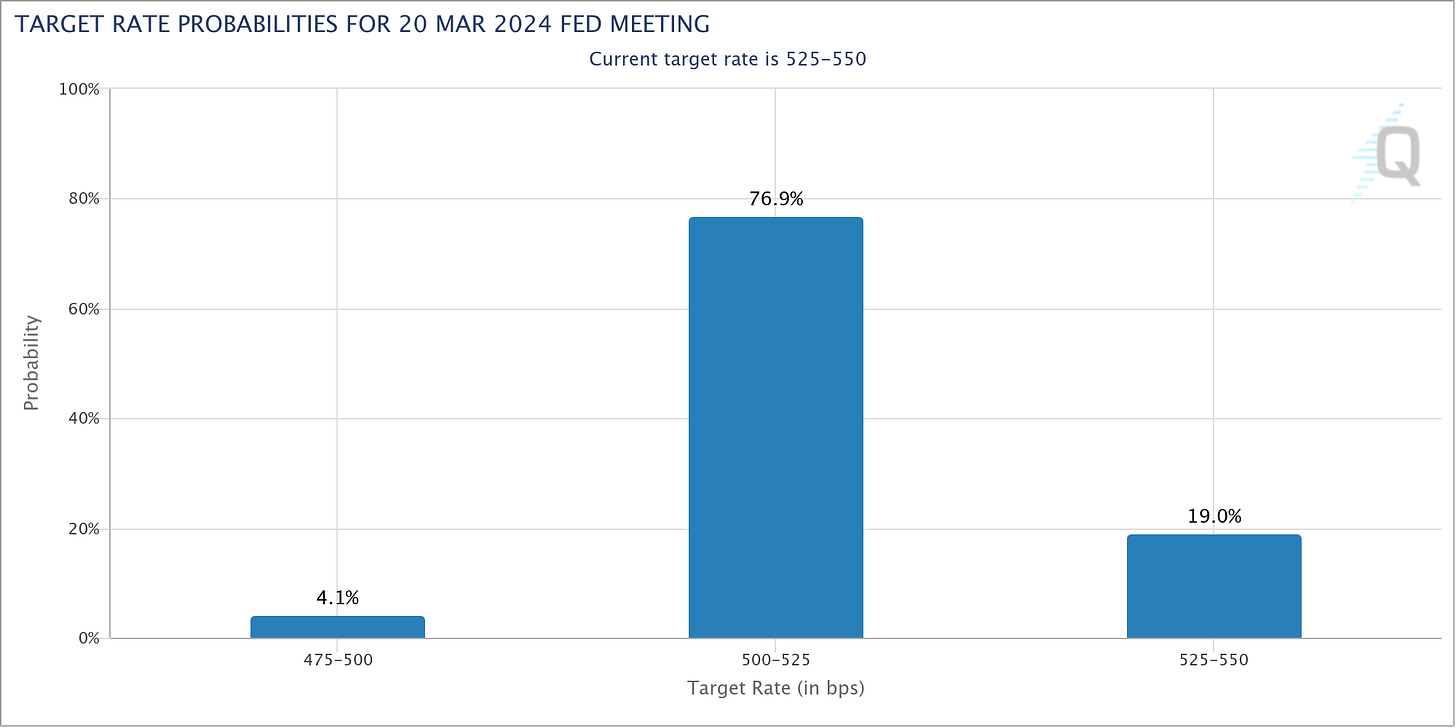
Following the report, the odds point to a 77% chance that the Fed will cuts rates by a quarter point at its meeting in March as you can see below.
Not only that, but market odds now point to a quarter point rate cut at every Fed meeting after that this year…or seven consecutive cuts. That compares to the three cuts suggested by Fed member forecasts following their December meeting.
Growing expectations for rate cuts have helped fuel the rally in the stock market, especially since views started shifting over the last month for a growing number of rate cuts in 2024.
That has the S&P 500 on the verge of new all-time highs, which is trading less than 1% below the peak reached back in 2021.
But despite the good news on the macro front, there are growing divergences under the stock market’s hood that suggests caution over the near-term.
Short-term Caution Signals
Various measures of investor sentiment continue running at elevated bullish levels. The AAII survey of retail investors still shows bullish views running near 49% compared to bears at 25%. The ratio of bulls to bears remains in extreme bullish territory.
The NAAIM survey shows how active investment managers are positioning their portfolios. While they’ve brought exposure lower since the end of December, it’s still running near the high end of the two-year range as you can see below. And CNN’s Fear & Greed indicator is just outside of “extreme greed” territory.
On side note, I specifically track those indicators to get a look at sentiment from different angles. The AAII figure measures retail investors, NAAIM reflects professional investors, and the Fear & Greed Index is comprised of market-based variables like put/call ratios and the Volatility Index (VIX).
Bullish sentiment is nothing new, with these indicators entering greed territory back in November. Yet the stock market has rallied further since then.
On its own, too much bullishness isn’t a reason to sell your positions and get out of the stocks as I showed you here. That’s especially the case when participation in the market’s trend stays strong.
But when you combine bullish sentiment with signs that the rally’s foundation is crumbling…that’s when I grow concerned over the chances for a pullback. And the past week has seen the first large bearish divergence emerge in the stock market’s trend since the rally started in October.
Perhaps the most glaring divergence is with the percent of stocks trading above their 20-day moving average (MA) across the stock market. That’s just a way to measure participation by looking at the percentage of stocks in short-term uptrends.
You can see in the chart below that the average stock is not keeping pace with the S&P 500, with only 37% of stocks across the market trading above their 20-day MA. That’s become more pronounced over the past week as the S&P rallied back to the highs (circled blue line).
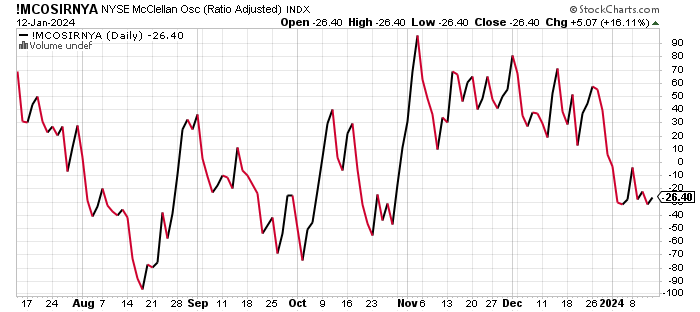
I’m also following the NYSE McClellan Oscillator, which tracks the difference between advancing and declining stocks on the NYSE over a trailing period. This indicator has also showed a bearish divergence with lower highs since early November even as the S&P 500 worked its way higher. At the end of December, the oscillator fell into negative territory for the first time since October (chart below).
We can also look at the NYSE McClellan Summation Index, which is a sum of the oscillator’s past values. One popular way of utilizing the Summation Index is by applying a 10-period MA to generate signals. You can see we had a bearish cross lower about a week ago.
This is first combination of bullish sentiment coupled with deteriorating breadth since the rally that started in late October. Does that mean a sharp pullback is about to hit investors?
Now What…
There are other warning signs emerging in the technicals that the S&P 500 could pullback. Just as the S&P is testing the highs again, we’re also seeing a growing bearish divergence in the RSI indicator that measures price momentum.
You can see in the S&P chart below that the RSI (bottom panel) is making a series of lower highs since mid-December on each index test of the 4790 level, showing a growing negative momentum divergence.
But even if a pullback does emerge, at this point I expect it to remain contained at 5% or less. It’s worth noting that the S&P averages seven pullbacks of 3% and three 5% declines every year.
One reason to stay optimistic on the intermediate- and longer-term trend comes back to rate cuts discussed earlier. Regardless of when and how many rate cuts arrive in 2024, I think most can agree that cuts will ultimately happen.
And when they do, the forward path of the S&P 500 comes down to recession. The chart below from Maverick Equity Research shows how the S&P has performed historically following the first rate cut. Forward returns in the chart are conditional based on if a recession arrives (red line) or is avoided (green line).
I remain firmly in the camp that chances of a recession are low when you listen to the message coming from the capital markets. Financial conditions are loose, high yield spreads are near historical lows, and cyclical sectors keep performing.
Exchange-traded funds (ETFs) tracking homebuilders (XHB), semiconductors (SMH), and industrial stocks (XLI) are all making new highs ahead of the S&P. The chart below shows each ETF going into 2022’s bear market. I have a hard time being bearish on the economy with that kind of action.
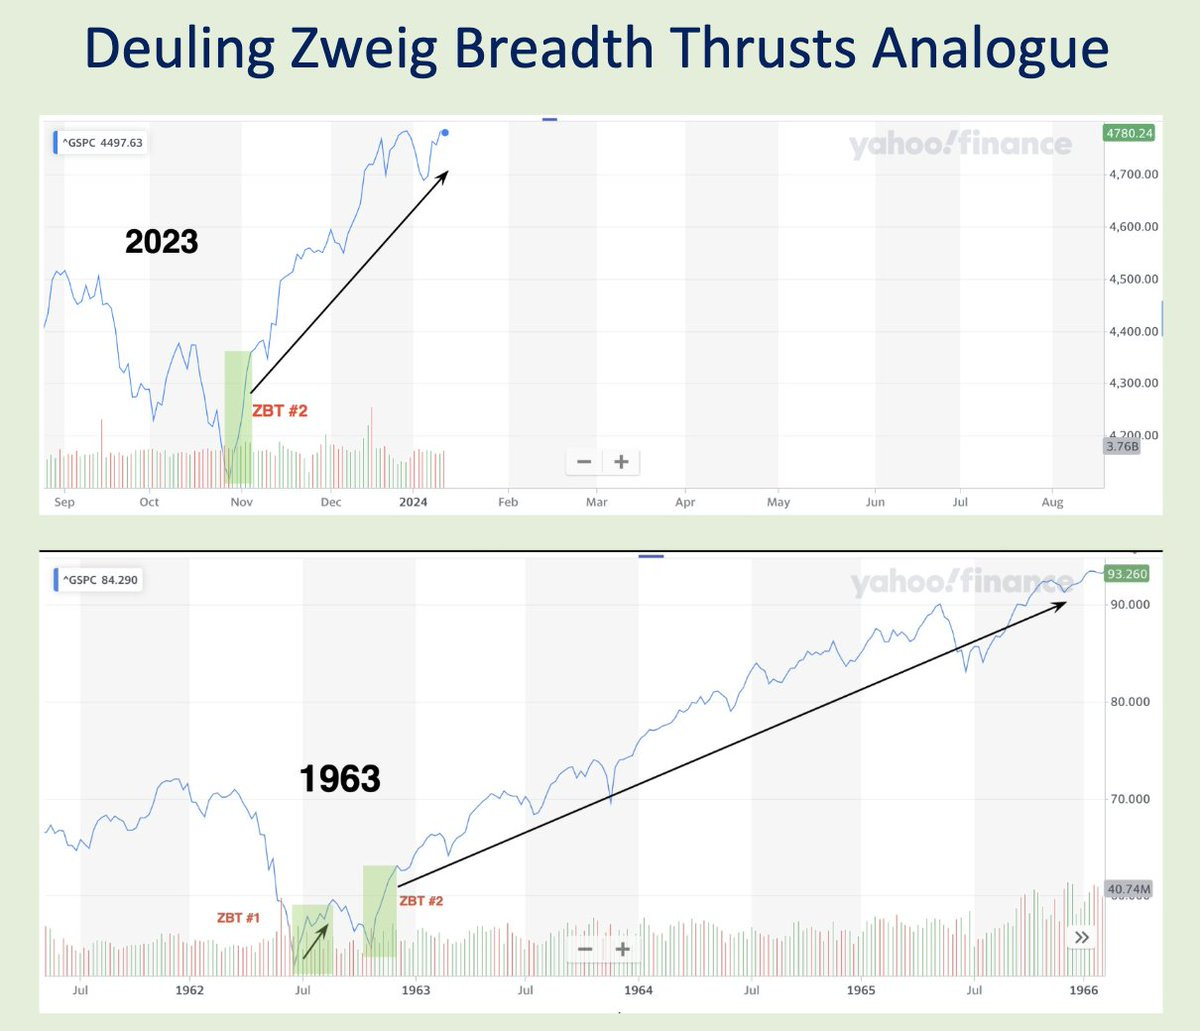
And while short-term breadth is a reason to be cautious in the near-term, several breadth thrusts from last year are reasons to be constructive longer-term. Don’t forget that 2023 saw two Zweig Breadth Thrusts, with the last one happening at the start of November. The only other time is history that a calendar year saw two thrusts was 1963, with the analog chart shown below.

No matter what path the S&P 500 takes in the short-term, my plan of targeting stocks emerging from sound basing patterns while also showing relative strength (RS) remains the same. Like what you’re seeing with Spotify (SPOT). After breaking out from a larger basing pattern over the $185 level, price recently back tested that level as support. That created a new base while resetting the MACD, with the RS line near a two year high. Price is starting to resume the uptrend with a move over $200.
That’s all for this week. With inflation reports out of the way, attention will turn to fourth quarter earnings reports. The pace of reports will start picking up, with 23 of the S&P 500 members reporting this coming week. I’ll be watching how forward earnings estimates evolve, but will also be paying attention to how breadth trends under the hood are changing.
I hope you’ve enjoyed The Market Mosaic, and please share this report with your family, friends, coworkers…or anyone that would benefit from an objective look at the stock market.
And make sure you never miss an edition by subscribing here:
For updated charts, market analysis, and other trade ideas, give me a follow on X: @mosaicassetco
And if you have any questions or feedback, feel free to shoot me an email at mosaicassetco@gmail.com
Disclaimer: these are not recommendations and just my thoughts and opinions…do your own due diligence! I may hold a position in the securities mentioned in this report.


