
The Market Mosaic 11.30.25
Bullish Patterns Igniting Stocks and Precious Metals.

👋Welcome back to The Market Mosaic, where I gauge the stock market’s next move by looking at macro, technicals, and market internals. I’ll also highlight trade ideas using this analysis.
If you find this report helpful please hit that “like” button, share this post, and become a subscriber if you haven’t already done so!
🚨And be sure to check out Mosaic Traders Hub. It’s a members-only platform to alert trade ideas, track a model portfolio of open positions, and further analyze the message coming from the capital markets (👇be sure to check out our special offer below).
Now for this week’s issue…
The S&P 500 was set to deliver the worst November since 2008’s financial crisis, but conditions aligned for a rally that saw the S&P close higher for the seventh consecutive month.
At one point, the S&P 500 was down 5% off the late October peak which saw the index close below the 50-day moving average (MA) for the first time in 138 trading sessions. The CBOE Volatility Index also closed at the highest level since April.
But heading into Thanksgiving week, the S&P 500 hit the most oversold level since the depths of the trade war selloff based on the RSI. Several measures of stock market breadth were also testing oversold levels.
Combined with several signs of elevated bearish sentiment and an incoming period of favorable seasonality, stocks found traction and surged into month end. The S&P 500 has closed higher for seven consecutive months, which is the longest stretch since 2021 (chart below).

Participation in the advance has been so strong that several breadth thrusts are close to triggering, including the Zweig Breadth Thrust. Measures of the average stock are also making new highs ahead of the S&P 500.
Economic data is also slowly being released following the government shutdown. In my opinion, the most notable report was initial jobless claims which fell to 216,000 during the week ended November 22.
That’s the lowest level in seven months, with claims remaining near the historic low end of the range. Evidence continues pointing to an economy and labor market holding up just fine, which is supportive for the earnings outlook.
This week, lets look at surging breadth behind the S&P 500’s recent rally, and why strong participation by the average stock is positive for forward returns. We’ll also review silver’s breakout to record highs, and factors that could drive gains in precious metals even further.
The Chart Report
Oversold conditions off the October peak helped spark the rally into the end of November. That included several breadth metrics that neared the lowest level of the past several years. The chart below shows the NYSE McClellan Oscillator, which takes the difference between advancing and declining stocks on the NYSE over a trailing period. After hitting the third most oversold level of the year, the oscillator has quickly rebounded to one of the highest levels of the year. That shows strong participation by the average stock in the advance, with several breadth thrust metrics close to triggering. The table in the chart shows the performance of the S&P 500 when the oscillator has gone from -60 to over 35 in a five day span, which tends to see strong forward returns six months and out.

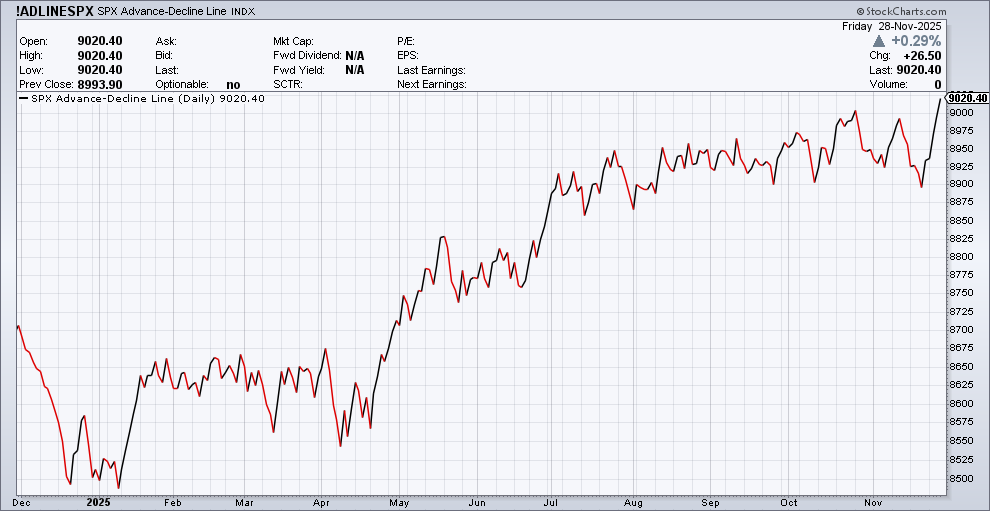
Participation in the recent rally is sending indexes tracking the average stock to new highs ahead of the capitalization weighted indexes. One way of tracking the average stock is through cumulative advance-decline lines that takes the difference between advancing and declining stocks. The chart below is the cumulative sum of advancing versus declining stocks in the S&P 500. While the S&P along with several key members of the “Magnificent 7” remain below the record highs, the S&P’s A/D line made a new high last week. Strong breadth in the uptrend is a bullish condition that can help drive the rally into year-end.
At a time when breadth hit oversold conditions and bearish sentiment became elevated, the S&P 500 is also entering a favorable period of seasonality. The period running from just before Thanksgiving in the U.S. through the start of the new year is historically strong for the stock market. The month of December is also known for delivering positive returns. Since 1950, the S&P 500 has averaged a 1.4% return during December with a 73.3% win rate (chart below). That’s the highest win rate of any month during the year, although it’s worth noting that December finished last year with a loss. The last time the S&P 500 went for back-to-back losses in December was during 2014/2015.

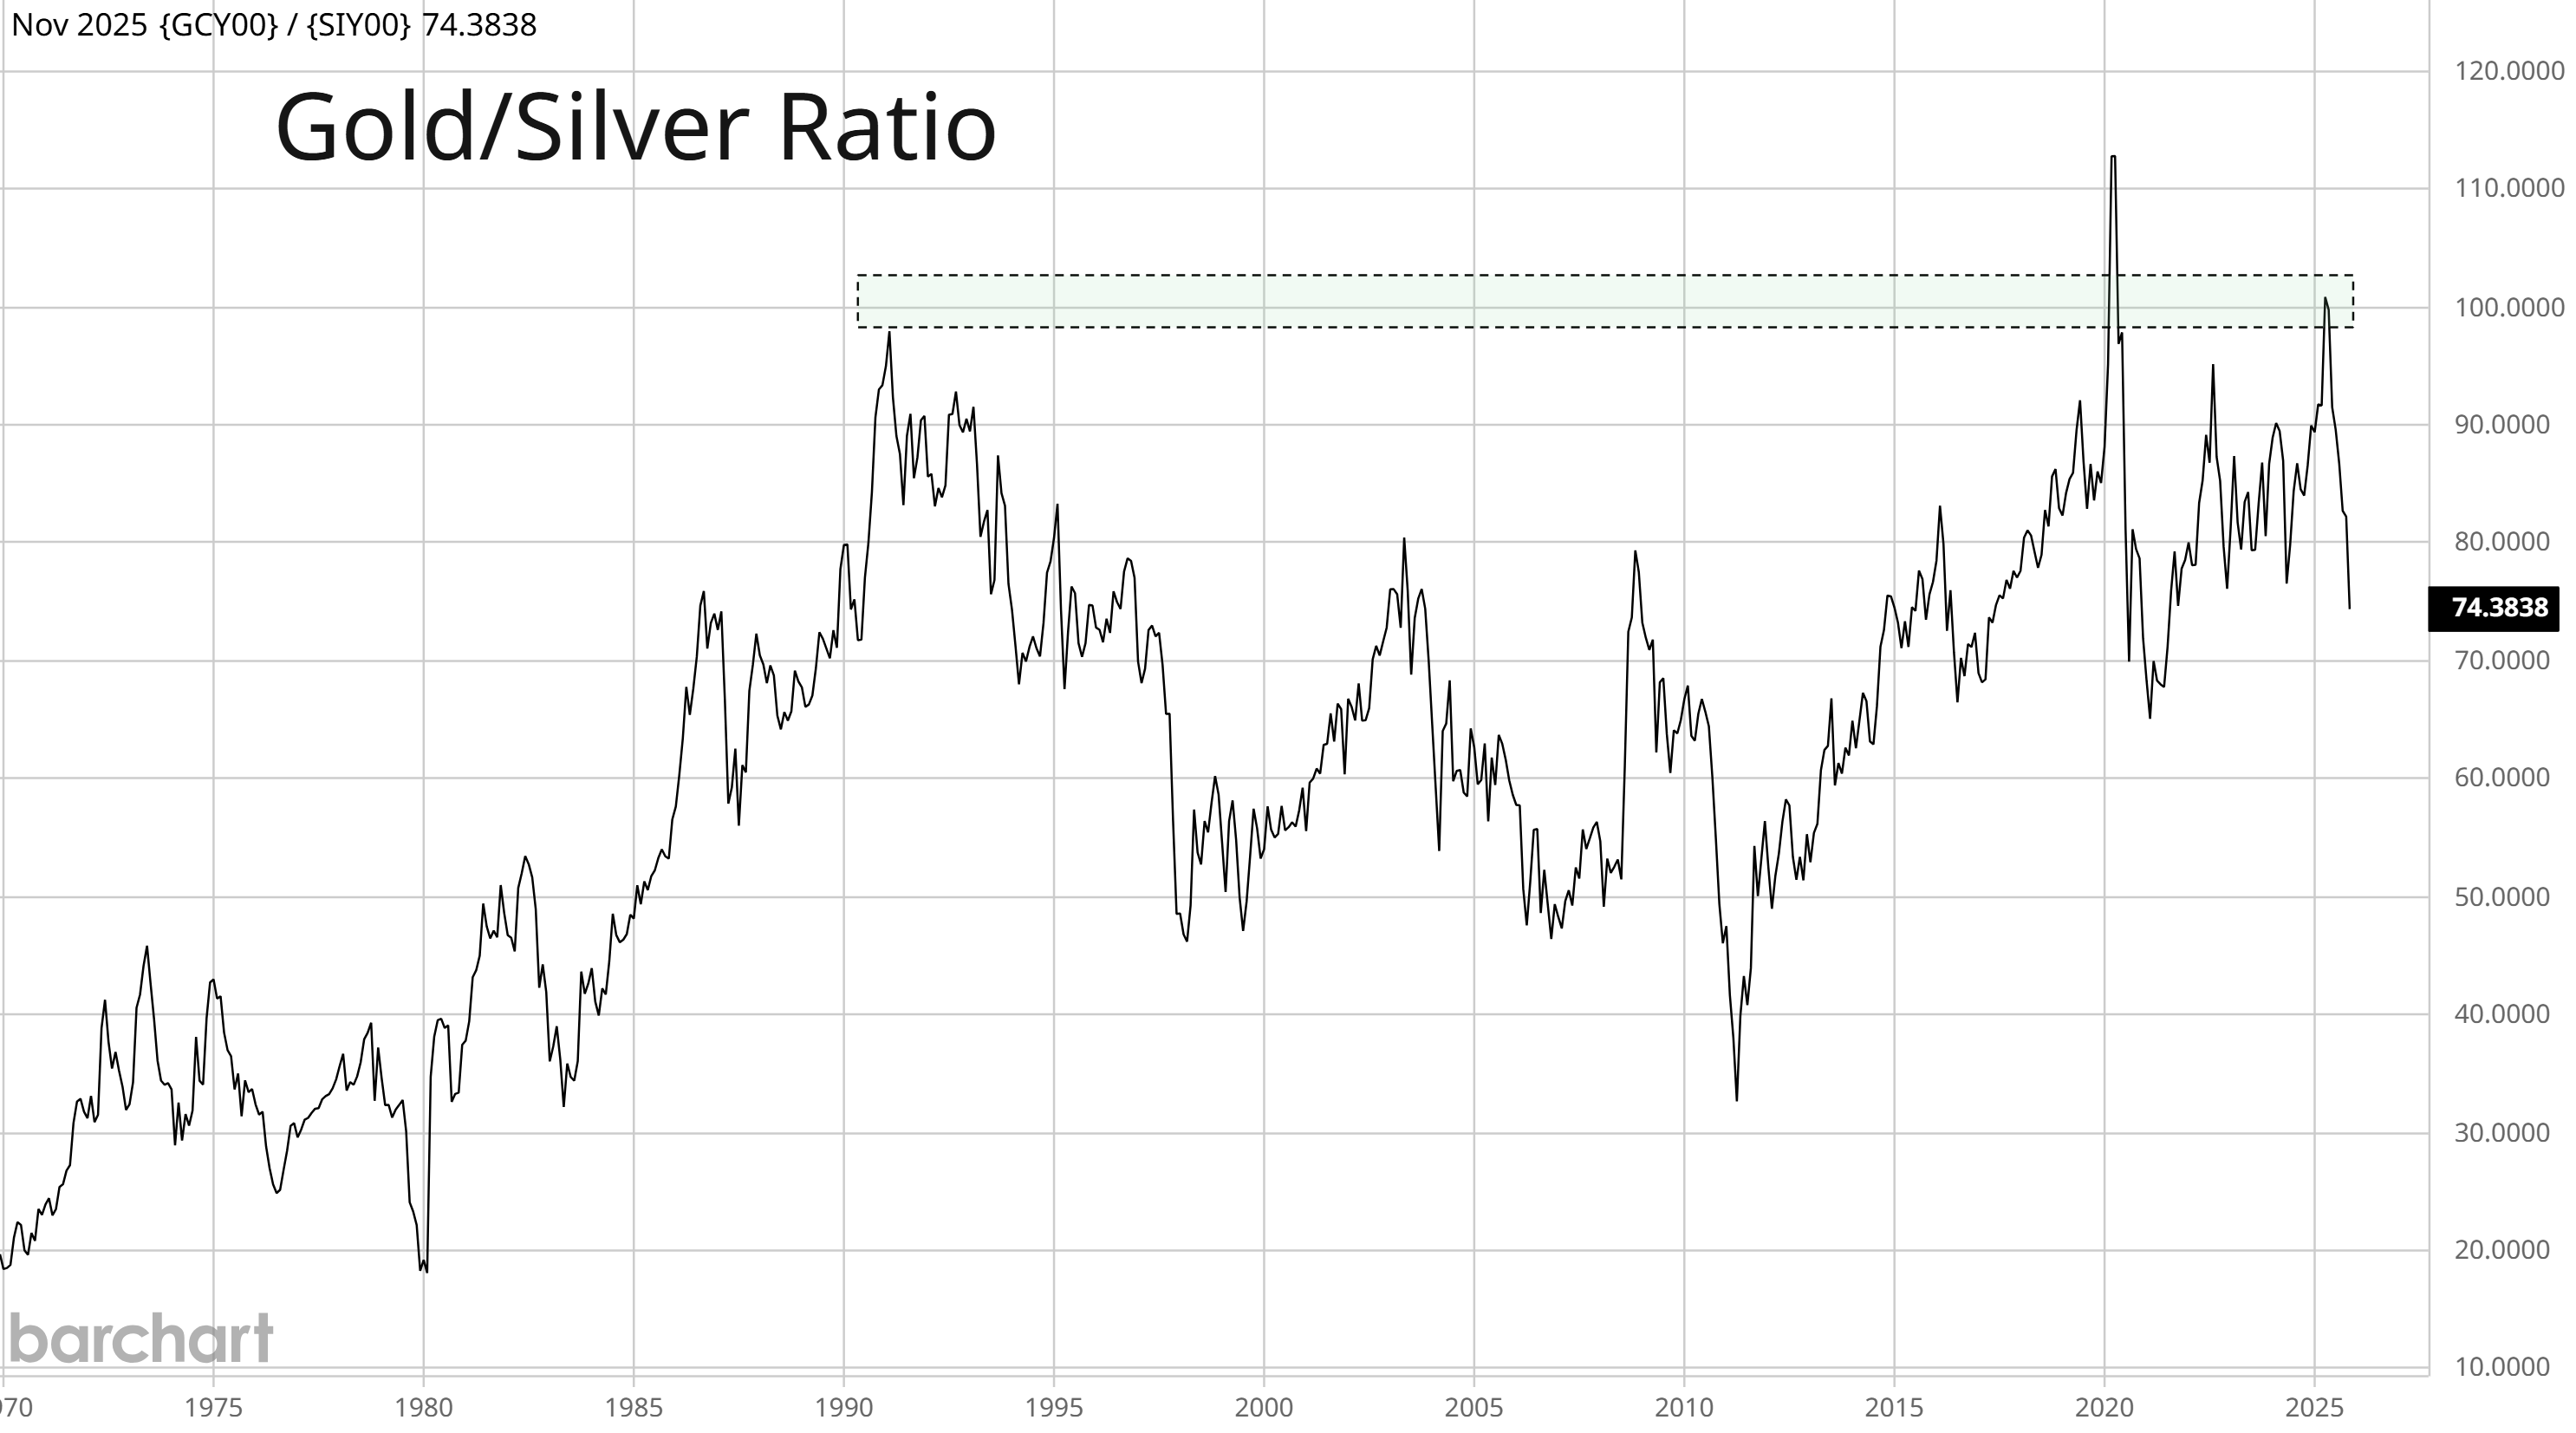
Precious metals are starting to break out to new highs, with silver prices leading the way. Last week, I highlighted the bullish set in silver taking place since October, which was setting up right at the prior record highs seen back in 1980 and 2011. Silver prices are moving out of that pattern and hit a new record high over $56 per ounce. But based on the gold-to-silver ratio, there could be much more upside in store for silver prices. The chart below shows the ratio of gold to silver, where a rising line indicates that gold is outperforming silver and vice versa. During gold’s surge to record highs, it outpaced silver’s gains and drove the ratio toward the highest levels historically. While the ratio is seeing mean reversion lower on silver’s new breakout, it still remains elevated relative to history.
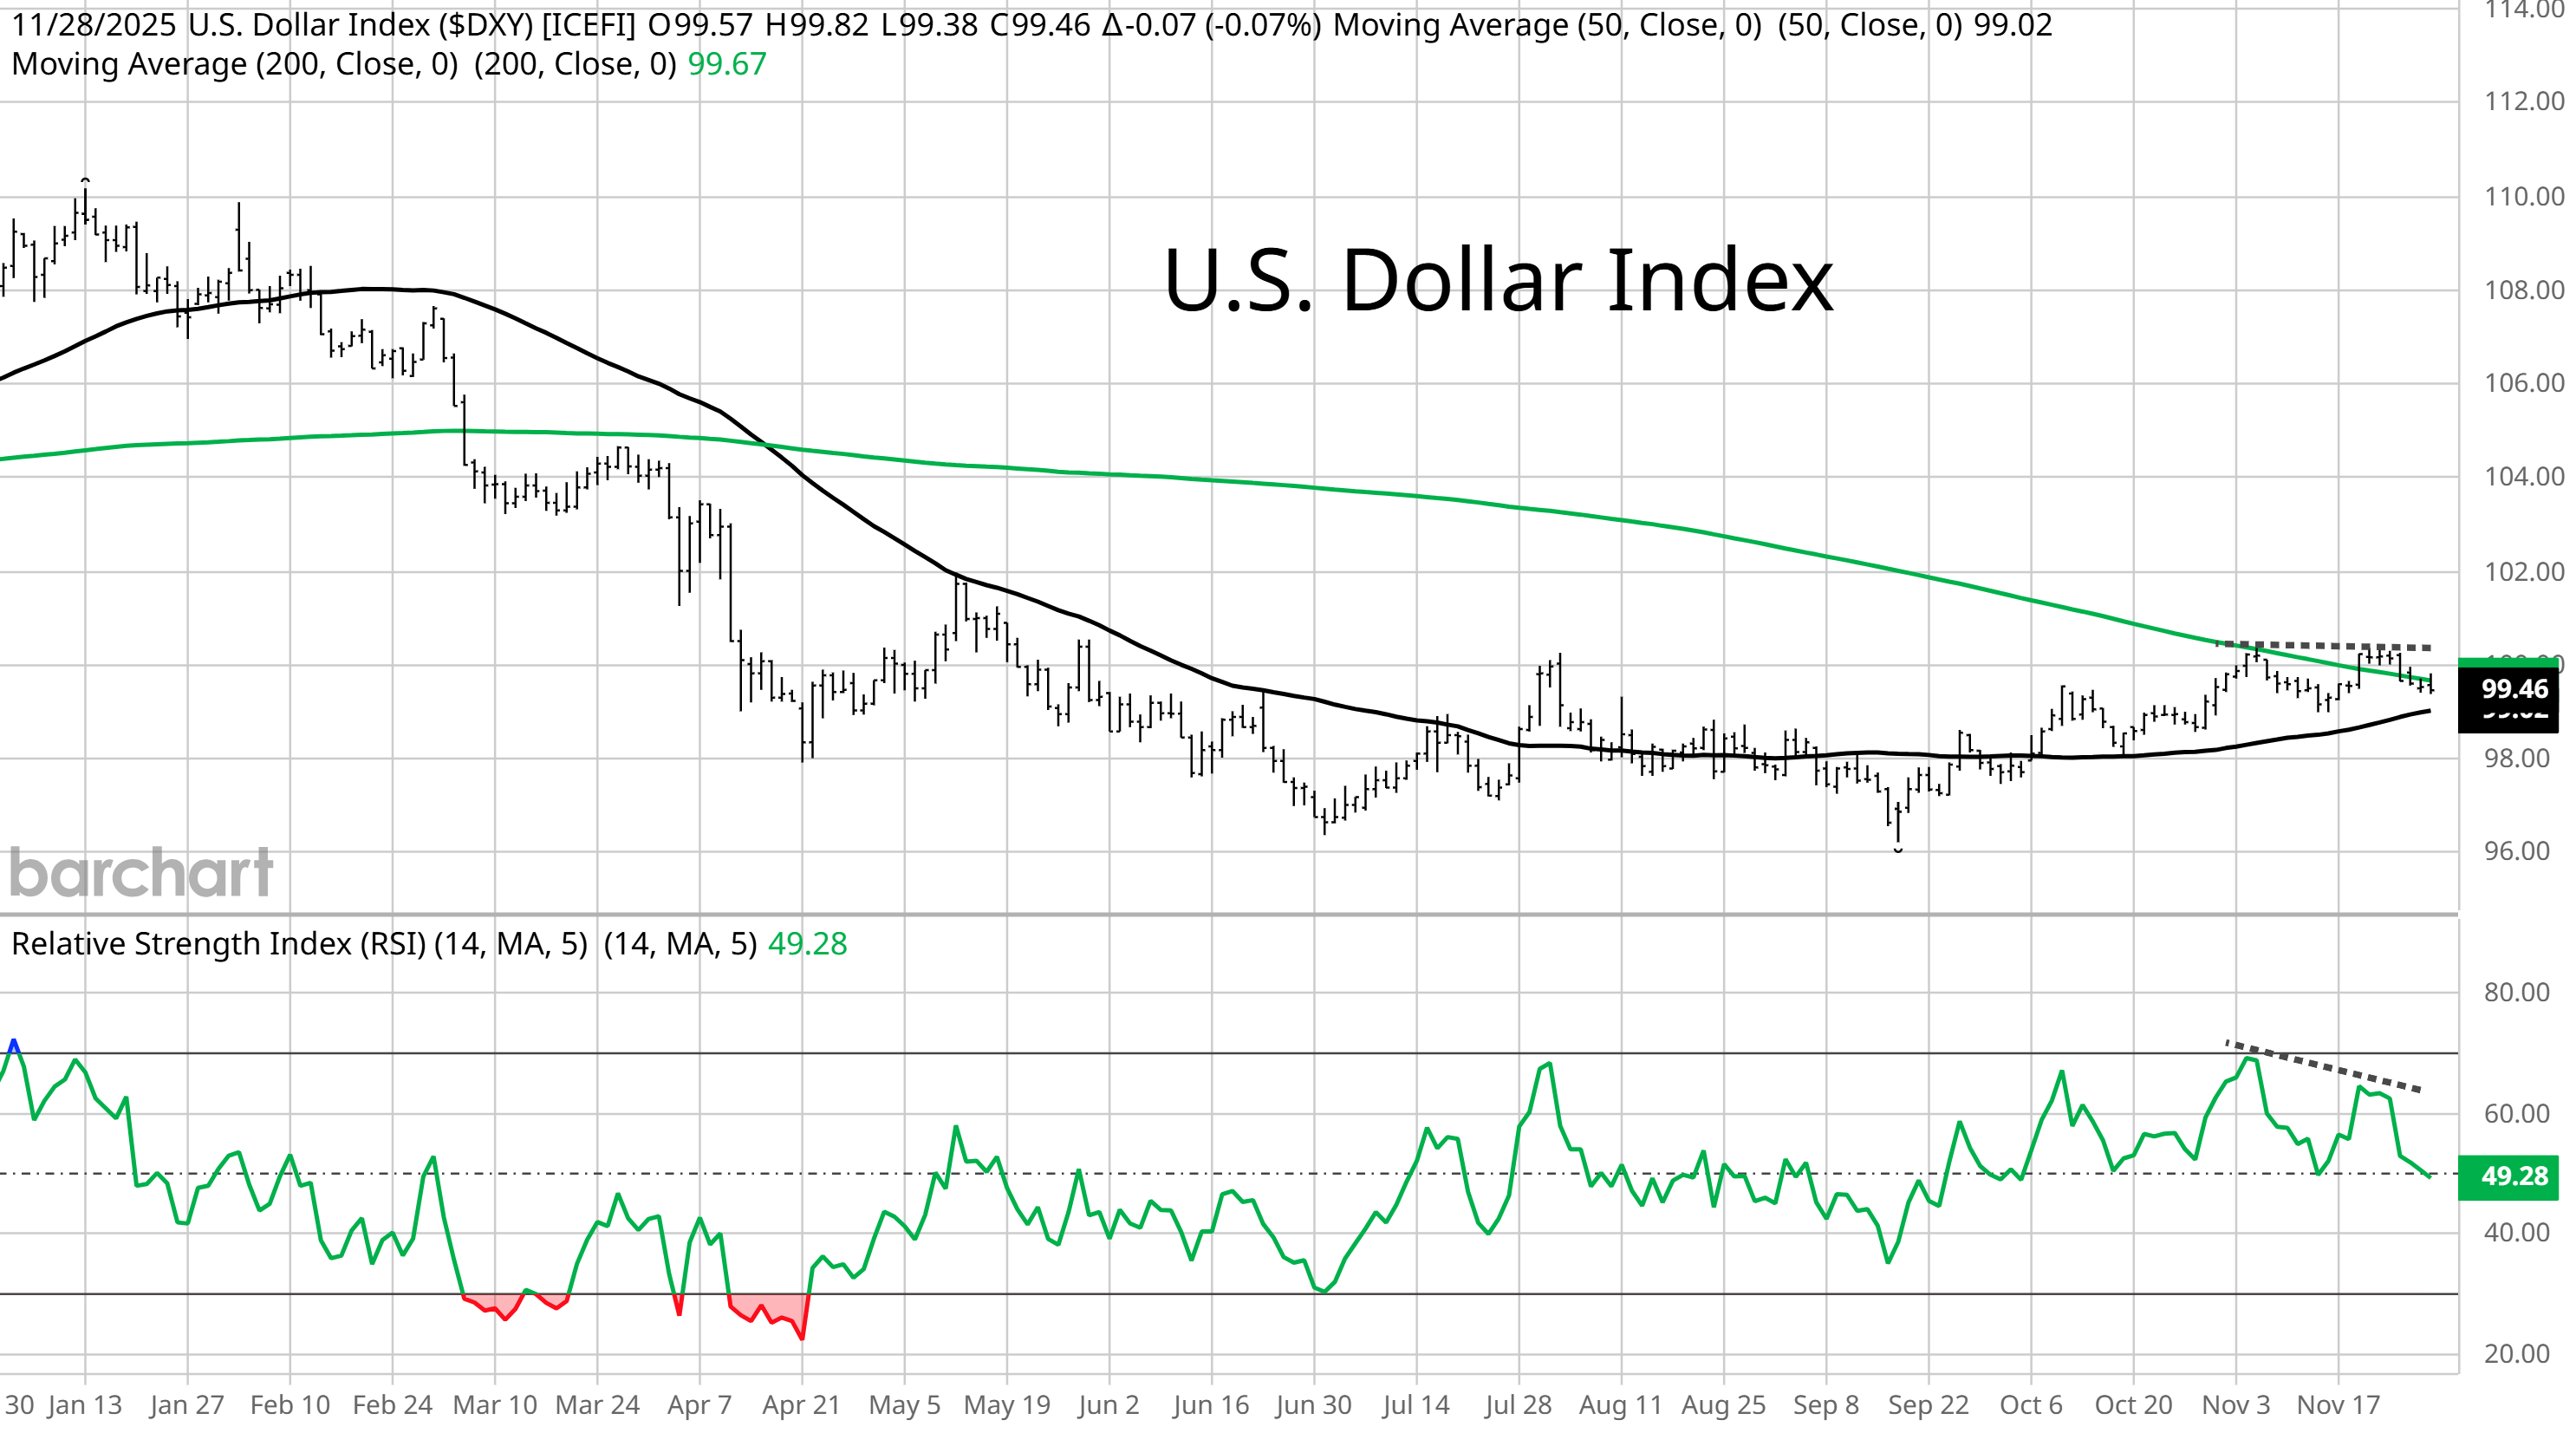
Another factor that could boost precious metals, including gold and silver, is bearish action in the U.S. Dollar Index (DXY). At one point this year, the dollar was off to a historically weak start. Concerns over currency debasement along with commodities being priced and traded in U.S. dollars were tailwinds for gold and silver as DXY fell during the first half of 2025. You can see in the chart below that DXY has stabilized since the middle of the year, but now another potentially bearish pattern could be developing. Just as DXY is testing the 200-day MA, the RSI in the bottom panel is making a lower high as DXY trades back to the 100 level (shown with the dashed trendlines). If the negative momentum divergence sparks another downside move in DXY, then dollar weakness would become a tailwind for precious metals once again.
Heard in the Hub
The Traders Hub features live trade alerts, market update videos, and other educational content for members.
Here’s a quick recap of recent alerts, market updates, and educational posts:
Why the Fed could be making a policy error.
The narrative behind recent market volatility.
One indicator suggesting the “wall of worry” remains.
The key takeaway for the economy from 3Q earnings season.
How to separate signal from noise when it comes to monetary policy.
You can follow everything we’re trading and tracking by becoming a member of the Traders Hub.
By becoming a member, you will unlock all market updates and trade alerts reserved exclusively for members.
🚨Gold mining stocks could be setting up another round of breakouts. Hub members are currently sitting on gains of 160% and 89% on mining positions. Check out the special offer below to join the Hub today!
👉You can click here to join now👈
Trade Idea
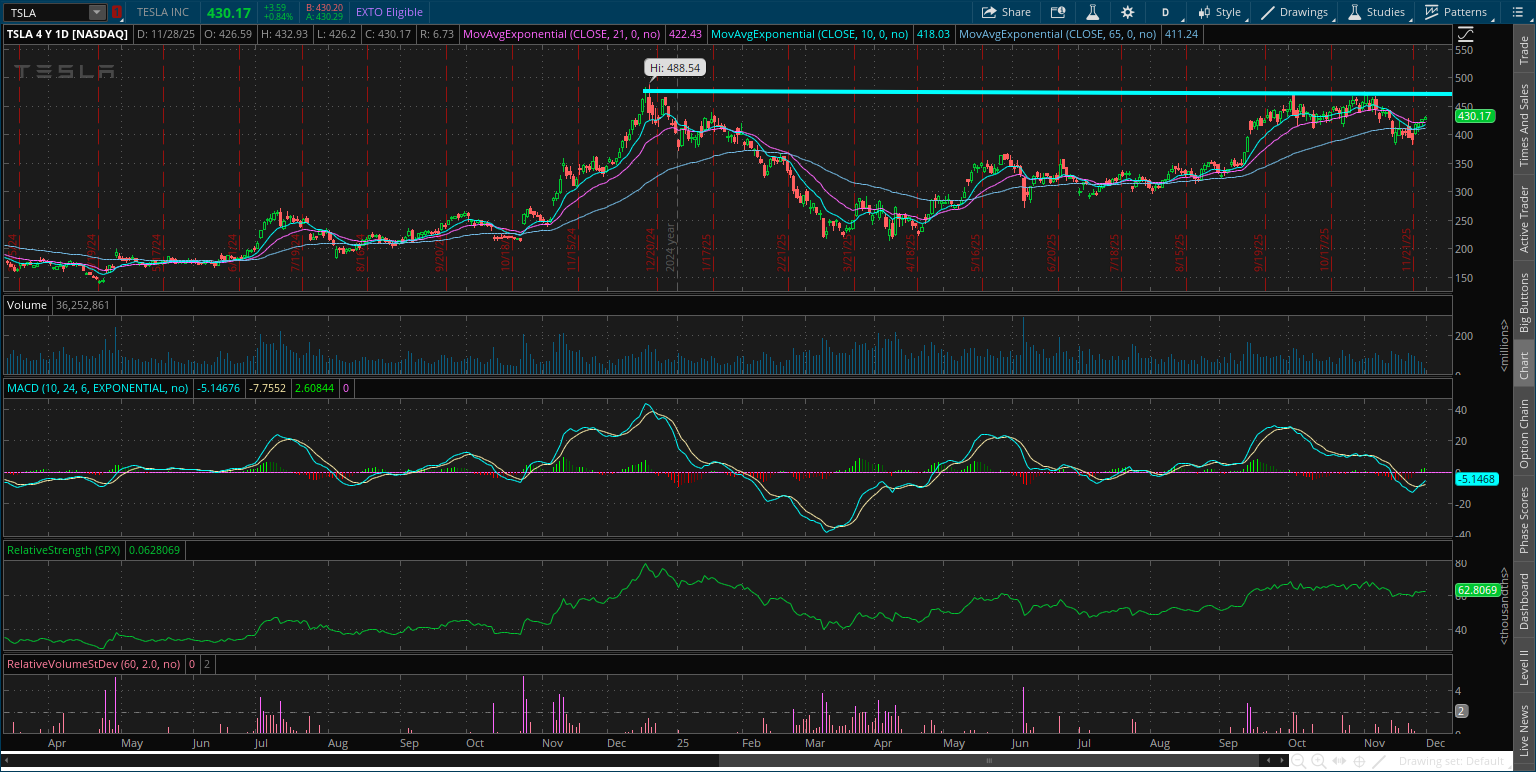
Tesla (TSLA)
After running to new record highs around the $490 level in December, TSLA started a new basing period. The stock is recently making a smaller pullback after testing an area close to the prior highs, but need to see the MACD recover above zero. I’m watching for a breakout to new record highs.
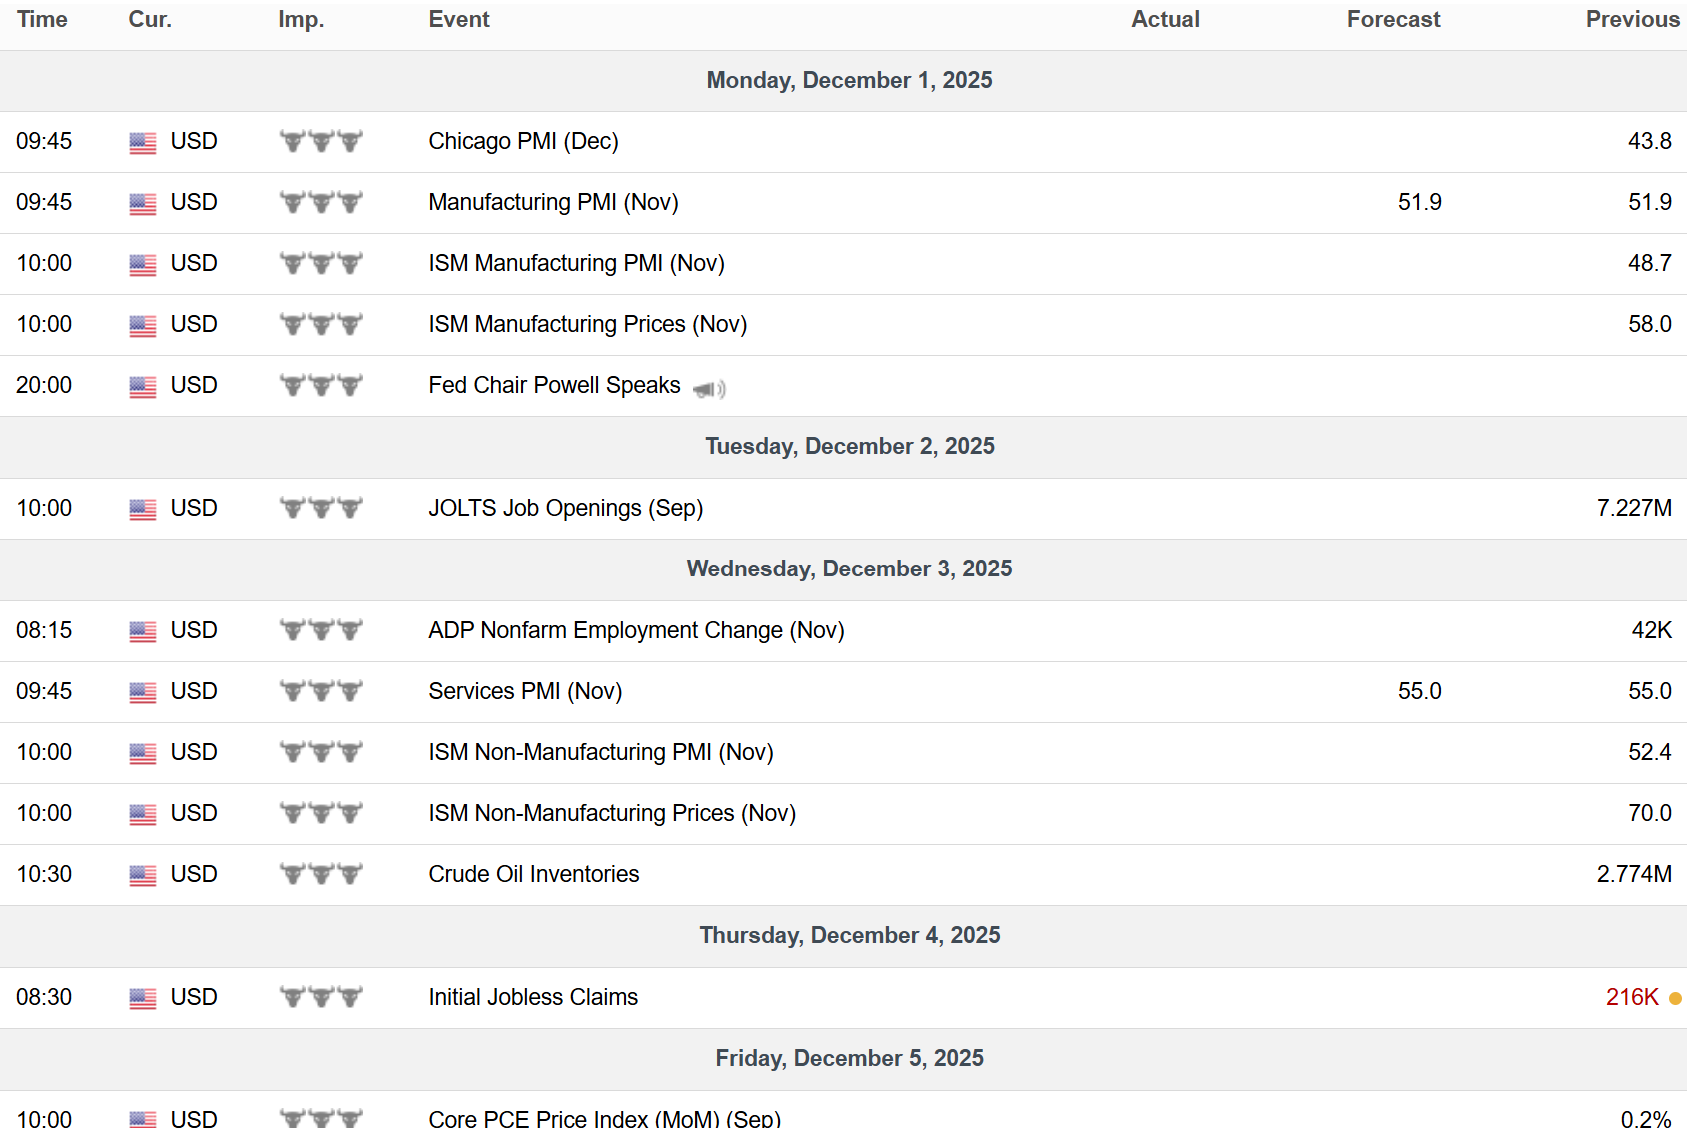
Key Upcoming Data
Economic Reports
Earnings Reports

I hope you’ve enjoyed The Market Mosaic, and please share this report with your family, friends, coworkers…or anyone that would benefit from an objective look at the stock market.
Become a member of the Traders Hub to unlock access to:
✅Model Portfolio
✅Members Only Chat
✅Trade Ideas & Live Alerts
✅Mosaic Vision Market Updates + More
Our model portfolio is built using a “core and explore” approach, including a Stock Trading Portfolio and ETF Investment Portfolio.
Come join us over at the Hub as we seek to capitalize on stocks and ETFs that are breaking out!
And if you have any questions or feedback, feel free to shoot me an email at mosaicassetco@gmail.com
Disclaimer: these are not recommendations and just my thoughts and opinions…do your own due diligence! I may hold a position in the securities mentioned in this report.