
The Market Mosaic 11.23.25
Stocks Oversold: Could This Signal a Rally Heading into Year-End?

👋Welcome back to The Market Mosaic, where I gauge the stock market’s next move by looking at macro, technicals, and market internals. I’ll also highlight trade ideas using this analysis.
If you find this report helpful please hit that “like” button, share this post, and become a subscriber if you haven’t already done so!
🚨And be sure to check out Mosaic Traders Hub. It’s a members-only platform to alert trade ideas, track a model portfolio of open positions, and further analyze the message coming from the capital markets (👇be sure to check out our special offer below).
Now for this week’s issue…
Despite a stellar earnings report from the bellwether behind the artificial intelligence (AI) trade, investors are growing more concerned about the outlook for monetary policy.
Nvidia (NVDA) easily surpassed analyst expectations when it reported earnings per share of $1.30 (up 67% year-over-year) on revenues of $57 billion for the company’s third quarter. Nvidia estimates fourth quarter revenue to come in at $65 billion compared to analyst estimates of $61.6 billion on average.
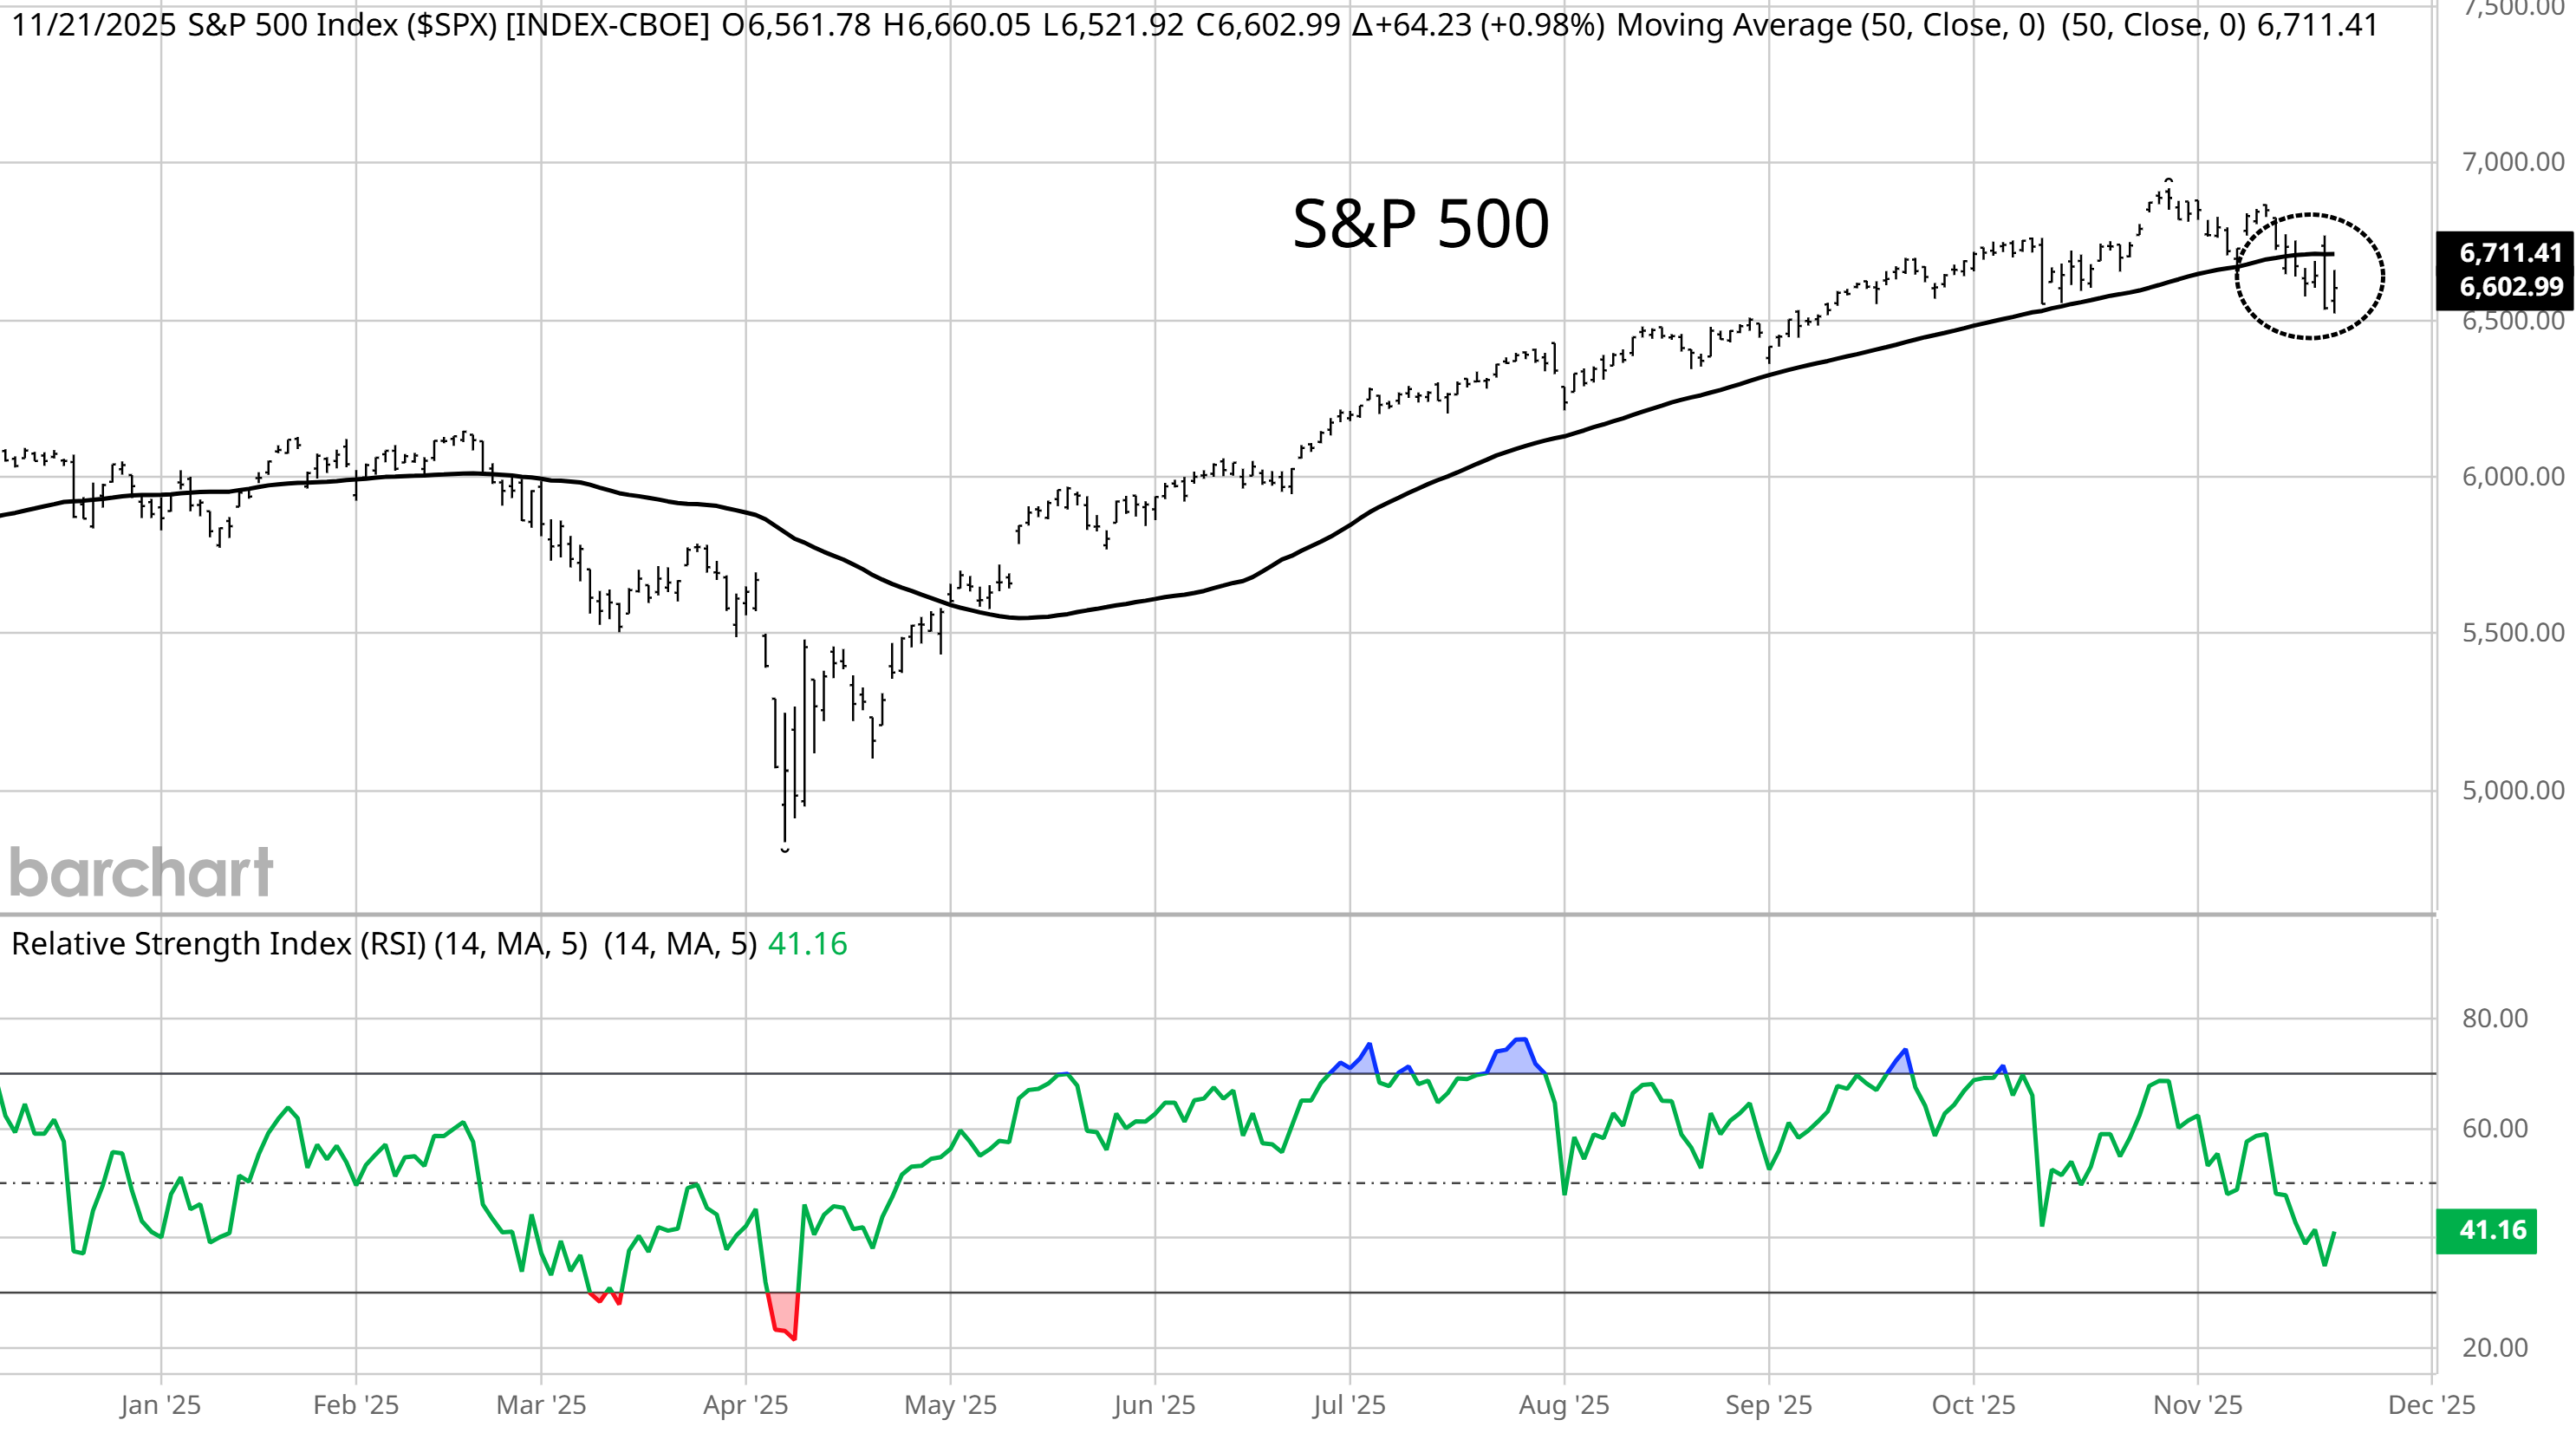
A jump in the stock helped spark a rally across the market, but the move was quickly reversed as investor focus shifted to the outlook for rate cuts by the Federal Reserve. That kept the S&P 500 stuck below the 50-day moving average (MA), with the RSI hitting the lowest level since the trade war selloff in April (chart below).
While Nvidia CEO Jensen Huang rejected the idea of an AI bubble, there’s no denying that valuations across the market are running well above average which makes stock prices more sensitive to the rate outlook.
Stubbornly high inflation and more evidence of an accelerating economy are creating uncertainty for additional rate cuts. The delayed September payrolls report showed 119,000 jobs were added during the month and was higher than expected. Other indicators also point to solid economic growth.
The minutes of the Fed’s most recent rate-setting meeting also noted that “many participants” suggested that it would be appropriate to “keep the target range unchanged for the rest of the year” regarding the fed funds rate.
But while excessive valuations and rate uncertainty are a concern, stock prices ultimately follow earnings over the long run which depends on evidence of a growing economy.
Recent conditions across breadth are also favoring a rally, which comes as seasonality turns into a big tailwind during this holiday-shortened week. There are already signs late last week that buying pressure is rising.
This week, lets look at historically elevated valuation measures and why that leaves stock prices exposed to the rate outlook. We’ll also look at the corporate earnings variable behind stock prices, and why conditions favor a rally into year-end.
The Chart Report
While Nvidia’s blowout earnings report and forecast show demand for AI applications remains strong, stock prices across the market are rising quicker than profits which is pushing valuations to record levels. The S&P 500’s forward P/E ratio currently trades at 22.9, which is 34% above the 30-year average and has only been higher during the internet bubble. Other valuation measures are at record highs, which is pushing a composite valuation measure to levels never seen before. The chart below shows the average percentile ranking for various valuation ratios, and is higher than at any point in history.

Elevated valuations are making stock prices especially sensitive to the outlook for interest rates, which impacts borrowing costs and the mechanism for discounting future expected earnings back to present value terms. Concerns over the pace and magnitude of Fed rate cuts are weighing on stock prices over the past month. But ultimately, the S&P 500 follows corporate earnings over the long-term which comes down to the performance of the economy. Evidence continues pointing to an economy holding up just fine. The delayed September payrolls report showed surprisingly strong jobs growth, while real time estimates of retail sales are near the highest levels of the past three years. And the Atlanta Fed’s GDPNow estimate is currently forecasting third quarter annualized GDP growth at 4.2% (chart below).

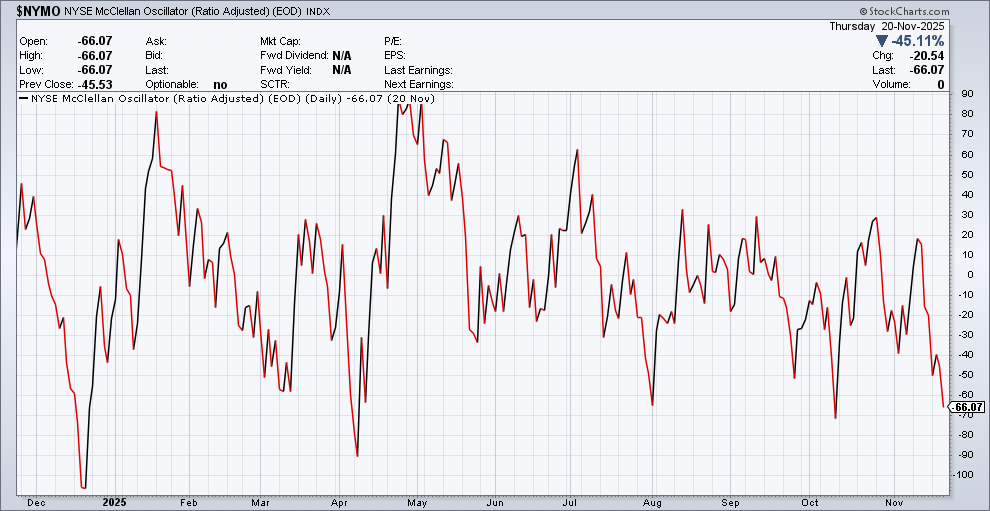
Concerns over the interest rate outlook is weighing on the S&P 500, with the index down as much as 5% off the late October peak. But the action under the stock market’s hood has been much worse. At one point last week, the percent of stocks across the market trading above their 20-day moving average hit just 25% which is among the lowest levels seen this year. Other breadth metrics are hitting oversold levels, including the NYSE McClellan Oscillator that measures advancing versus declining stocks on the NYSE over a trailing period. You can see in the chart below that the oscillator hit one of the lowest levels seen over the past year.
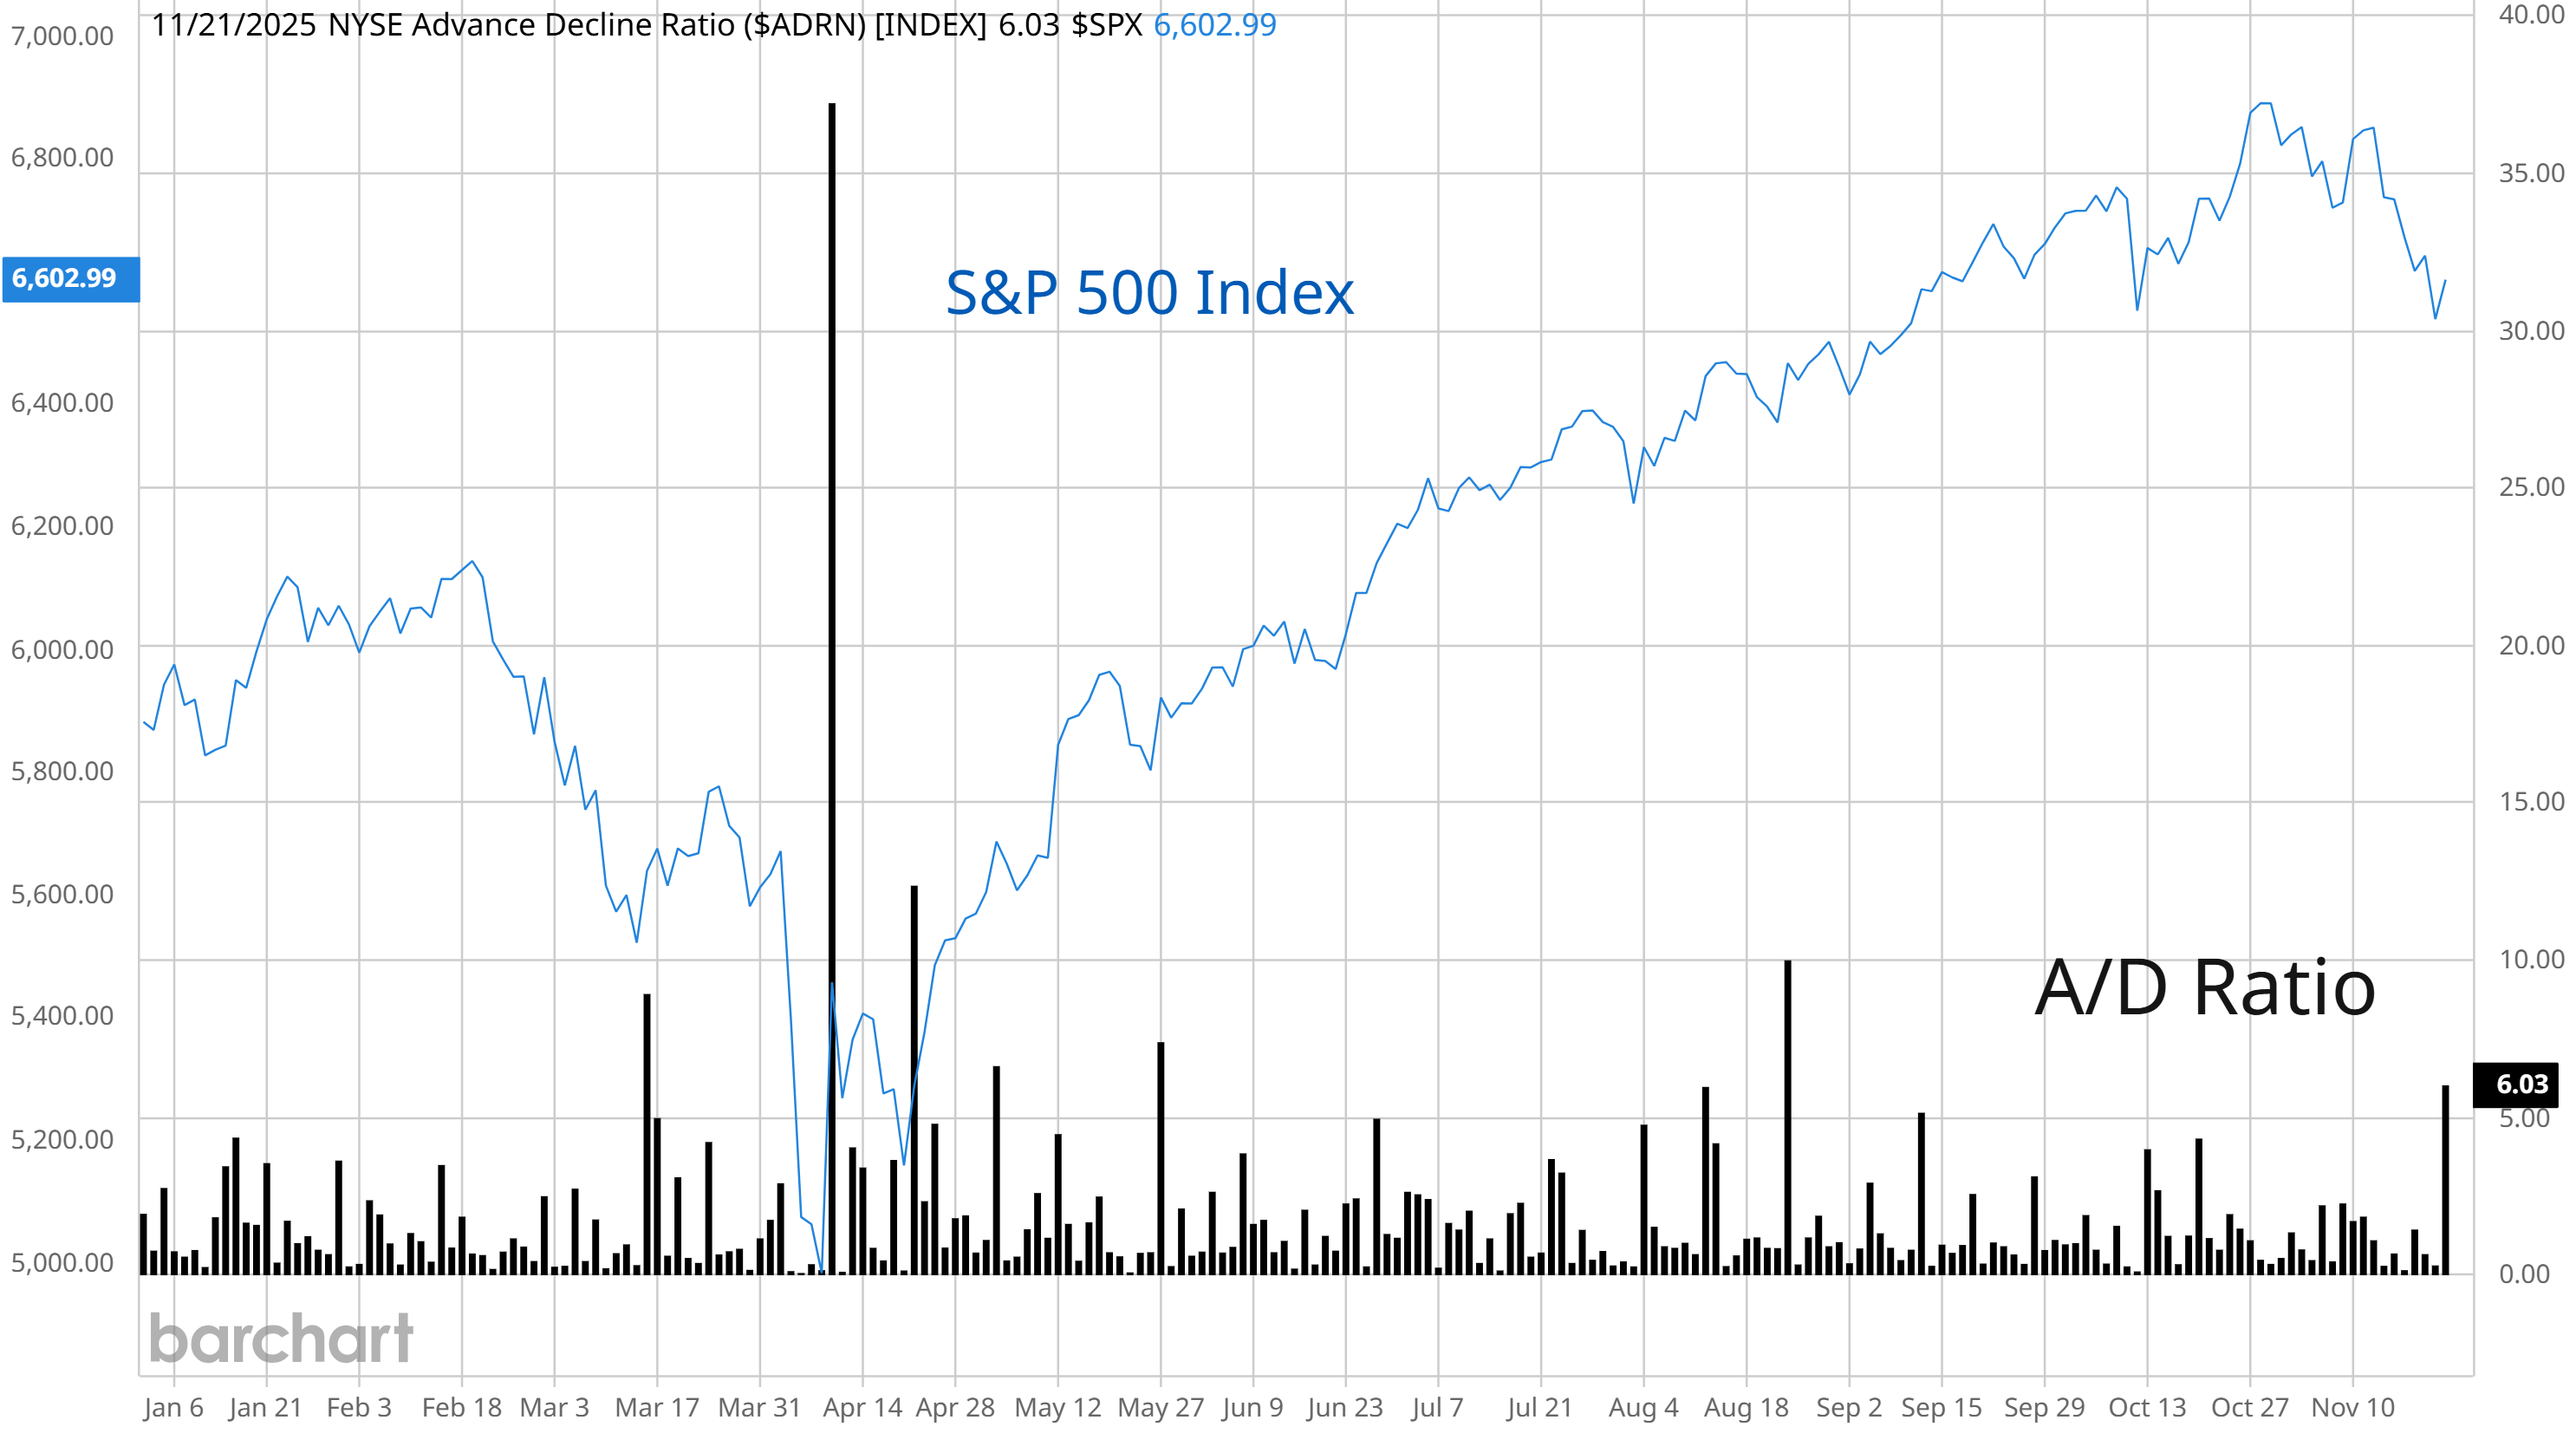
Conditions across breadth and sentiment are evolving favorably for a rally into year end. As noted above, breadth indicators are extending into oversold territory while several measures of investor sentiment are showing elevated levels of bearishness across the market. At the same time, the S&P 500 is entering a period of strong seasonality that starts just before Thanksgiving in the U.S. and runs through the start of the New Year. There could be early evidence that the selloff has gone too far and that buying pressure is starting to emerge. That includes Friday’s reading on the NYSE advance/decline ratio that hit 6.03/1, and means there were six advancing stocks for every decliner on the exchange. That was the strongest daily reading since the end of August.
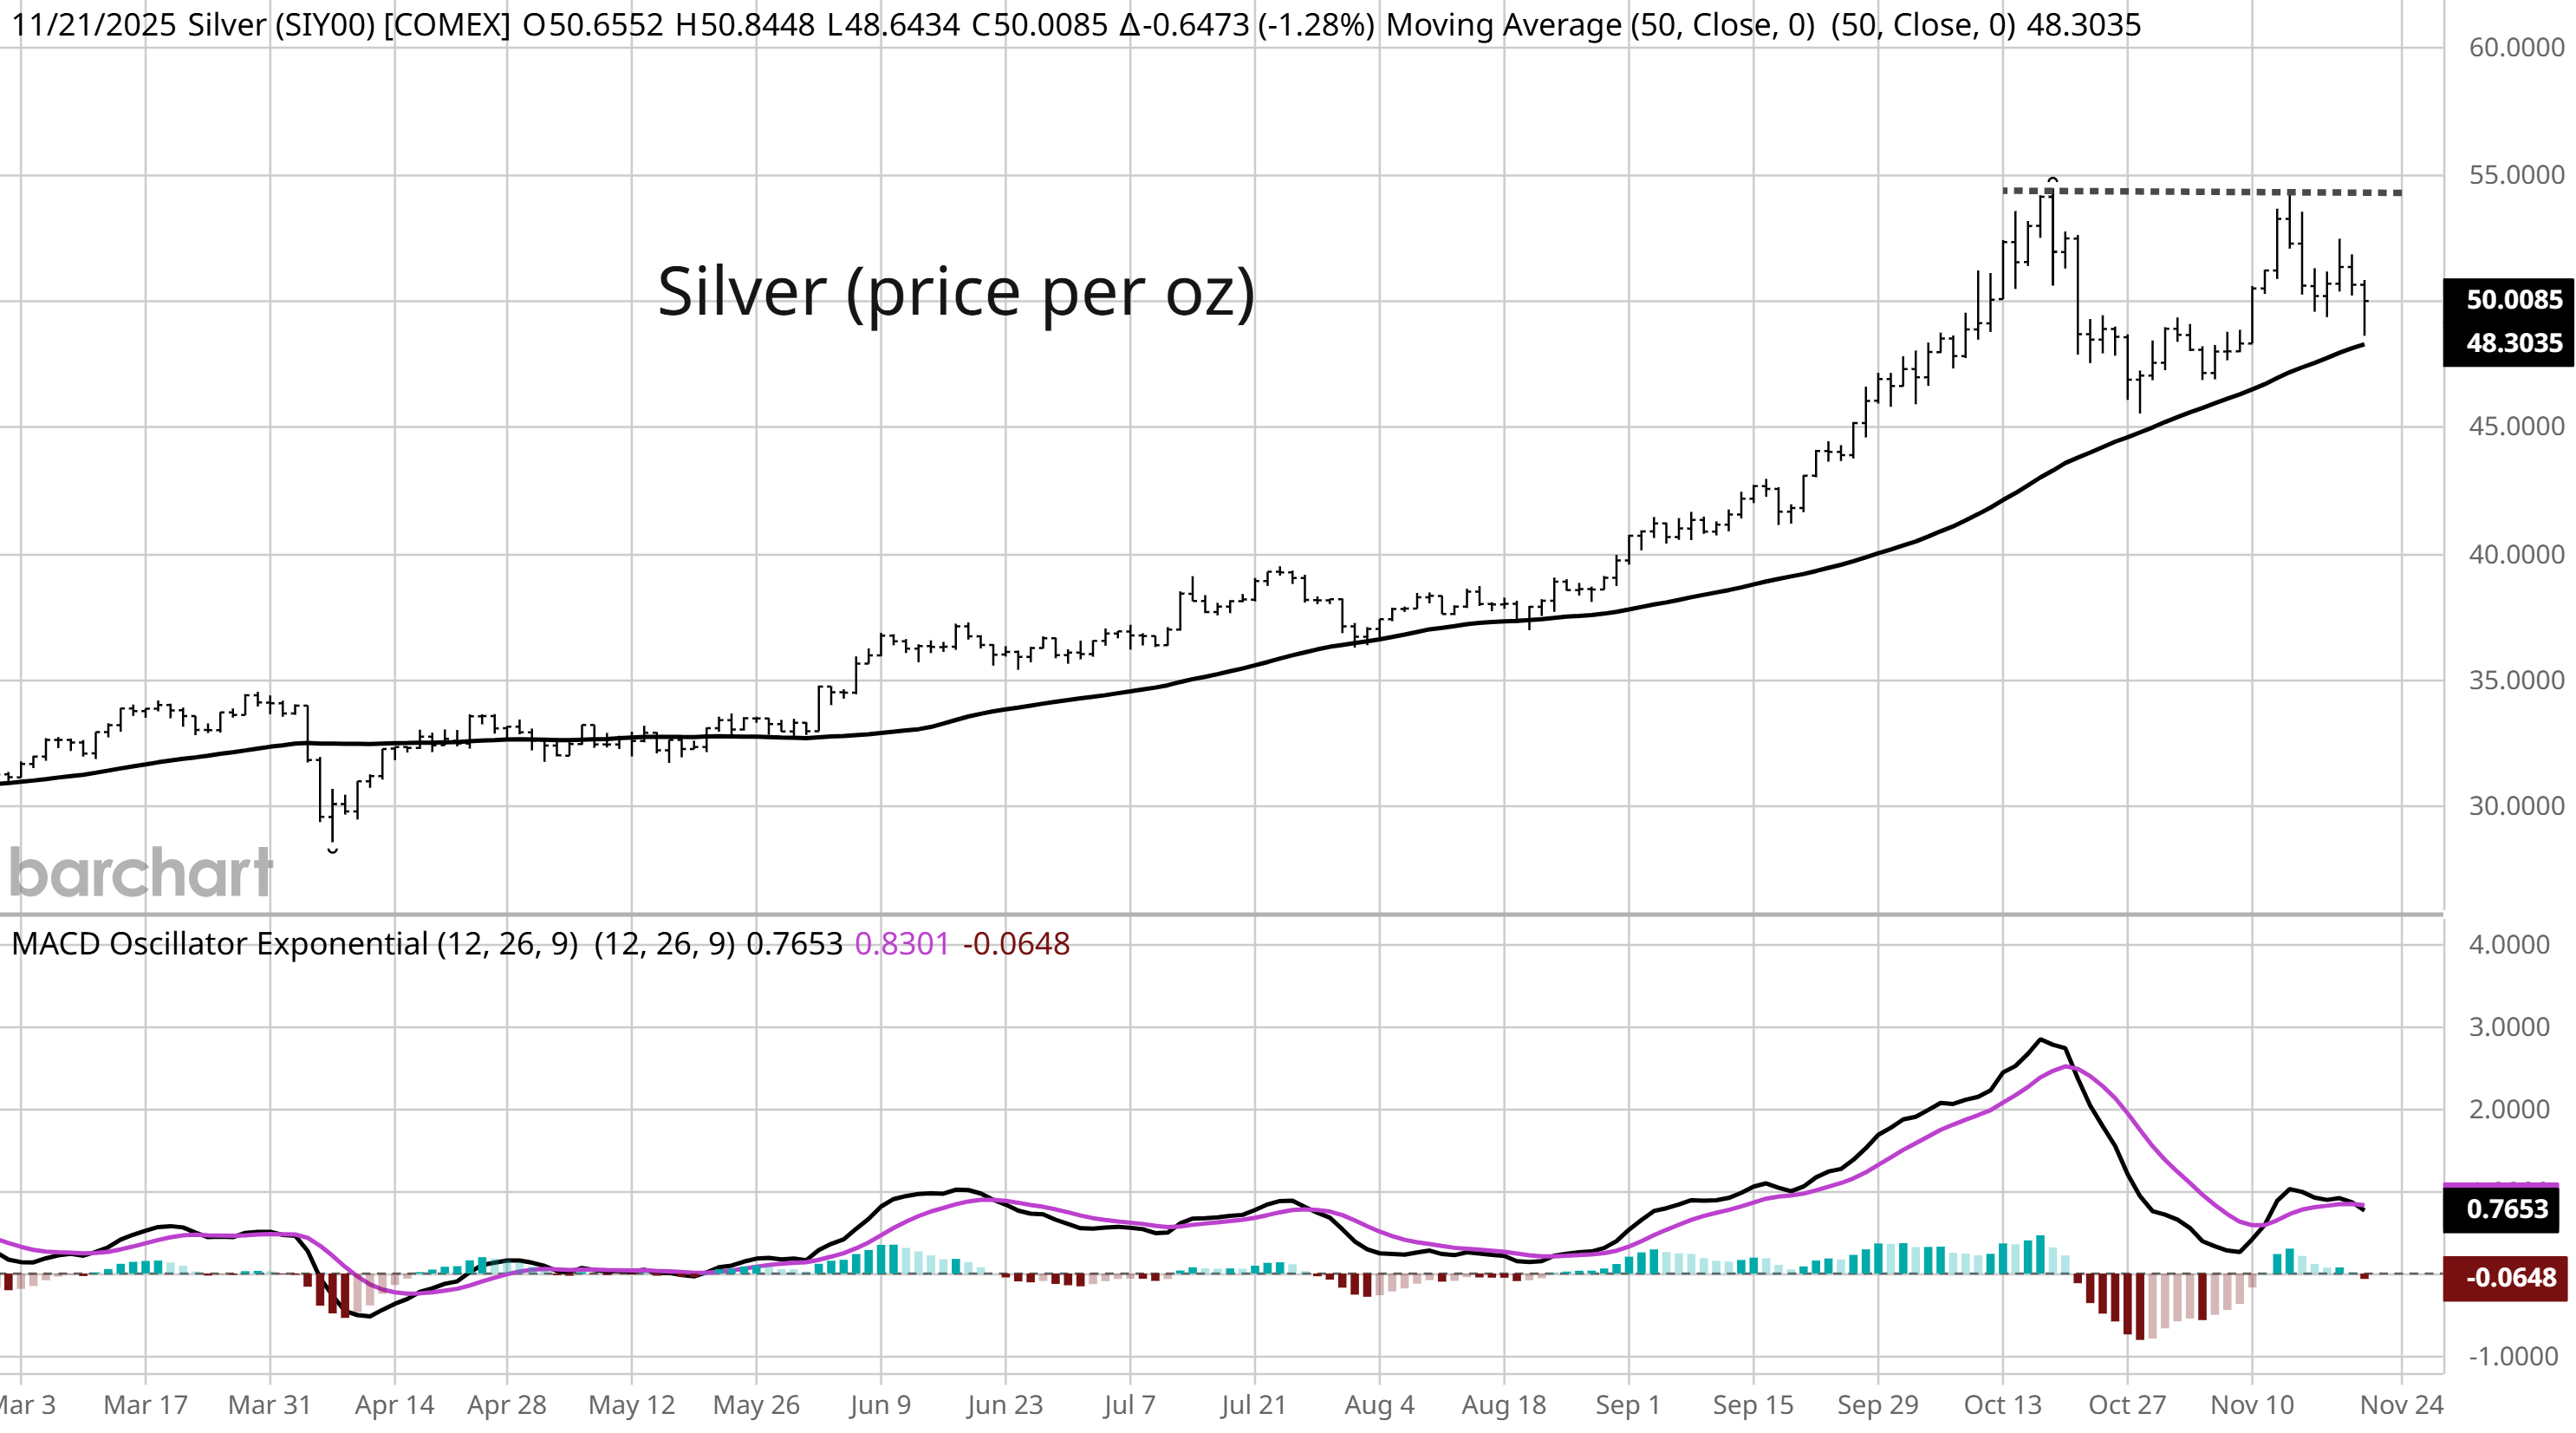
Precious metals are another market sector that has been consolidating this year’s gains. Gold prices topped out near $4,400 per ounce at the end of October and has been consolidating above its 50-day MA. But silver could present a more compelling setup if a new basing period delivers another breakout in prices. That’s because silver’s consolidation is occurring right at the prior record highs seen around the $50 per ounce level. That level was tested in 1980 and 2011, with both instances seeing a large drawdown in silver prices following a parabolic move higher. This time, silver is showing a constructive basing process with a recent smaller pullback off the $54 resistance level while support at the 50-day MA is being held (chart below).
Heard in the Hub
The Traders Hub features live trade alerts, market update videos, and other educational content for members.
Here’s a quick recap of recent alerts, market updates, and educational posts:
Why stocks are sensitive to interest rates.
Breaking down S&P 500 breadth by sector.
One measure pointing to the biggest bubble ever.
Silver’s pattern that could tip a breakout to record highs.
How to use weekly charts to identify the state of the trend (must watch!).
You can follow everything we’re trading and tracking by becoming a member of the Traders Hub.
By becoming a member, you will unlock all market updates and trade alerts reserved exclusively for members.
🚨Gold mining stocks could be setting up another round of breakouts. Hub members are currently sitting on gains of 140% and 77% on mining positions. Check out the special offer below to join the Hub today!
👉You can click here to join now👈
Trade Idea
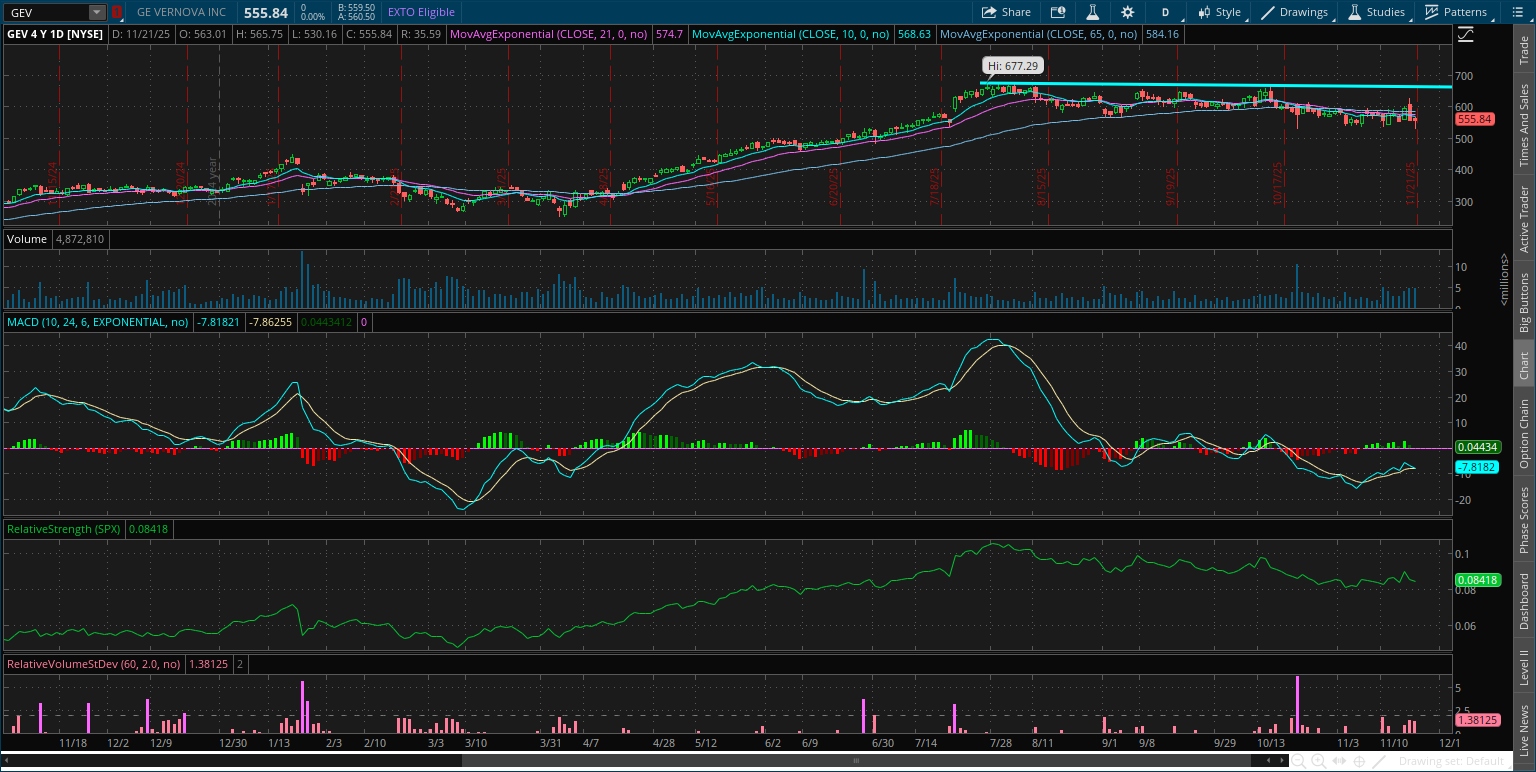
GE Vernova (GEV)
Rallied to the $675 level in July and now forming a new basing pattern. The stock is trading in a relatively tight range but need to see the MACD back above zero. Watching for a move above $675.
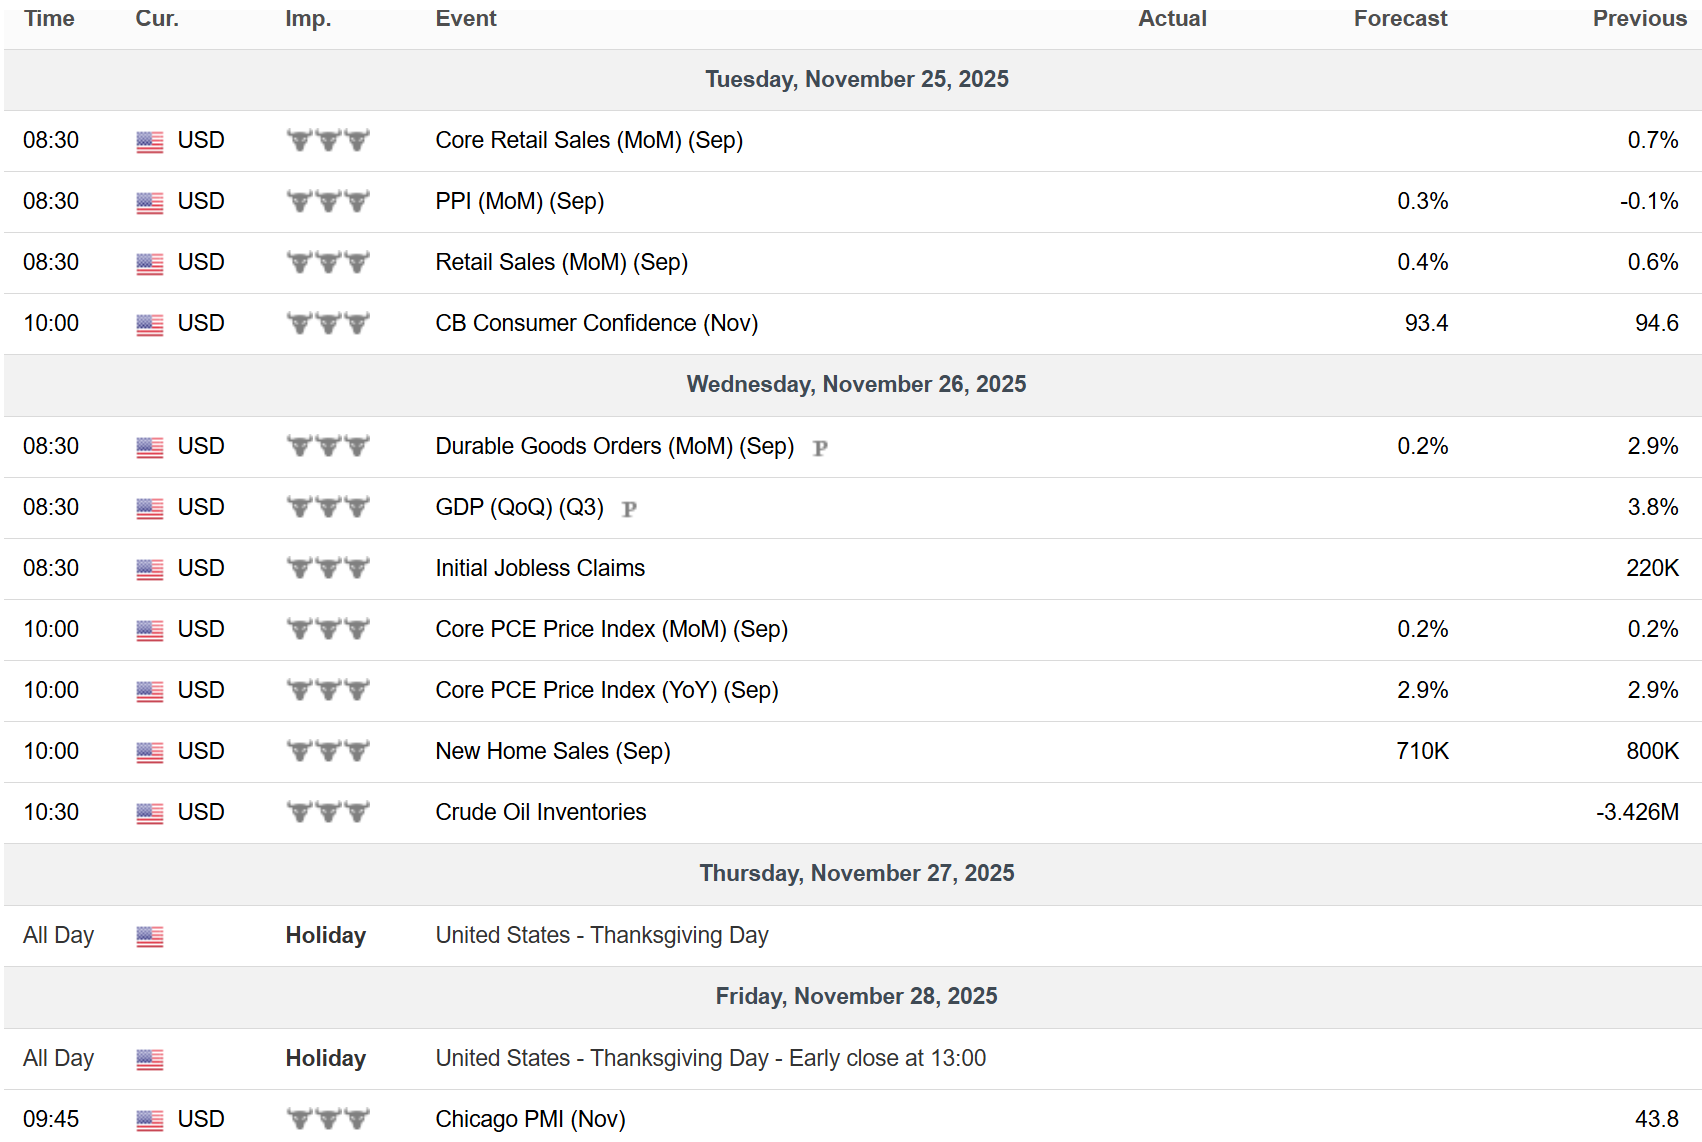
Key Upcoming Data
Economic Reports
Earnings Reports

I hope you’ve enjoyed The Market Mosaic, and please share this report with your family, friends, coworkers…or anyone that would benefit from an objective look at the stock market.
Become a member of the Traders Hub to unlock access to:
✅Model Portfolio
✅Members Only Chat
✅Trade Ideas & Live Alerts
✅Mosaic Vision Market Updates + More
Our model portfolio is built using a “core and explore” approach, including a Stock Trading Portfolio and ETF Investment Portfolio.
Come join us over at the Hub as we seek to capitalize on stocks and ETFs that are breaking out!
And if you have any questions or feedback, feel free to shoot me an email at mosaicassetco@gmail.com
Disclaimer: these are not recommendations and just my thoughts and opinions…do your own due diligence! I may hold a position in the securities mentioned in this report.
Wow, the part about Nvidia's incredible numbers quickly being overshadowed by Fed rate concerns really stood out to me, and it makes me wonder if perhaps teh market tends to underappreciate the long-term fundamental shifts driven by AI while focusing so much on macro swings.