The Market Mosaic 1.1.23
Stock market rally incoming? Breadth and sentiment can support a move higher.
Welcome back to The Market Mosaic, where I gauge the stock market’s next move by looking at macro, technicals, and market internals. I’ll also highlight one or two trade ideas using this information.
If you find this content helpful please hit that “like” button, share this post, and become a subscriber to this always free newsletter if you haven’t already done so!
Also, be sure to check out Mosaic Chart Alerts. It’s a midweek update covering my best chart setups among long and short ideas in the stock market, along with specific levels that would trigger a trade.
First, I want to wish you a Happy New Year and send my best wishes for a healthy and prosperous year ahead!
I started The Market Mosaic last year as an outlet for expressing my views and to help others navigate the stock market. My hope is that my analysis supports your own trading plan, and will continue to do so in 2023.
Now for this week’s issue…
With 2022 officially in the rearview, the year was one for the record books…but not in a good way.
The cornerstone retirement portfolio comprised of 60% stocks and 40% bonds suffered a loss of 17.5%. That’s the largest drop since 1937 and the third worst year in history according to Charlie Bilello:
Stock indexes were dragged lower by some of the last bull’s biggest winners. That includes Tesla’s worst-ever 65% plunge, which helped pull the S&P 500 19% lower.
That’s the S&P’s worst showing since 2008, with other heavyweights like Amazon, Google, and Microsoft posting sharp declines in 2022 as you can see in the chart below.
So what does 2023 have in store? I’ve previously laid out key catalysts that I believe will drive the market going forward, mostly notably the deteriorating outlook for the economy and earnings picture that I discussed here.
But when it comes to a price target for the S&P 500, I’m not going there. I have no idea where the S&P 500 will finish one year from today…or one month from today.
I learned long ago that you don’t need to predict in order to be a successful trader. When it comes to trading, it pays to read and react to the current situation and not be captive to what you think the market should do.
And when I analyze conditions today, market internals are becoming more favorable for a rally. Here’s what I’m watching and why it matters.
Conditions for a Rally
The final month of 2022 fit well with the year’s bear market theme. December’s rout took the S&P 500 nearly 6% lower. But the pullback didn’t catch us by surprise.
We were well aware of the warning signals coming from breadth metrics that I highlighted here as well as the lack of upside breakouts occurring with our long setups covered in Mosaic Chart Alerts.
But those same breadth indicators are now flashing positive divergences the other way. Here’s an updated chart of the percent of stocks trading above their 20-day moving average. This measures how many stocks are in short-term uptrends, which was deteriorating as the S&P marched higher into December (highlighted with the red lines).
But take a look at recent action. As the S&P is trading near the lows of this most recent drop, the percent of stocks in uptrends is moving higher (highlighted with the boxed area).
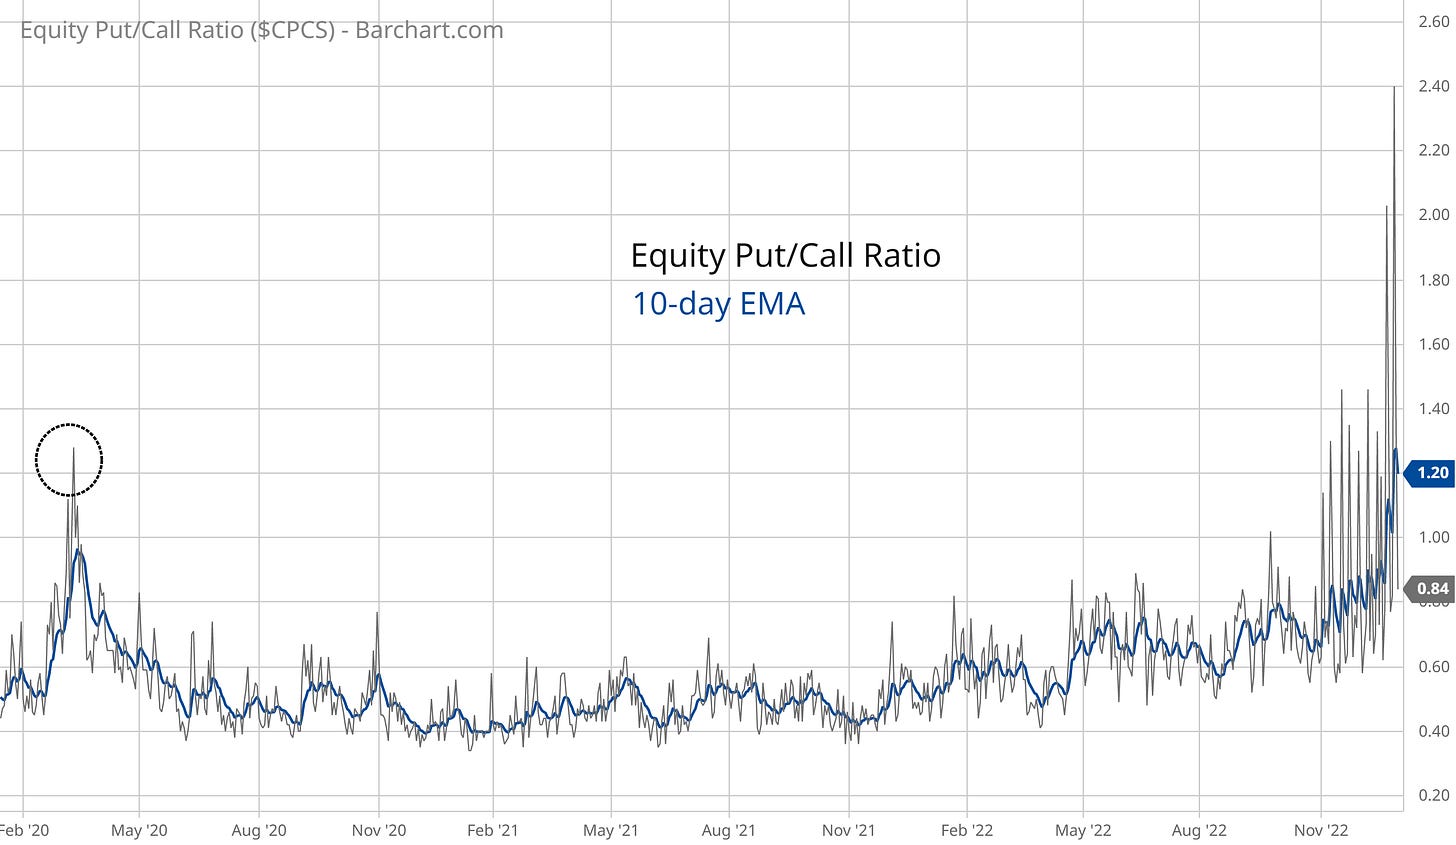
Also consider that sentiment finally getting more bearish, which is bullish. Sentiment works as a contrarian indicator and it pays to be aware of extreme bullishness or bearishness. There are many ways to track investor sentiment, such as surveys asking about investor attitudes toward the market.
But I prefer measures of how traders are actually using their own funds. One way is to look at how many puts are being purchased relative to calls, with spikes indicating a jump in bearish sentiment. Look at the recent action below in the put/call ratio, and compare that to the depths of 2020’s market selloff (circled area). With a spike above 2, this is one of the highest levels ever recorded and dwarfs the ratio seen in the last bear market.
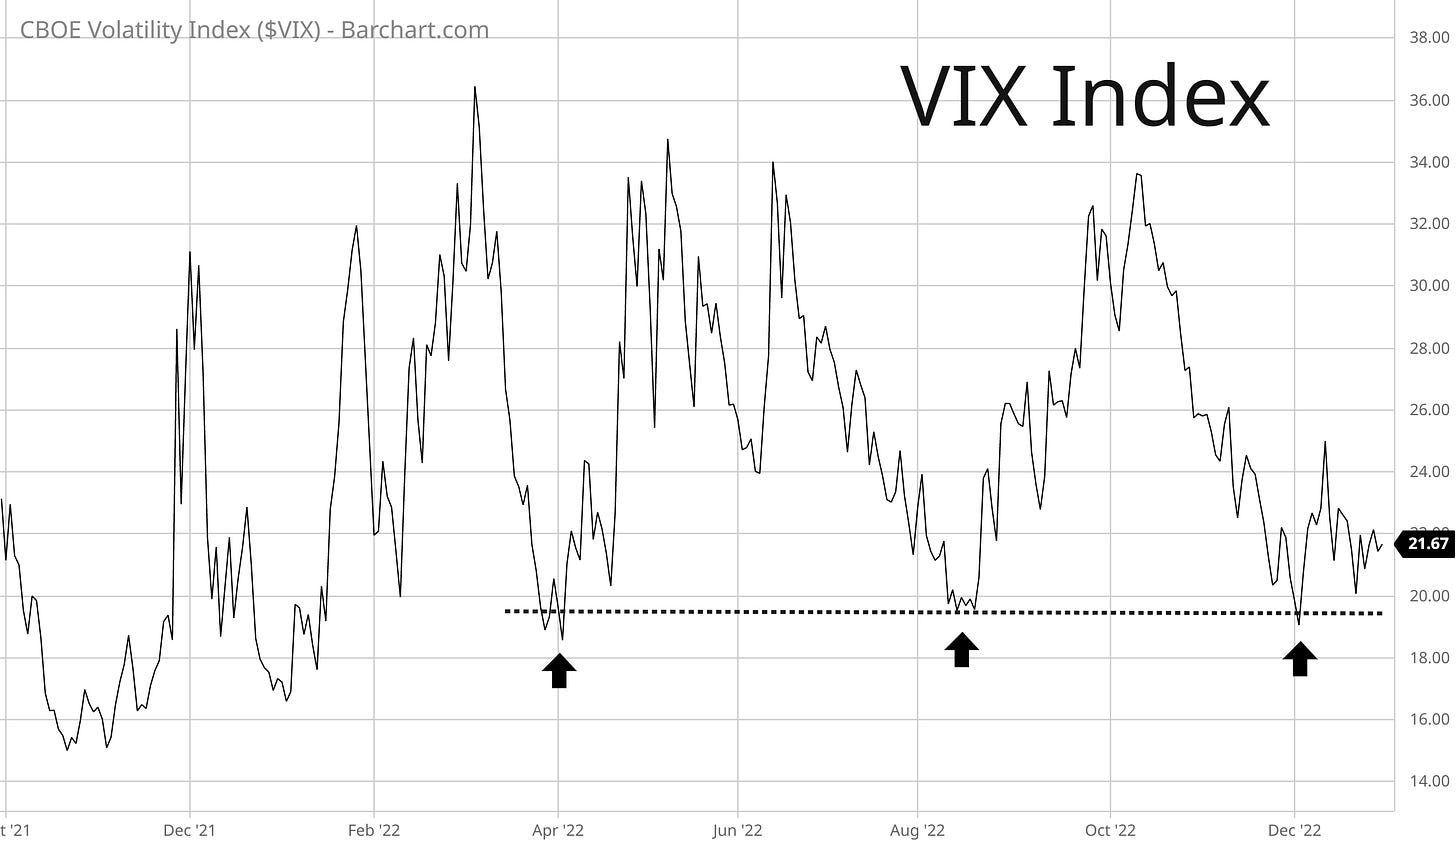
I also want to revisit an interesting setup with the Volatility Index (VIX). I track volatility because of how it influences buying and selling of equities by institutional strategies that target a certain risk level. When volatility falls, it can draw these funds back into the market. That’s why I’m still closely following VIX’s 19-20 level, which has served as support throughout this bear market.
Putting it all together, and I believe conditions among breadth and sentiment can support a potential rally to start the new year, which could see a boost if volatility levels collapse and draw institutional funds back into the market.
Now What…
Even if a rally gets underway, I continue to believe that we remain in a bear market. The Federal Reserve’s restrictive monetary policy continues to drain liquidity from the financial markets (which negatively impacts asset prices), and leading indicators of economic activity continue to deteriorate.
Plus defensive areas of the stock market continue showing leadership, as you can see in my post below about consumer staples relative to the broader market. Notice how this ratio fell throughout the last bull market into the end of 2021.
I will still take long setups that meet my criteria. But in bear markets, I position size more conservatively and am quicker to take gains when available.
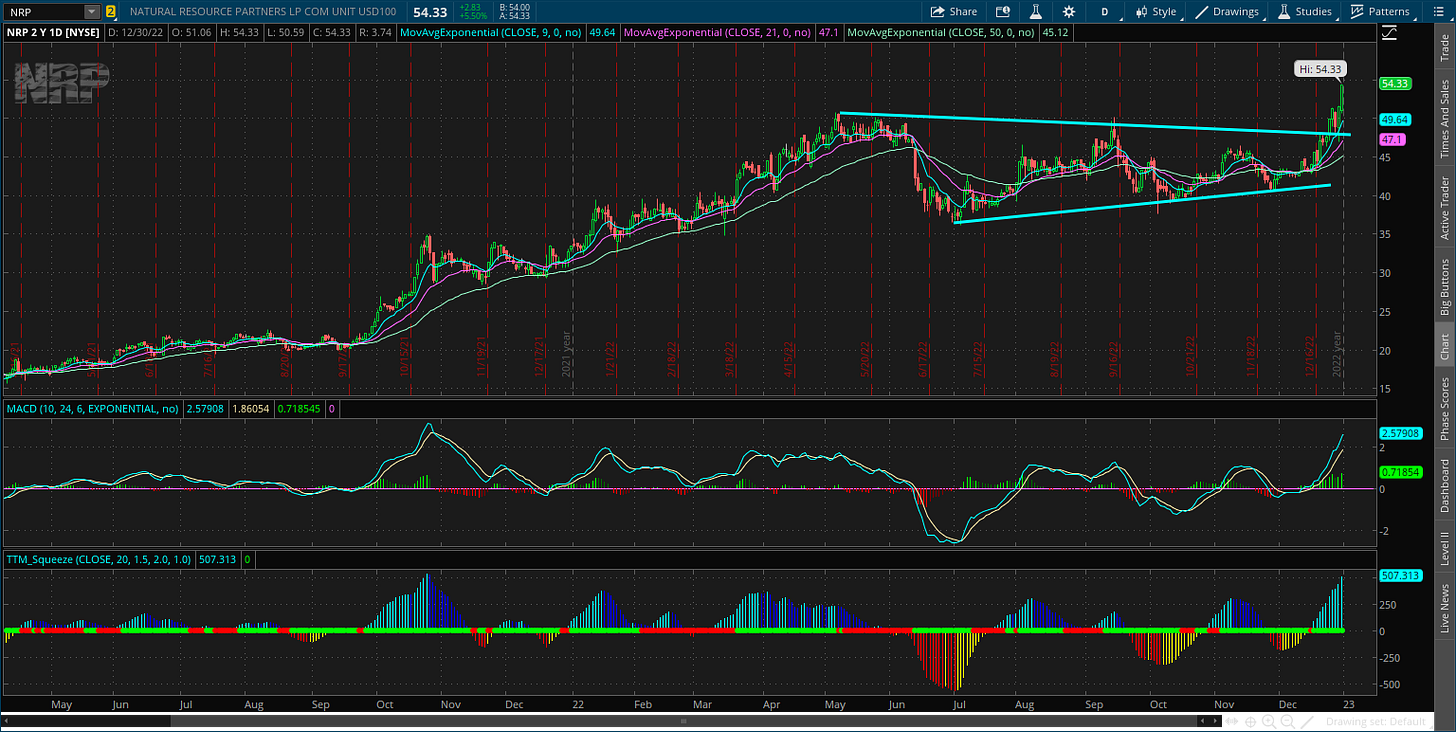
With the market’s December drop, my focus is on stocks showing relative strength. You’ve seen that with several names in the commodity and materials sector, like NRP’s breakout that I originally shared in Mosaic Chart Alerts.
I also like the setups developing in stocks that provide services to the oil and gas sector. That includes KLXE that I shared last week and HAL in this post below:
While my lean is for a rally to develop, I’m certainly not limiting myself to that view. The key is to stay objective and keep a tactical mindset as market conditions can change quickly…for better or worse.
I hope you’ve enjoyed this edition of The Market Mosaic, and please share this newsletter with anyone you feel could benefit from an objective look at the stock market.
And make sure you never miss an edition by subscribing here:
For updated charts, market analysis, and other trade ideas, give me a follow on Twitter: @mosaicassetco
And if you have any questions or feedback, feel free to shoot me an email at mosaicassetco@gmail.com
Disclaimer: these are not recommendations and just my thoughts and opinions…do your own due diligence! I may hold a position in the securities mentioned in this newsletter.


