
The Market Mosaic 11.16.25
Growth Stocks Feeling the Squeeze from Interest Rate Forecasts.

👋Welcome back to The Market Mosaic, where I gauge the stock market’s next move by looking at macro, technicals, and market internals. I’ll also highlight trade ideas using this analysis.
If you find this report helpful please hit that “like” button, share this post, and become a subscriber if you haven’t already done so!
🚨And be sure to check out Mosaic Traders Hub. It’s a members-only platform to alert trade ideas, track a model portfolio of open positions, and further analyze the message coming from the capital markets (👇be sure to check out our special offer below).
Now for this week’s issue…
A short-term funding agreement ended the longest government shutdown in U.S. history, but investors now have another challenge to the outlook for the bull market.
While President Trump signed a funding bill that ended the government shutdown at 43 days, several officials from the Federal Reserve are pushing back on expectations for another rate cut at the central bank’s final meeting in December.
That includes Boston Fed President Susan Collins who pointed to elevated inflation and economic resilience as reasons to keep rates steady. The comments echo remarks from other Fed presidents, and reinforces evidence that the Fed has become deeply divided on fighting inflation versus supporting the labor market.
Recent (and available) economic data is showing that the economy is not deteriorating as feared, while consumer inflation has held around the 3% level for over a year and remains well above the Fed’s 2% inflation target.
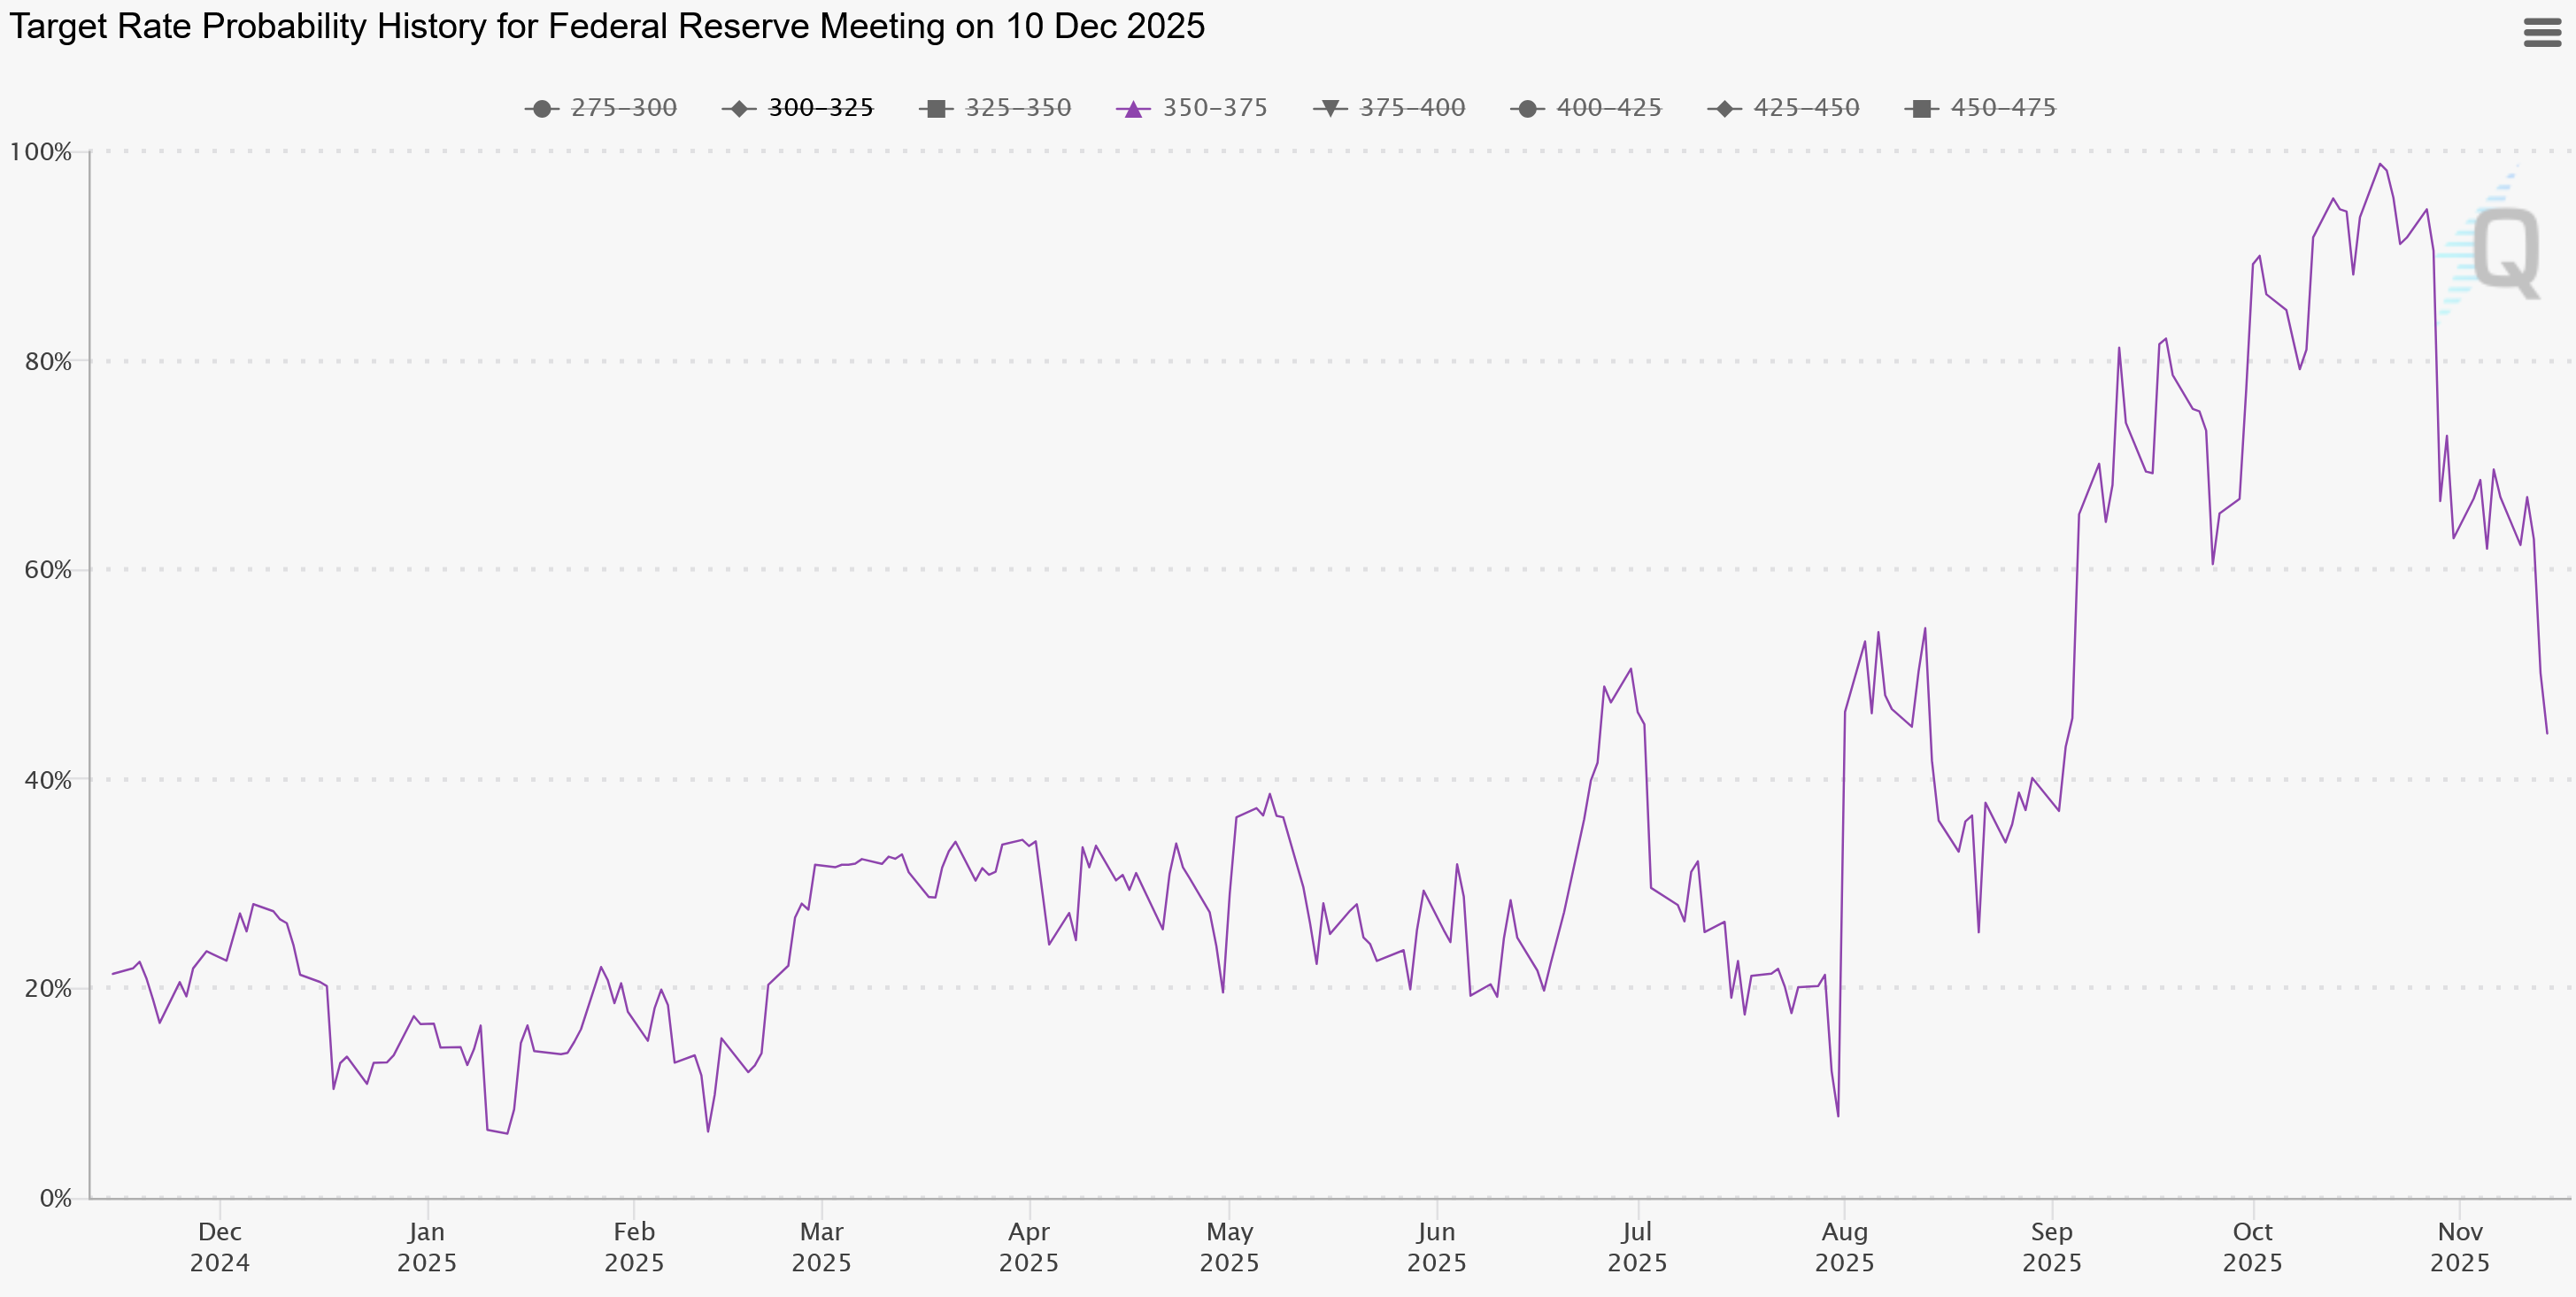
Market-based expectations for a third consecutive rate cut in December has dropped to 44% after being as high as 94% just a month ago. The chart below shows the odds for the fed funds rate to fall another quarter point at the December meeting.
Stock prices could be particularly sensitive to any signs that the interest rate tailwind could be jeopardy due to historically elevated valuation multiples that have only been rivaled during the late 1990s internet bubble.
You’re already seeing some of the speculative air coming out of high growth stocks that were surging ahead as the Fed resumed rate cuts back in September, like quantum computing stocks and equities linked to cryptocurrencies.
This week, lets look at the quickly shifting outlook for rate cuts, more warnings on the inflation outlook, and why that’s leaving growth stocks exposed to a pullback. We’ll also unpack investor sentiment and why broad attitudes toward the rally remains a tailwind for the stock market.
The Chart Report
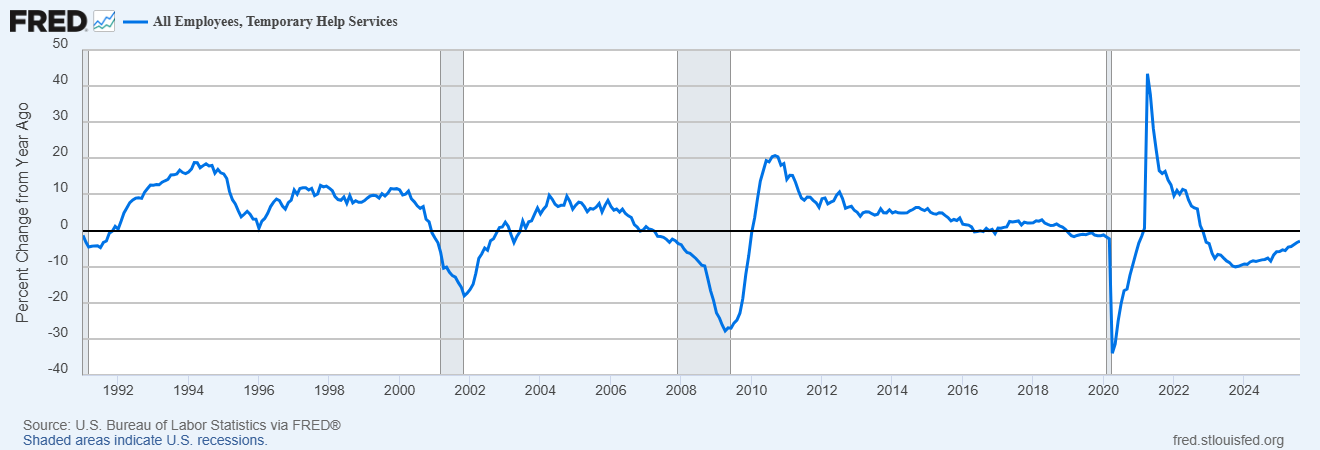
One key factor behind Fed officials voicing concerns over further rate cuts has been resiliency in economic data. Private sector reports on manufacturing and service sector activity have been pointing to accelerating economic data. Fears over deterioration in the labor market haven’t materialized as well. At the same time, leading indicators of labor market activity have been improving. That includes temporary workers that tends to inflect higher before a broader improvement in labor market data. You can see in the chart below that the rate of change in temporary hiring has been moving higher, which could point to a broader improvement in labor market activity ahead.
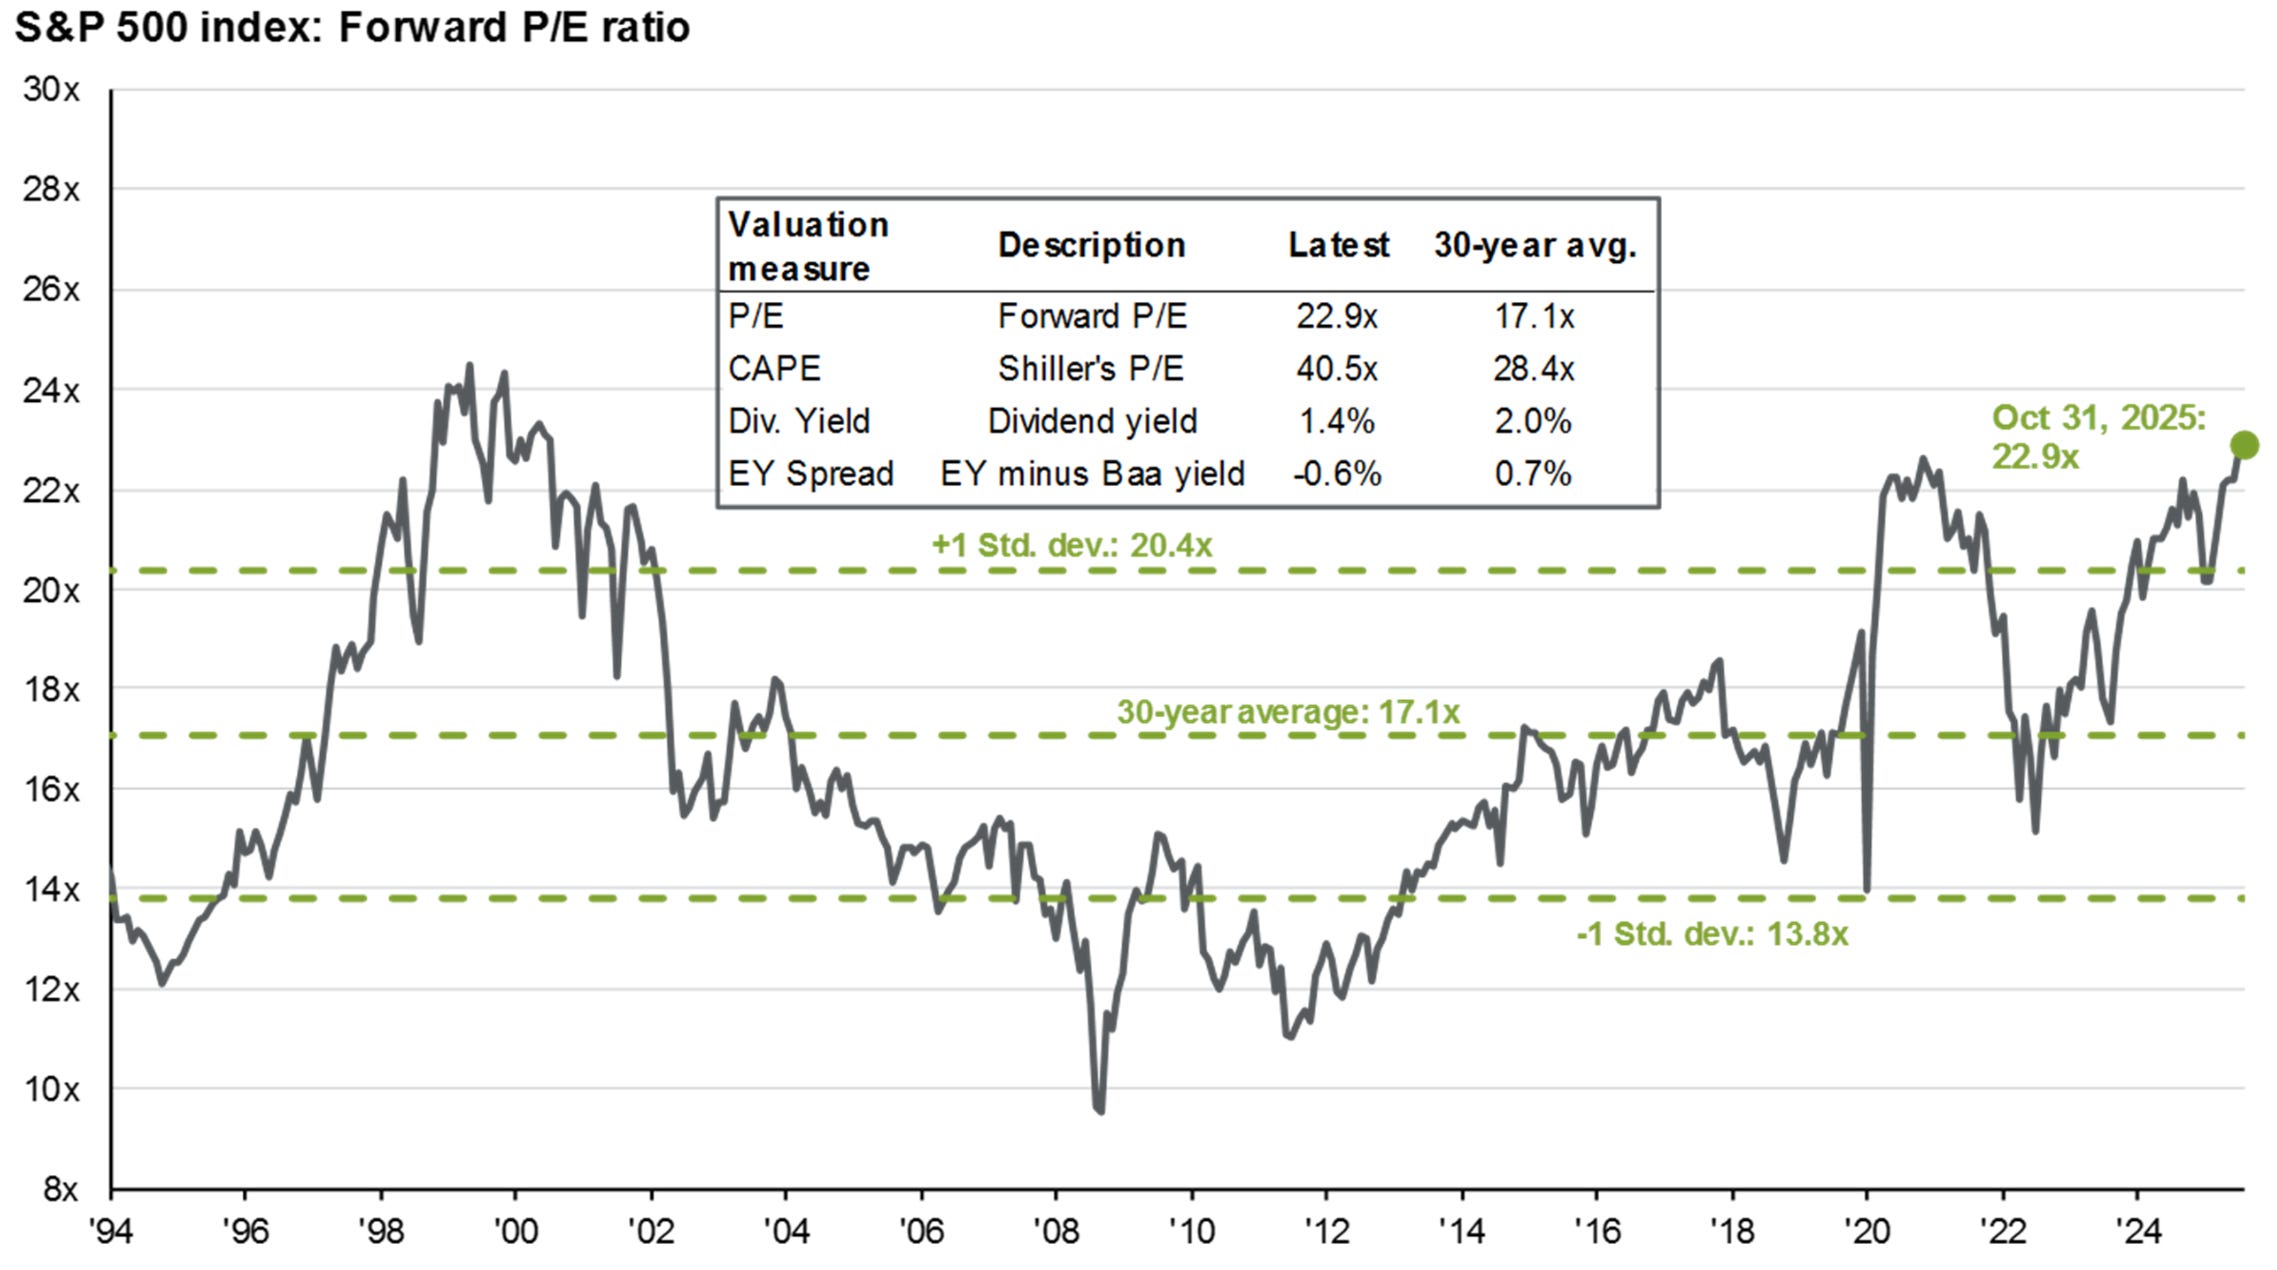
Stock market valuations are nearing some of the most extreme levels in history just as the interest rate tailwind is getting questioned. Falling interest rates boost stock valuations through two main catalysts. Falling rates make the present value of future corporate profits worth more, which is especially impactful for growth stocks whose earnings potential is in the future. Lower interest rates also present less competition for investor capital from fixed income securities. With the outlook for additional rate cuts in question, that leaves stock prices more vulnerable given extended valuations across several measures. That includes the S&P 500’s forward P/E ratio, which at 22.9x is the highest since the internet bubble (chart below).
While stock market valuations are collectively elevated, certain sectors are more exposed to the risk of rising interest rates. That includes stocks recently exhibiting strong return momentum and high volatility, like those found in more speculative corners of the stock market. The chart below tracks a basket of domestic high beta momentum stocks, which were showing strong gains as the Fed resumed cutting interest rates back in September. As questions grow around the outlook for further cuts last week, high beta stocks are seeing a quick momentum unwind with the basket having one of its worst single day declines in the past five years.

While valuations may present a risk to the rally, they’re not being accompanied by widespread bullish investor sentiment that tends to mark tops. If anything, it appears that this bull market is quite hated as sentiment is quick to shift toward bearish views even as the S&P 500 hovers near record highs. In fact, retail investor sentiment as measured by the AAII survey is showing bearish views at 49.1% which outnumbers bullish views at 31.6%. Bearish views running that high with the S&P 500 within 1% of an all time high has only happened one time before, which produced a rally of nearly 18% over the coming year (chart below).

While Fed officials voice concerns over elevated levels of inflation, market sectors with high inflation betas are warning of rising price levels ahead. Gold prices broke out to record highs at the start of 2024, while global copper benchmarks and related mining stocks are moving out to record highs this year as well. The next sector to watch is with energy stocks, which have been basing for several years and are trading near resistance as you can see in the chart below. A breakout in energy stocks would be the latest warning on inflationary pressures building.

Heard in the Hub
The Traders Hub features live trade alerts, market update videos, and other educational content for members.
Here’s a quick recap of recent alerts, market updates, and educational posts:
Evidence that a bubble is well underway.
Conditions that can drive the bubble to inflate further.
One key metric that could usher in the next bear market.
The chart setup that’s tipping good times for the economy.
Why you should turn to charts to find the next leading gold stock.
You can follow everything we’re trading and tracking by becoming a member of the Traders Hub.
By becoming a member, you will unlock all market updates and trade alerts reserved exclusively for members.
🚨Hub members recently locked in gains of 244.4% and 165.4%. Check out the special offer below to join the Hub today!
👉You can click here to join now👈
Trade Idea
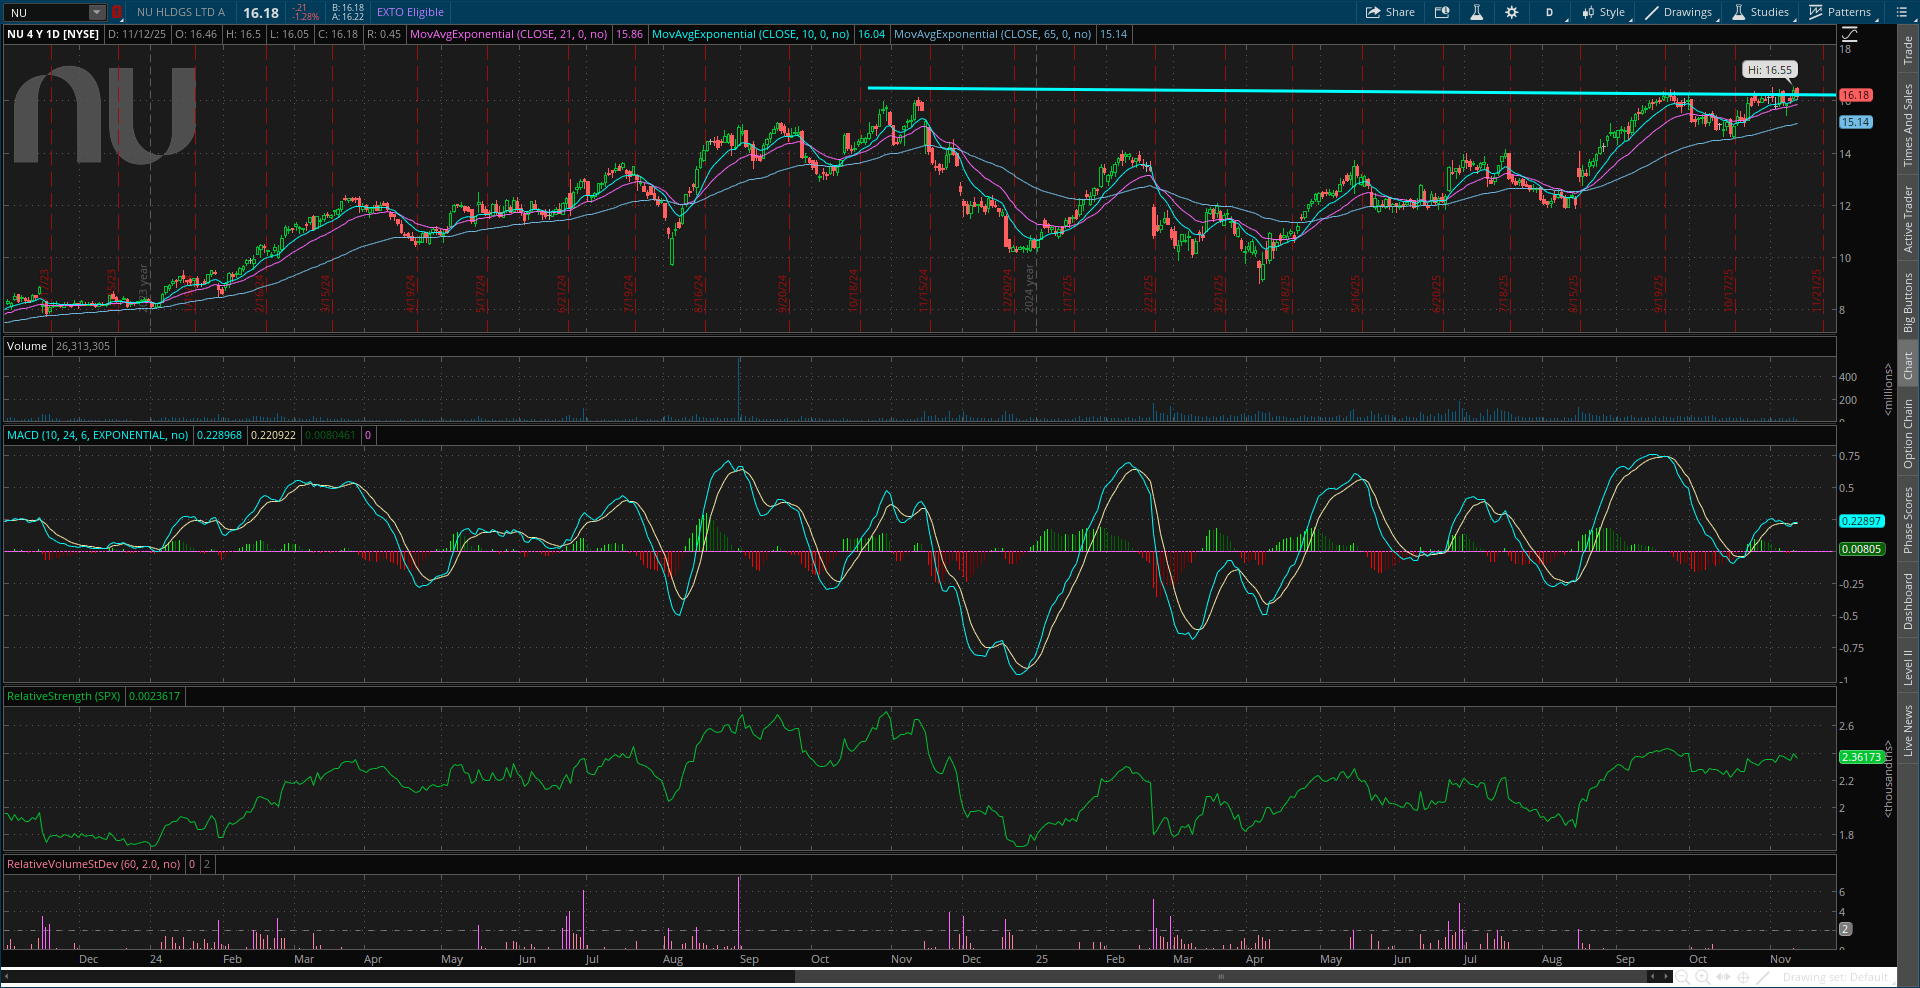
Nu Holdings (NU)
NU
The stock ran to the $16 level in November and started a new basing pattern. NU is making a series of higher lows since April with price back to resistance at $16. The stock needs a smaller pullback to create a MACD hook before breaking out over $16.
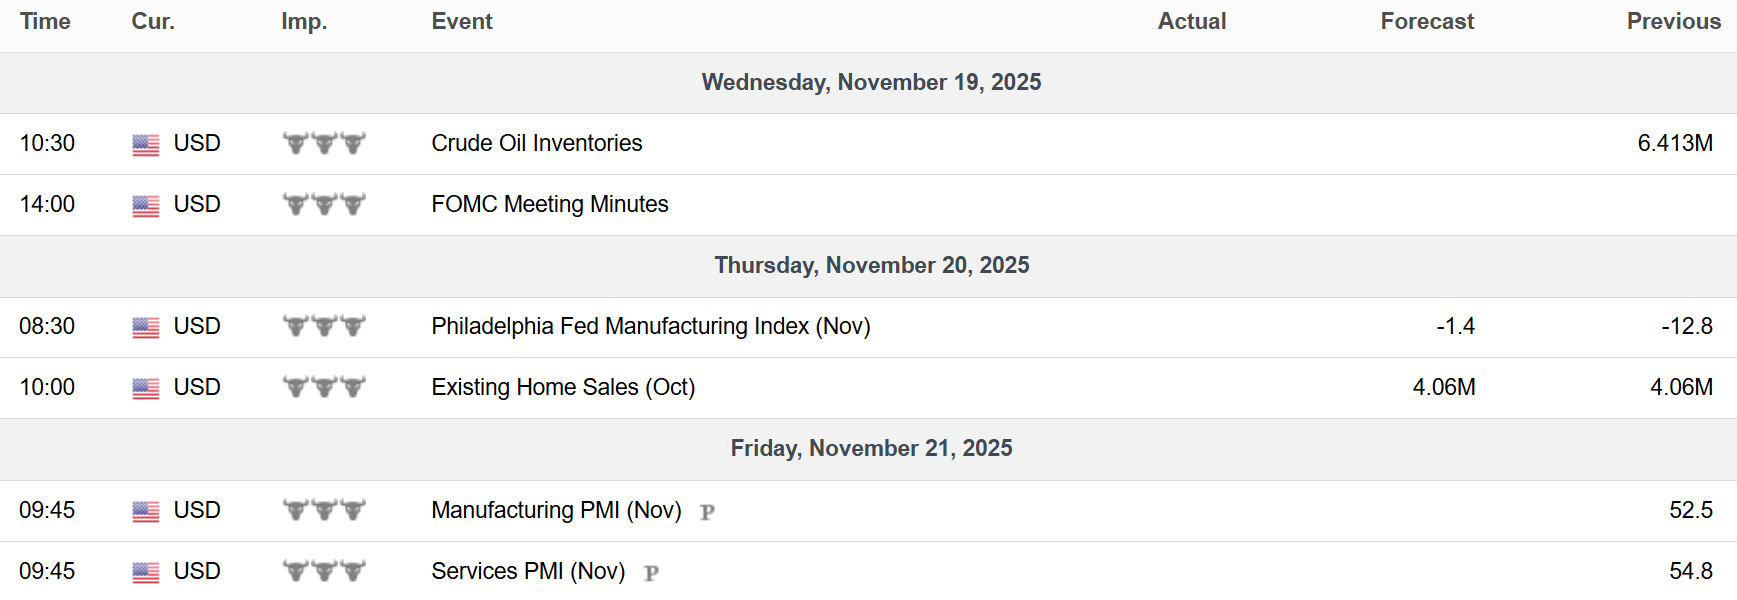
Key Upcoming Data
Economic Reports
Earnings Reports

I hope you’ve enjoyed The Market Mosaic, and please share this report with your family, friends, coworkers…or anyone that would benefit from an objective look at the stock market.
Become a member of the Traders Hub to unlock access to:
✅Model Portfolio
✅Members Only Chat
✅Trade Ideas & Live Alerts
✅Mosaic Vision Market Updates + More
Our model portfolio is built using a “core and explore” approach, including a Stock Trading Portfolio and ETF Investment Portfolio.
Come join us over at the Hub as we seek to capitalize on stocks and ETFs that are breaking out!
And if you have any questions or feedback, feel free to shoot me an email at mosaicassetco@gmail.com
Disclaimer: these are not recommendations and just my thoughts and opinions…do your own due diligence! I may hold a position in the securities mentioned in this report.