The Market Mosaic 11.13.22
Why CPI does not change the stock market narrative, and a look at past bear market rallies.
Welcome back to The Market Mosaic, where I gauge the stock market’s next move by looking at macro, trends, market internals, and the mood of the crowd. I’ll also highlight one or two trade ideas using this information.
If you find this content helpful please hit that “like” button, share this post, and become a subscriber to this always free newsletter if you haven’t already done so!
Also, be sure to check out Mosaic Chart Alerts. It’s a midweek update covering my best chart setups among long and short ideas in the stock market, along with specific levels that would trigger a trade.
Now for this week’s issue…
Nearly two weeks ago, a hawkish Federal Reserve reinforced their campaign to aggressively tighten policy, with Chairman Jerome Powell commenting that “incoming data since our last meeting suggests that the ultimate level of interest rates will be higher than previously expected.”
Incoming data referred to the ongoing rise in price levels, with inflation running well ahead of the Fed’s 2% target. So investors are poring over economic reports that could give the Fed a reason to ease their campaign, which is exactly what they got with the latest Consumer Price Index (CPI).
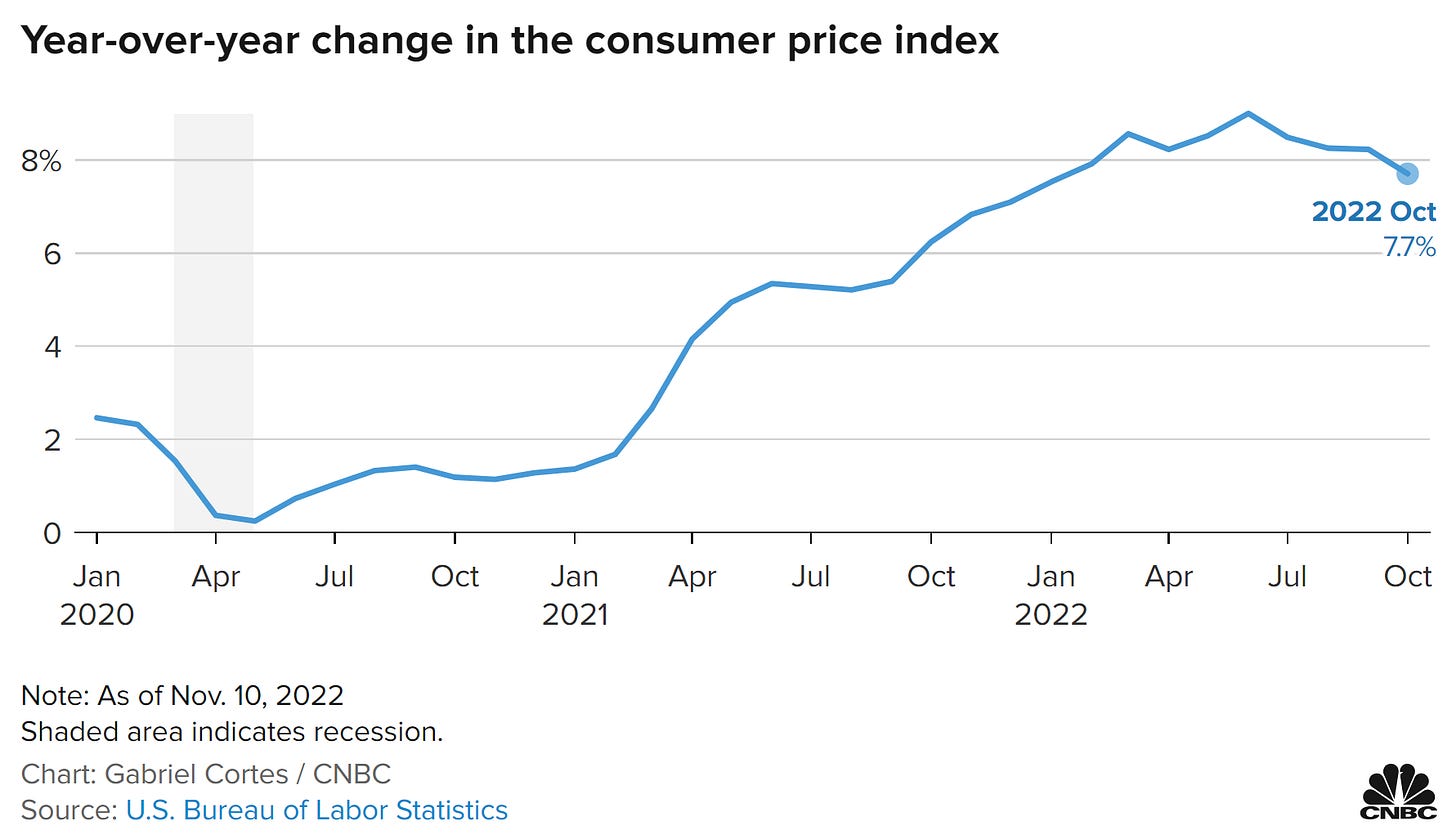
While the consumer inflation gauge still rose 7.7% in October compared to last year, it was a deceleration from the pace in September (see chart below). Perhaps more importantly, the “core” component that strips out food and energy prices rose 0.3% compared to the prior month, which was less than economists had anticipated.
That report gave investors confidence that Fed policy is starting to have an impact, which could be a reason to slow the pace of rate hikes. That sent stock’s soaring, with the S&P 500 gaining over 5% on the day CPI was released, which was the best single-day performance in over two years.
So that naturally begs the question: is the worst behind us for the stock market?
Today, I want to unpack investor reaction to the inflation report, explore historical precedents for strong rallies in bear markets, and look at market internals to determine if we have indeed seen the lows for stocks.
Is the Bear Busted?
Bear market rallies are a potent elixir that makes you believe the worst is over. That’s because of how quickly powerful gains can emerge in a short period of time. But there are a few things to note about the past week’s rally.
First, the biggest gains were reserved for the most beaten down areas o the stock market. I’ve noted the downside set up in the Ark Innovation ETF (ARKK) for the last couple weeks, where price started to break down but then went on to recover in the last couple trading sessions as you can see below.
Speculative growth names are particularly sensitive to changes in interest rates since the bulk of their earnings potential falls far into the future. Recent performance in that corner of the market bears all the hallmarks of a short-covering rally, where traders unwound bets against those stocks which created huge buying pressure. An index of unprofitable technology stocks tracked by Goldman Sachs gained 25% in just two trading sessions!
Stock market participation also suggests that the best institutional activity was reserved for a smaller segment of the market. That’s because on Thursday, the NYSE’s ratio of volume in advancing stocks relative to declining stocks was just 5 to 1. In just about any other market environment, that’s a strong figure. But when you’re trying to achieve escape velocity from a bear market, much stronger figures are typically seen. That number hit 30 to 1 just after 2018’s bear market low was seen, and was 25 to 1 coming off the 2009 low (2009 chart below). That shows real institutional interest in owning stocks across the board.
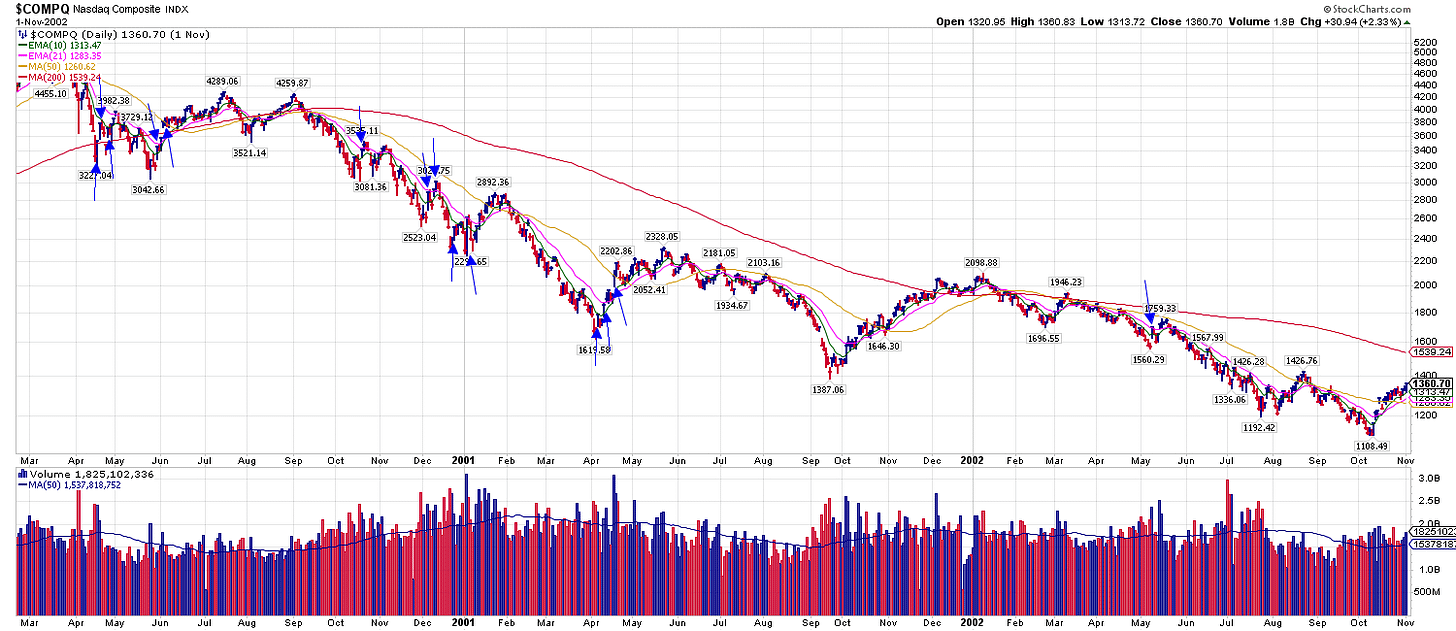
Finally, some of the most powerful rallies occur right in the middle of bear markets. During the dot-com bust, there were at least three rallies of 20% before stocks rolled back to new lows as you can see in the chart below.
And just take a look at the chart from Wesley Mattox around single-day gains of 6% or more on the Nasdaq, which is what happened following Thursday’s CPI release. During the 2000-2002 bear market, the Nasdaq had 14 single-day rallies of 6% or more as shown with the blue arrows…and each instance went on to see new lows.
Now What…
This rally could certainly have room to run, and I wouldn’t be surprised if the S&P 500 sets up another test of the 200-day moving average, which also happens to sit right at downtrend resistance as you can see in the chart below.
But I’m not sold that the worst is over just yet. I’ve lived through the 2000-2002 dot-com bust and 2007-2009 financial crisis, and I know firsthand how powerful rallies can emerge right in the middle of bear markets.
The important thing is to stay objective and look a whether big picture conditions have changed. In my opinion, I’m not convinced that last week’s inflation report alters the Fed narrative in a meaningful way. At some point, the Fed will slow the pace of rate hikes…they can’t keep doing 0.75% at each successive meeting forever!
But given the state of inflation and the strong labor market, the pressure is on the Fed to maintain restrictive monetary policy which also includes shrinking their balance sheet. That means the big picture perspective is that liquidity is still being drained from the financial markets, which will pressure asset prices.
Here’s how I’m approaching my own trading strategy. I will still take long and short setups as they develop, but I position size more conservatively and take gains more quickly since I believe this is still a bear market.
On the long side, energy stocks continue to show constructive price action with DK continuing to hold above key moving averages following its breakout. I also noted the setup in semiconductor stock $AEHR last week, which is setting up the next move higher:
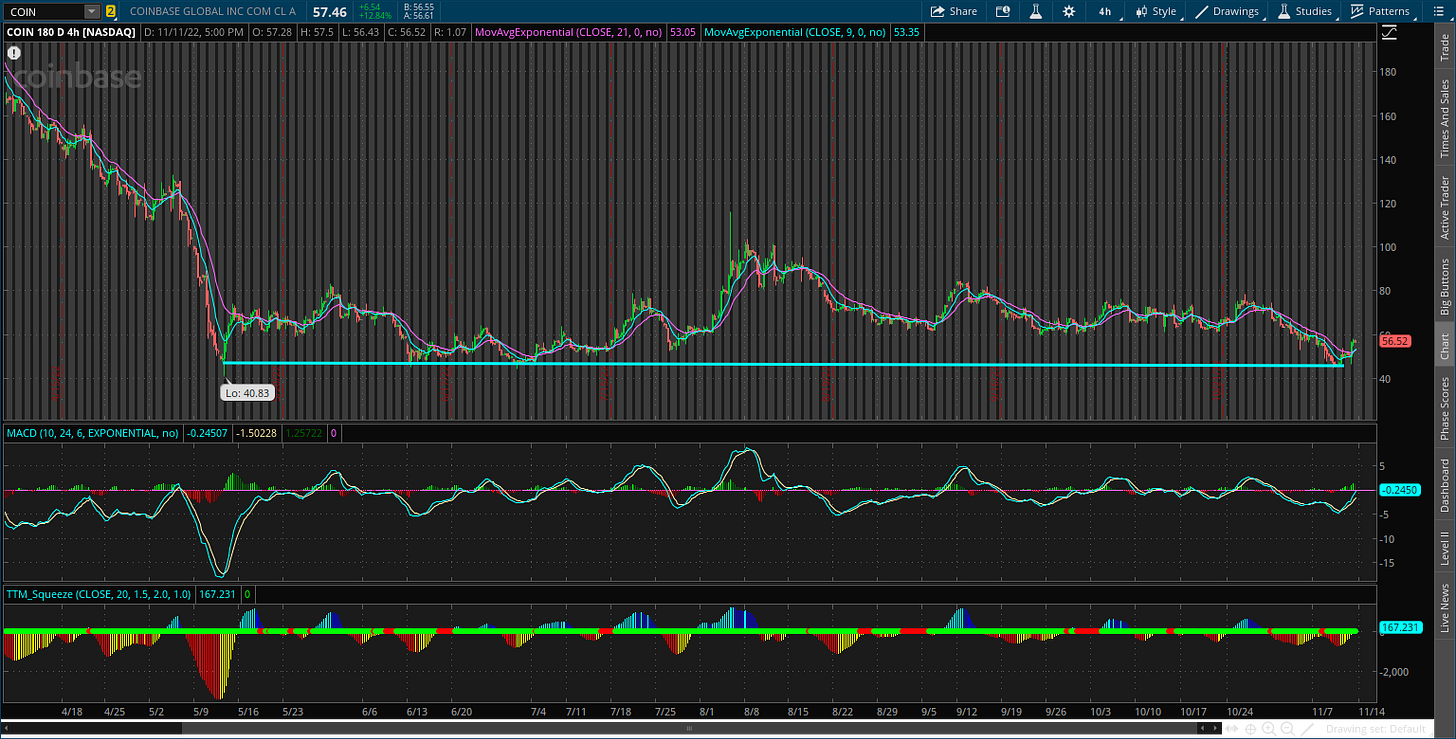
I’m also keeping watch of short setups trading near support levels. With last week’s carnage in the crypto space, COIN is one of my favorite short setups on a move below the $45/46 level shown in the chart below.
Finally, I do want to highlight one other aspect of trading short setups. As you saw last week, short-covering rallies can be powerful and unfold quickly. That’s a big reason why I take profits more quickly on the short side, as I outline here in Mosaic Chart Alerts.
I hope you’ve enjoyed this edition of The Market Mosaic, and please share this newsletter with anyone you feel could benefit from an objective look at the stock market.
And make sure you never miss an edition by subscribing here:
For updated charts, market analysis, and other trade ideas, give me a follow on Twitter: @mosaicassetco
And if you have any questions or feedback, feel free to shoot me an email at mosaicassetco@gmail.com
Disclaimer: these are not recommendations and just my thoughts and opinions…do your own due diligence! I may hold a position in the securities mentioned in this newsletter.


