
The Market Mosaic 1.11.26
S&P 500 At Record Highs...the Economy is Far Stronger Than Gloomy Payroll Data Implies!

👋Welcome back to The Market Mosaic, where I gauge the stock market’s next move by looking at macro, technicals, and market internals. I’ll also highlight trade ideas using this analysis.
If you find this report helpful please hit that “like” button, share this post, and become a subscriber if you haven’t already done so!
🚨And be sure to check out Mosaic Traders Hub. It’s a members-only platform to alert trade ideas, track a model portfolio of open positions, and further analyze the message coming from the capital markets.
Now for this week’s issue…
A “Goldilocks” payrolls report is keeping hopes of further interest rate cuts by the Federal Reserve intact while not sparking fears of an imminent recession.
Nonfarm payrolls increased by 50,000 in December compared to expectations for a gain of 73,000. The unemployment rate dipped to 4.4% from 4.6% in the prior month. It marks the first significant economic report with complete data since the partial federal government shutdown ended.
Prior months also saw negative revisions, including October’s figure that was revised to a loss of 173,000 jobs compared to the original estimate for a loss of 105,000. For all of 2025, payrolls averaged a gain of just 49,000 per month compared to 168,000 in 2024.
While the jobs report is painting a weakening picture for the economy, other economic data is diverging. That includes the most recent ISM Services PMI that came in a 54.4 in December from the prior reading of 52.6.
Components within the report are evolving favorably as well, with the leading new orders component surging to 57.9 from 52.9 (chart below). A reading above 50 indicates expanding activity.

Cyclical stock market sectors are also sending a positive signal to start the year. Small-cap stocks are jumping out to new highs ahead of the S&P 500, while the Dow Jones Transportation Average is breaking out to record highs and triggering a bullish signal.
Stock prices discount future business conditions, which means the rally in cyclical sectors is a vote of confidence in the economy and earnings outlook. It’s also worth noting that earnings growth for the “Magnificent 7” and the S&P 500’s “Other 493” is projected to accelerate in 2026 compared to last year’s level.
This week, I want to dive further into evidence that the economy is holding up much better than payrolls suggest and factors that can drive accelerating economic activity. Cyclical stock market sectors are providing confirmation, while oil is the next commodity to watch.
The Chart Report
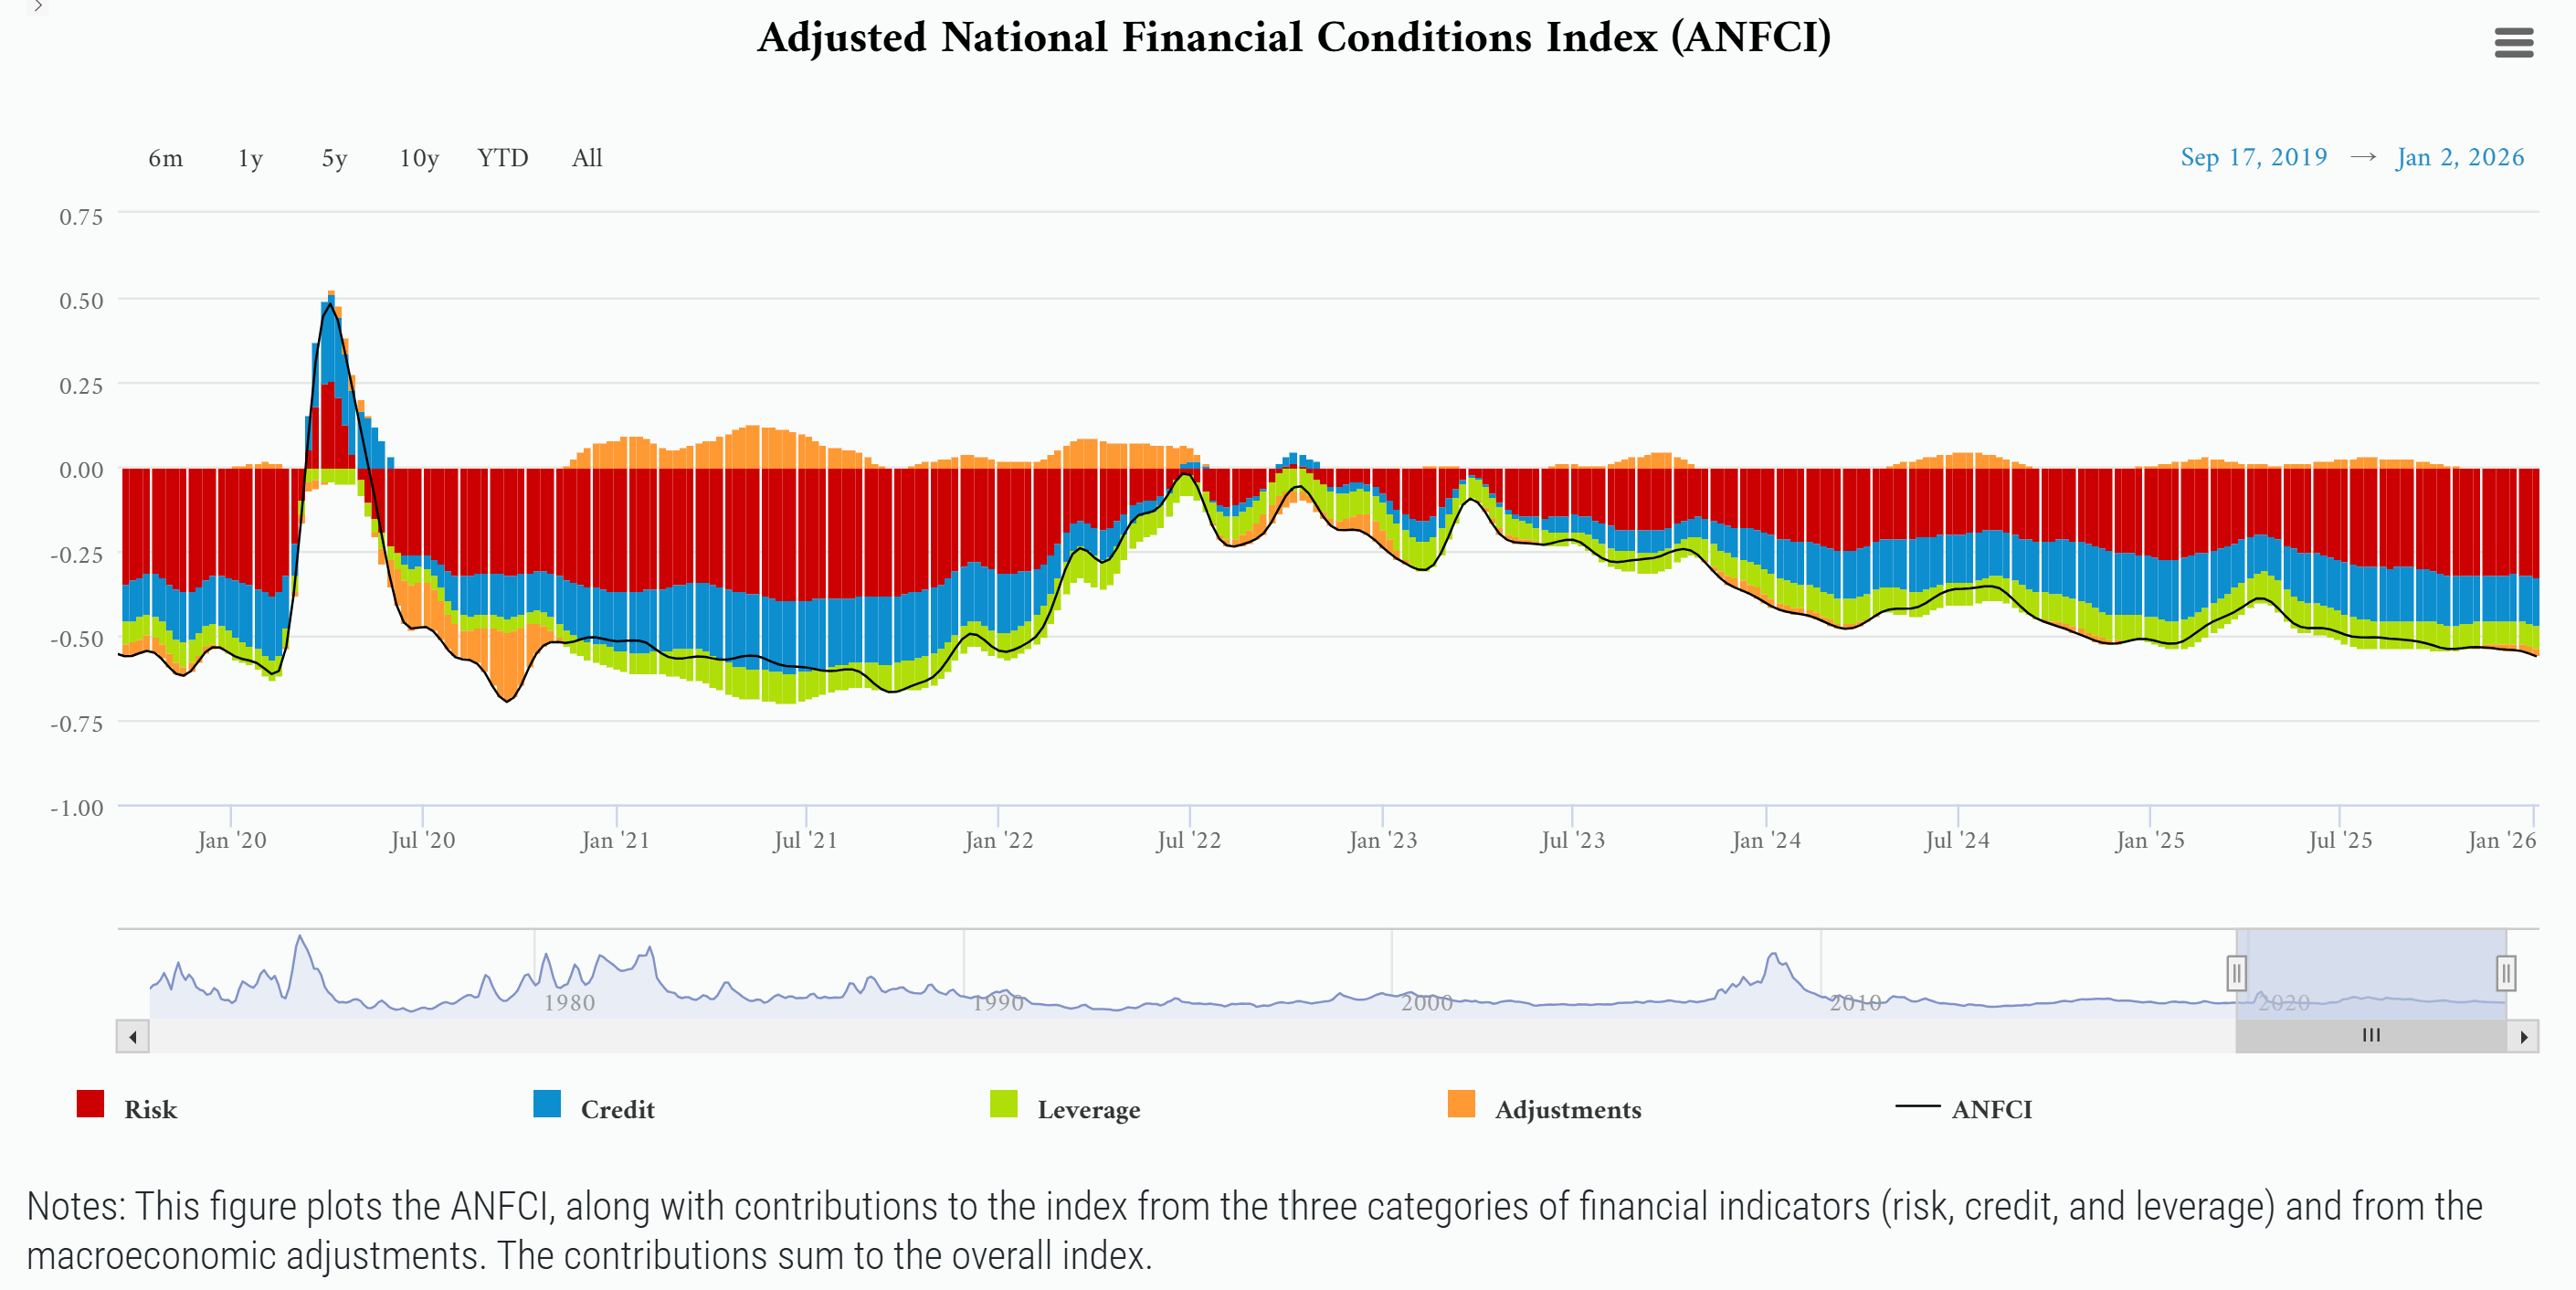
Ongoing deceleration in the pace of job gains and a steadily rising unemployment rate since April 2023 is triggering concerns among economists and has spurred the Federal Reserve to resume its rate-cutting cycle. The Fed has cut for three consecutive meetings, which has brought the fed funds rate lower by 1.75% since the peak in 2024. Not only has the Fed resumed the rate-cutting cycle, but is also back to expanding the balance sheet by purchasing Treasury securities which boosts financial market liquidity. The moves are keeping financial conditions loose, which is correlated with expanding economic activity. The chart below shows the Chicago Fed’s measure of financial conditions, which is running at the loosest levels since 2021.
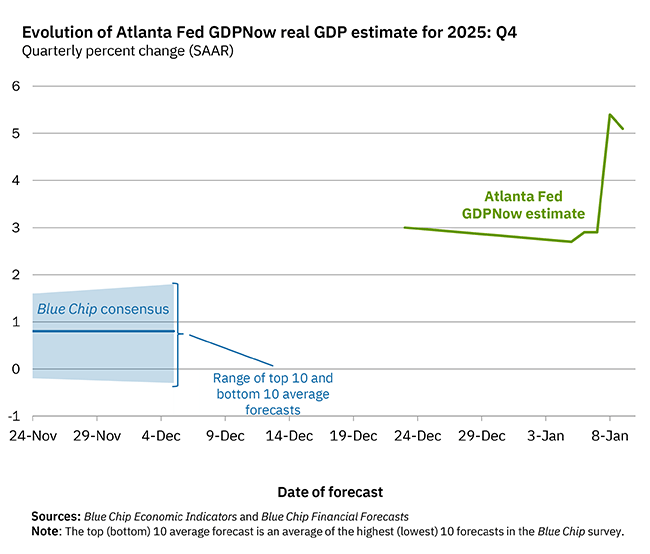
While payrolls data is sparking concerns, other indicators are holding up or even showing accelerating growth in the economy. Initial jobless claims are hovering near the low end of the historic range, while a report from Adobe suggests that online spending during the holiday season gained 6.8% to $257.8 billion. Strong growth has also been showing up in recent GDP reports. The most recently released GDP report showed growth expanding at an annualized rate of 4.3% in the third quarter. The Atlanta Fed’s GDPNow tracker currently points to growth expanding at a 5.1% annualized pace in the fourth quarter (chart below). A recent jump in the estimate was sparked by a surge in net exports which is likely a one-time event. But the growth estimate was still running at 2.9% before the jump, and shows broader economic activity is holding up.
Recent GDP reports and real-time estimates of economic activity are surprising to the upside. That’s driving one measure of the economy’s output relative to its potential to the highest level in 25 years. A positive output gap happens when economic output is exceeding its long-term potential, which is plotted in the chart below with the blue bars. Economic growth relative to its potential is at the strongest level since the late 1990s. Despite the signals coming from payrolls data, the output gap suggests risks of an overheating economy which could contribute to inflationary pressures.

Investors are facing conflicting data on the health of the economy. This is when it’s helpful to turn to the performance of cyclical sectors of the stock market for clues on the status of the underlying economy. Stock prices discount future earnings and business conditions, which makes the performance of cyclical sectors notable to start the year. Small-cap stocks are building on a breakout to new record highs, while industrial and financial sector ETFs are doing the same. There’s also been a recent breakout in transportation stocks to new all-time highs, which is triggering the Dow Theory signal for the first time in over a year. That occurs when the Dow Jones Industrial Average and Transportation Index is making new highs at the same time, which is historically positive for S&P 500 forward returns (table below).

Another segment of the capital markets pointing to accelerating economic growth is with commodities. Base metals like copper and aluminum that are sensitive to economic trends are breaking out to all-time record highs. The next commodity to monitor is with oil prices. Oil has been in the headlines especially with the U.S. military operation inside Venezuela and ongoing tensions in the Middle East. The news cycle has been mostly bearish for oil prices, with oil trading near the lowest levels in five years. In terms of positioning, institutional investors are deploying bearish bets with short positioning in oil futures near record levels. A survey of clients by Goldman Sachs also shows the most bearish views on oil in nearly a decade (chart below). It’s worth remembering that oil tends to move very late in the cycle, and that positioning and bearish sentiment could emerge as a tailwind for oil prices this year.

Heard in the Hub
The Traders Hub features live trade alerts, market update videos, and other educational content for members.
Here’s a quick recap of recent alerts, market updates, and educational posts:
The S&P 500’s correction in time.
Small-cap breadth extremely oversold.
The massive expansion in growth sector breakouts.
A growing contribution from the S&P’s “Other 493”.
The common growth fundamentals linking trade ideas.
You can follow everything we’re trading and tracking by becoming a member of the Traders Hub.
By becoming a member, you will unlock all market updates and trade alerts reserved exclusively for members.
Trade Idea
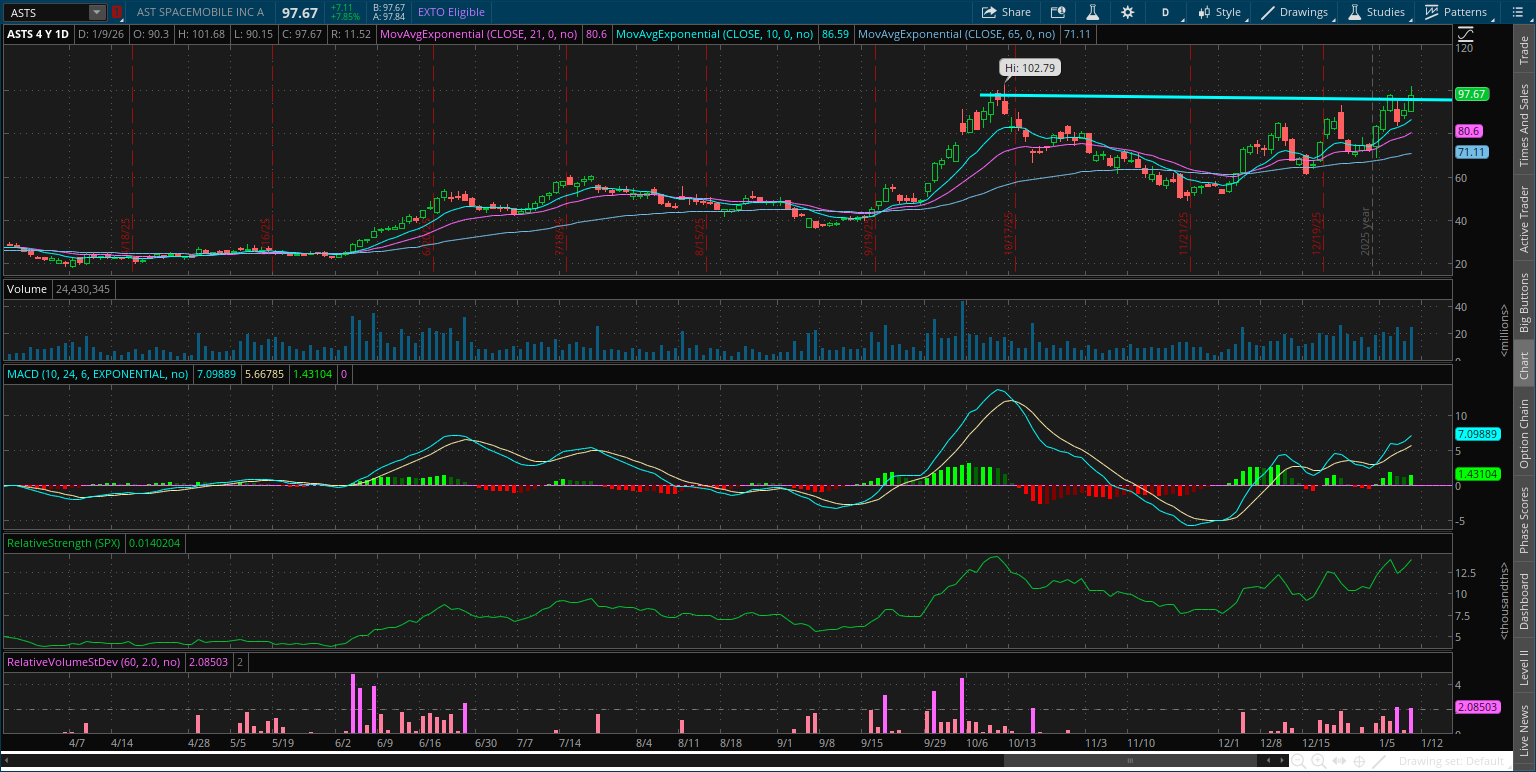
AST SpaceMobile (ASTS)
The stock rallied to the round $100 level and is now making a series of smaller pullbacks. Recently testing $100 this week with the RS line and MACD in a good position to support a breakout. I’m watching for the move over $100.
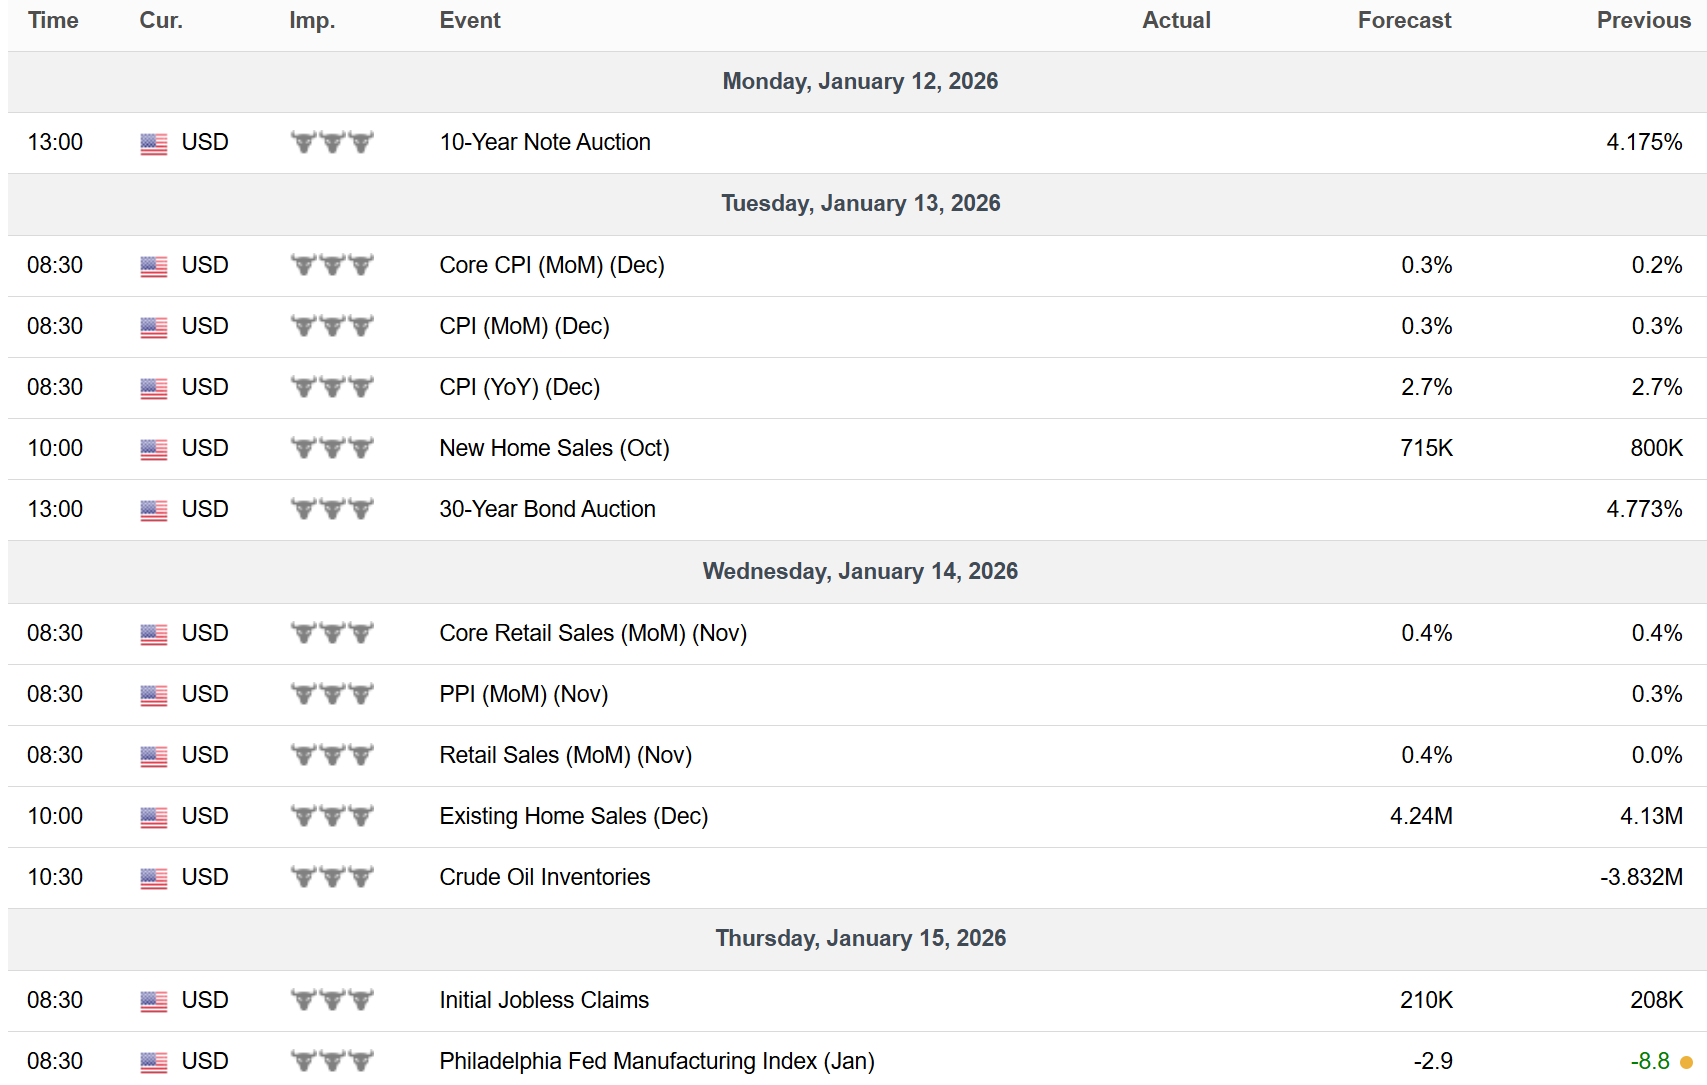
Key Upcoming Data
Economic Reports
Earnings Reports

I hope you’ve enjoyed The Market Mosaic, and please share this report with your family, friends, coworkers…or anyone that would benefit from an objective look at the stock market.
Become a member of the Traders Hub to unlock access to:
✅Model Portfolio
✅Members Only Chat
✅Trade Ideas & Live Alerts
✅Mosaic Vision Market Updates + More
Our model portfolio is built using a “core and explore” approach, including a Stock Trading Portfolio and ETF Investment Portfolio.
Come join us over at the Hub as we seek to capitalize on stocks and ETFs that are breaking out!
And if you have any questions or feedback, feel free to shoot me an email at mosaicassetco@gmail.com
Disclaimer: these are not recommendations and just my thoughts and opinions…do your own due diligence! I may hold a position in the securities mentioned in this report.