The Market Mosaic 10.8.23
Good news is bad for stocks? Nope.
Welcome back to The Market Mosaic, where I gauge the stock market’s next move by looking at macro, technicals, and market internals. I’ll also highlight trade ideas using this analysis.
If you find this content helpful please hit that “like” button, share this post, and become a subscriber to this always free report if you haven’t already done so!
And be sure to check out Mosaic Chart Alerts. It’s a midweek update covering chart setups among long and short trade ideas in the stock market, along with levels I’m watching.
Now for this week’s issue…
A funny thing happened in the stock market when the September jobs report smashed expectations. The month saw payrolls soar by 336,000, which was nearly double economist estimates for 170,000.
It was the latest data point suggesting an economy performing just fine. The day before, initial jobless claims were reported at just 207,000. That’s holding near the historical low end of jobless filings, while another report on job openings showed an unexpected increase to 9.6 million across the nation. That follows three consecutive months of declining openings.
But all throughout the week, a “good news is bad news” narrative emerged for investors. Just look at the reaction in S&P 500 Index futures following the payrolls report on Friday. Stock futures plunged more than 1% immediately following the release.
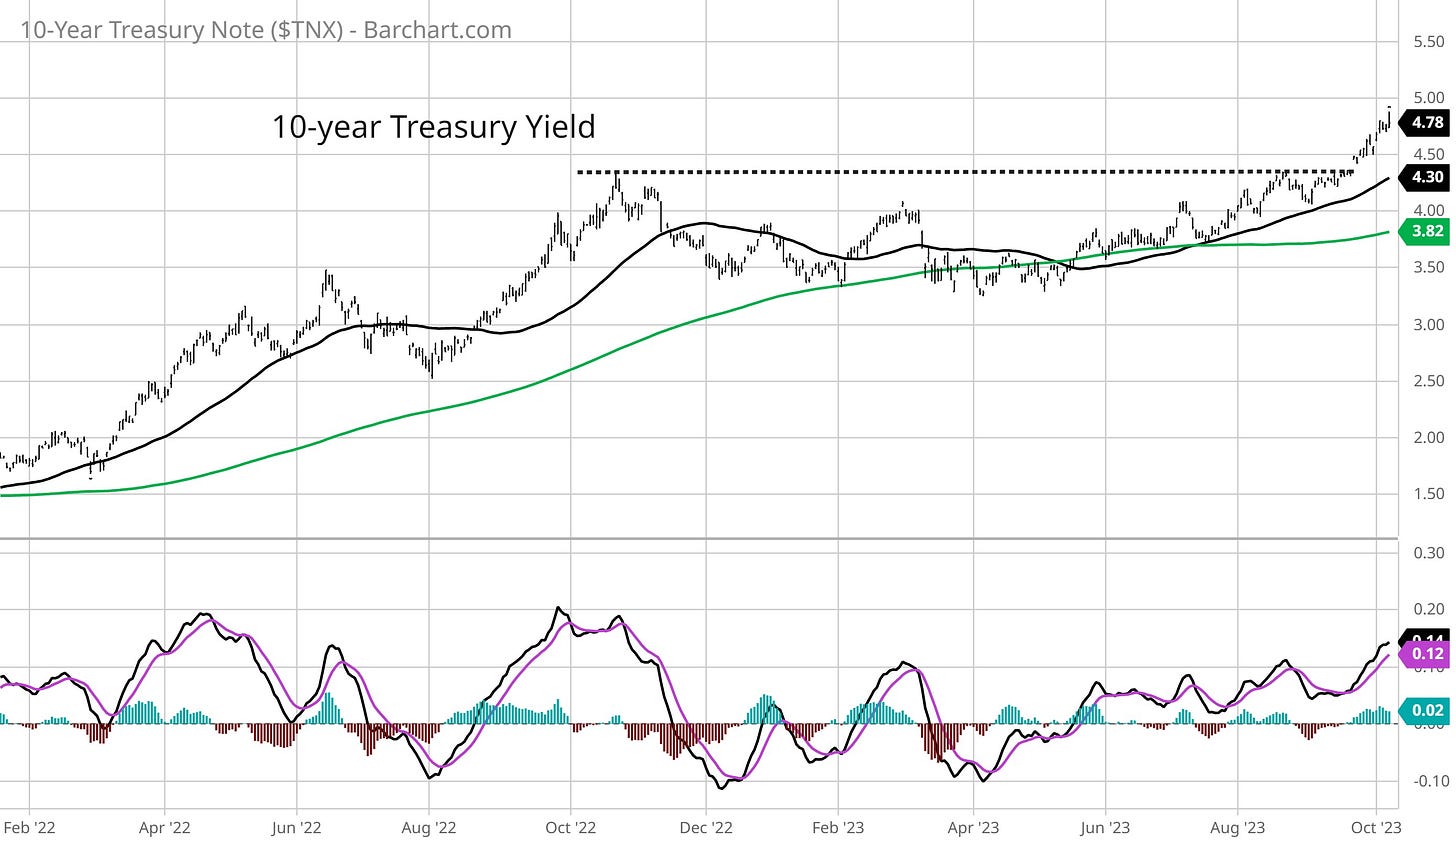
The reports were collectively met with another spike in bond yields as well. The 10-year Treasury yield pushed as high as 4.88% last week, continuing an almost parabolic move since breaking out over 4.34% level that I’ve highlighted many times in recent weeks.
The concern for investors is that good news on the economic front spells trouble for monetary policy. Although the Federal Reserve seems bent on pausing the pace of rate hikes, an accelerating economy punctuated by a strong labor market could throw a wrench in those plans.
Even Fed chair Jerome Powell has commented that a softening labor market is needed to get inflation to acceptable levels. However, jobs data from the past week showed anything but softening in the labor market.
But buying into the “good news is bad” framework for the stock market is misguided, and ignores the key driver to stock returns over the long run. Here’s why good news is good indeed, and what you should be watching instead.
Good News is Good for Stocks
The knee-jerk negative reaction by investors to data suggesting a strong economy follows an analytical framework that misses the big picture.
Yes, the direction and level of interest rates can have a negative impact on market valuations, and the jump in longer-dated yields is certainly weighing on stock prices.
Higher interest rates make future corporate earnings worth less in today’s terms, while also presenting competition for investor capital. Just look at the performance of the utility sector as Treasury yields outpace the sector’s dividend yield.
But over the longer-term, stock prices follow earnings. You can see that in the chart below from Macrotrends, which shows the S&P 500 (blue line) along with trailing 12-month earnings per share (orange line).
That’s why evidence of a stronger economy and earnings outlook is a welcome sign for forward returns. And besides the September jobs report (which is backward looking anyways), there were other overlooked data points that suggest an improving economic outlook.
That includes the ISM’s reports on manufacturing and service sector activity. These purchasing manager indexes (PMI) survey business conditions, and are constructed so that a reading over 50 indicates expansion while below shows contraction. The services gauge was reported at 53.6, which is the ninth consecutive month in growth territory.
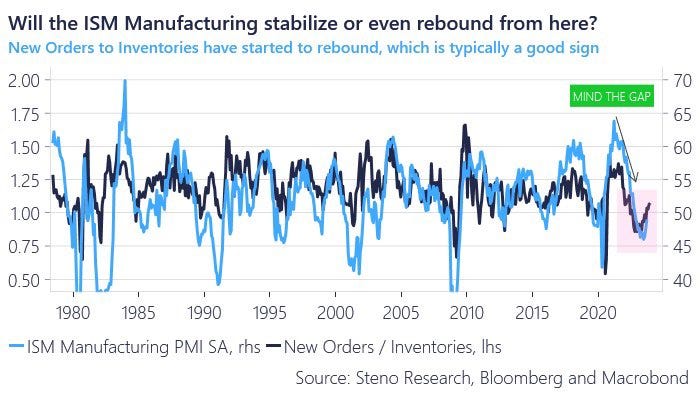
But I pay most attention to the manufacturing report, and specific components within. That includes the spread between new orders and inventories, which is a leading indicator of activity and I’ve found to have predictive power for forward stock market returns.
I noted here last week how new orders increased to just under 50 while the inventories gauge dropped, so both are moving in the right direction. The chart below (h/t to Steno Research) shows the ratio of new orders to inventories rebounding off a low level, which is a good sign that manufacturing activity can keep picking up.
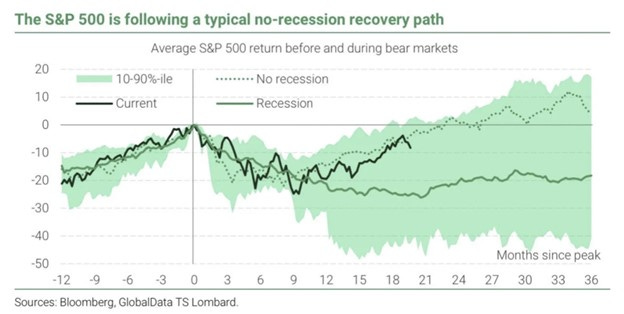
Finally, it’s worth noting that the S&P 500 itself is following a historic path that typically sees no recession. The arrival of (and many calls for) a recession would complicate the earnings outlook. But this chart from Maverick Equity Research shows the S&P’s recovery from last October’s low is tracking the typical recovery path.
So while the investor knee-jerk reaction to better economic reports all week was negative, it’s actually quite the opposite. Signs of a deteriorating economy would spell trouble for the earnings outlook, which is the long-term driver of stock prices.
Now What…
Perhaps investors started coming around to their senses later in the day on Friday. The stock market staged a massive reversal from the morning’s lows, with the S&P 500 putting in a bullish engulfing bar after coming close to a test of the 200-day moving average (MA – green line) and the key 4200 level. You can see those levels in the chart below.
With oversold levels on the MACD and RSI as well, the S&P’s technical conditions can support a relief rally over the near-term. But in order for a more durable bounce to play out, I discussed here how breadth thrusts are needed to confirm. That would signal institutional activity in stocks.
Outside of monitoring stock market internals like breadth, there are two other catalysts to watch over the near-term. First, we’re finally getting to a historically positive seasonal stretch based on 20-year trends as I noted in the post below:
Second, earnings season is around the corner. If the economy is becoming a tailwind for the earnings picture, then we need to see it show up in forward earnings estimates.
There’s been a strong rebound in forward estimates since that start of the year which is helping drive the S&P 500’s recovery path. The upcoming reporting season presents the next opportunity for corporate management teams to update their outlooks and have that reflected in forward estimates from analysts.
To bring the discussion back to the improving manufacturing PMI highlighted above, note in the chart below (h/t to Yardeni Research) how a rising PMI tends to correlate to positive earnings revisions.
As far as trades go in this environment, I’m watching for stocks with strong growth fundamentals that are basing just below their 52-week highs.
For the last few weeks in Mosaic Chart Alerts, I’ve noted the setup and level of interest in EDU. The relative strength (RS) line was already making new highs before the stock moved above $59 on Friday.
I’m also following the action in DUOL. The stock continues basing just below the $165 area (chart below), with the MACD and RS line in a strong position to support a breakout.
That’s all for this week. The coming week will feature plenty of headlines to fuel volatility. Geopolitical tensions are emerging in the Middle East, while updated reports are CPI and PPI inflation are due to be released. But next week also kicks off the 3Q earnings season, where I want to see better economic figures reflected by higher forward estimates.
I hope you’ve enjoyed The Market Mosaic, and please share this report with your family, friends, coworkers…or anyone that would benefit from an objective look at the stock market.
And make sure you never miss an edition by subscribing here:
For updated charts, market analysis, and other trade ideas, give me a follow on Twitter: @mosaicassetco
And if you have any questions or feedback, feel free to shoot me an email at mosaicassetco@gmail.com
Disclaimer: these are not recommendations and just my thoughts and opinions…do your own due diligence! I may hold a position in the securities mentioned in this report.


Love the analysis! I totally agree with you that we need more confirmation before feeling confortable to say we are out of the wood!
Great coverage, have a good next week! Cheers!