Welcome back to The Market Mosaic, where I gauge the stock market’s next move by looking at macro, technicals, and market internals. I’ll also highlight trade ideas using this analysis.
If you find this content helpful please hit that “like” button, share this post, and become a subscriber if you haven’t already done so!
And be sure to check out Mosaic Chart Alerts. It’s a midweek update covering chart setups among long and short trade ideas in the stock market, along with levels I’m watching.
📢Before jumping into today’s report, I recently announced a new premium feature coming to my newsletter: Mosaic Traders Hub🔥
The Hub goes live on 10/28, and you can read all the details of what’s included in the Hub here (plus several new features).
The Hub is a massive expansion of what I cover in The Market Mosaic plus more trade ideas…be sure to reserve your spot before we go live!
Now for this week’s issue…
A blowout payrolls report has investors questioning the scope and speed of a new easing cycle by the Federal Reserve, while also raising hopes of a soft landing for the economy.
After cutting interest rates by 0.50% last month, Fed Chair Jerome Powell made it clear that the central bank’s focus had shifted to the full employment side of their dual mandate (the other being price stability).
Powell himself even remarked that the cut was "a sign of our commitment not to get behind.” But fears over any damaging lag effect of monetary policy were soothed last week.
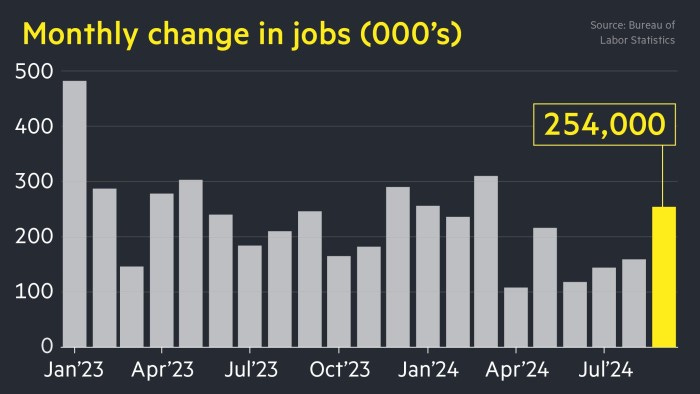
The September payrolls report showed 254,000 jobs were created during the month. That easily surpassed economist estimates for 150,000, while the last two months were revised higher by 72,000 jobs. The chart below shows the monthly gain in payrolls going back to the start of 2023.
As a result, investors are quickly recalibrating the outlook for rate cuts. At one point, market-implied odds pointed to a 50/50 chance of another 0.50% reduction to the fed funds rates at the Fed’s November meeting.
Following the jobs report, those odds now stand at zero chance for a larger cut. The chart below shows how much easing was priced into the next four Fed meetings before and immediately after the jobs data.
While the outlook for a more aggressive rate cutting campaign is in question, the strong employment report also supports the notion of a soft landing for the economy. That’s the scenario the Fed wants to achieve, with the economy slowing but avoiding recession in order to balance job growth and inflation.
But if the economy is going to see a soft landing, then there are key areas of the capital markets that need to send a positive message. Here are three sectors I’m following to know if the economy can indeed stick the landing.
The Economy Can Stick the Landing
In order to monitor the outlook for the economy and impact from the lag effect of monetary policy, I’m sticking with the message coming from the capital markets.
I’ve written extensively about utilizing equity sector performance to gauge the economic and corporate earnings picture.
In order to ascertain the odds that the economy will realize a soft landing and avoid outsized damage from the lag effect of monetary policy, I’m monitoring areas sensitive to the outlook.
That includes high yield bonds with borrowing spreads and the relative performance of certain high yield sectors. When spreads are compressed as they are now, that’s a vote of confidence for the economic outlook since investors aren’t pushing up the cost to lend to companies on shaky financial ground (and that run a higher risk of not being able to pay back debts).
In the high yield sector, I also track the relative performance of certain rating categories. The chart below shows a ratio of “CCC” and below rated bonds to “BB” rated ones.
In other words, how are the lowest rated junk bonds holding up with a rising line showing relative outperformance. That line is hitting the highest level in over five years, which is another positive signal on the outlook from companies most sensitive to economic activity.
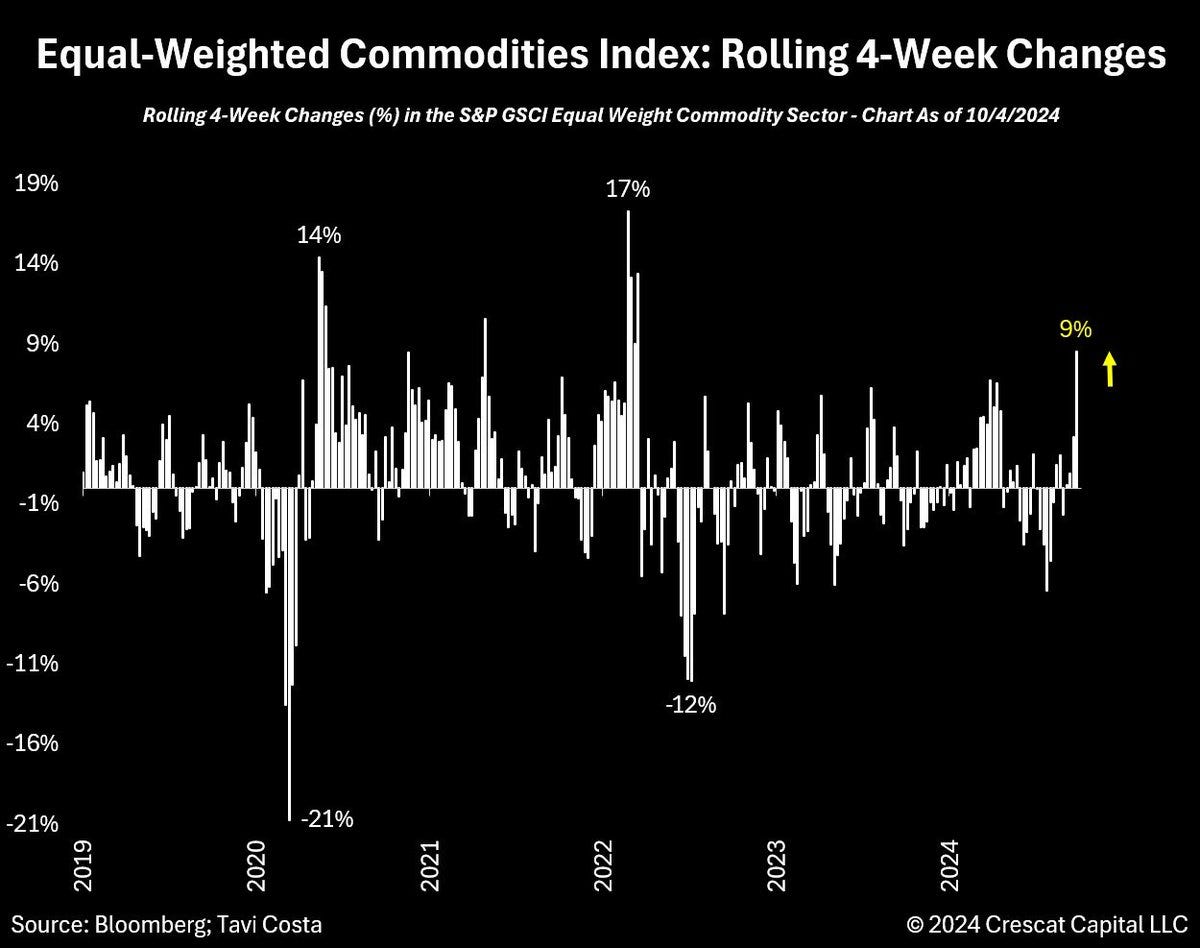
I’m also closely following the price action in commodities. Last week, commodity indexes received a boost from oil prices in the wake of geopolitical tensions. That’s helping drive commodities to their best four-week rolling return in over two years (chart below).

But other commodities leveraged more to the demand side of economic outlook are rebounding as well. That includes key industrial and infrastructure commodities like copper that I covered last week.
We can track industrial metals with the Invesco DB Base Metals Fund (DBB). The weekly chart below shows DBB is rallying back toward resistance at the $22 level just as the MACD is turning higher from a reset at the zero line. A breakout would be another signal from commodities on economic activity.
Finally, much has been made about the impact of inflation over the last couple years on consumers, and the erosion of purchasing power. But retail sales have been surprisingly strong in recent months, while the XRT retail ETF that holds companies like Carvana (CVNA) and American Eagle Outfitters (AEO) is on the brink of a key breakout.
As you can see in the weekly chart, XRT has been consolidating gains from the prior uptrend since March. If price can move above the $80 level, that shows retail stocks discounting an improving earnings picture.
High yield bonds, commodities, and consumers all represent groups sensitive to the economic outlook. If the economy were about to tip into anything worse than a soft landing, then those sectors would reflect that message by reverting to downtrends in their price patterns.
Now What…
Despite widespread talk of recession fears and a hard landing, it’s time for investors to seriously consider the “no landing” scenario as well. That’s one where the economy doesn’t really miss a beat and keeps growing at a steady pace.
While payrolls growth had slowed in the summer months, GDP data has remained strong, initial jobless claims are staying near historically low levels, and recent retail sales reports have been strong as noted above.
Not many are discussing if the Fed acted prematurely, and might need to reconsider easing monetary policy much further. In a recent issue of The Market Mosaic, I discussed the similarities between the current easing cycle and the one that unfolded in 1995.
Back then, the Fed only cut rates by less than 1.0% as you can see below. That’s because jobs growth reaccelerated into 1996 and progress on inflation stalled with the Consumer Price Index (CPI) refusing to move below 2.5% year-over-year.
If the Fed is going to be forced to reconsider the pace and magnitude of easing, then look to the 2-year Treasury yield for clues.
As you can see in the chart below, the 2-year yield fell below fed funds back in March 2023. That was a sign that the Fed would be on hold, which is exactly what happened. Then in July, the 2-year yield fell further ahead of the first cut by the Fed.
If the 2-year starts moving back toward the current level of fed funds, that’s a sign this easing cycle could again resemble the mid-1990s with limited scope for further rate cuts.
Regardless, more central banks are cutting rates than at any time since 2020, with 21 cuts just last month. And a stronger economy coupled with a global shift toward easing monetary policy can be a tailwind for risk-on assets like stocks.
If stocks leveraged to consumer spending start breaking out as noted with XRT above, then I’m watching several individual setups in the sector. That includes Shake Shack (SHAK).
The stock peaked at the $110 level back March, and is creating a new basing pattern since then. SHAK is starting to make a series of higher lows following the pullback into July, with a recent MACD reset at zero just below price resistance. I’m watching for a move over resistance at $110.
That’s all for this week. The coming week will be a busy one for investors. Updated reports on both consumer and producer price inflation are due with CPI and PPI, along with the start of the 3Q earnings season with big banks like JPMorgan Chase (JPM) reporting. We could also see rising volatility as elections near. But I’ll be cutting through the noise by following price action in key segments of the capital markets.
I hope you’ve enjoyed The Market Mosaic, and please share this report with your family, friends, coworkers…or anyone that would benefit from an objective look at the stock market.
And make sure you never miss an edition by subscribing here:
For updated charts, market analysis, and other trade ideas, give me a follow on X: @mosaicassetco
And if you have any questions or feedback, feel free to shoot me an email at mosaicassetco@gmail.com
Disclaimer: these are not recommendations and just my thoughts and opinions…do your own due diligence! I may hold a position in the securities mentioned in this report.


