
The Market Mosaic 10.5.25
The US Dollar's Tailwind: Boost Today, Bust Tomorrow?

👋Welcome back to The Market Mosaic, where I gauge the stock market’s next move by looking at macro, technicals, and market internals. I’ll also highlight trade ideas using this analysis.
If you find this report helpful please hit that “like” button, share this post, and become a subscriber if you haven’t already done so!
🚨And be sure to check out Mosaic Traders Hub. It’s a members-only platform to alert trade ideas, track a model portfolio of open positions, and further analyze the message coming from the capital markets (👇be sure to check out our special offer below).
Now for this week’s issue…
The first government shutdown in nearly seven years is delaying the release of key data at a time when the Federal Reserve is missing on both mandates.
For the first time since late 2018, the federal government went into a partial shutdown when Congress failed to agree on a new funding bill for the fiscal year that started on October 1. The current shutdown is expected to extend at least into this coming week.
Shutdowns are typically non-events for the stock market. Looking back to the 1970s across 22 shutdown episodes, the S&P 500 has averaged a gain of 0.3% during the shutdown period and was up 54% of the time.
But this event could carry more weight for investors. That’s because federal agencies won’t be releasing key economic reports at a time when the Fed is starting to cut rates while missing on both mandates.
While the September payrolls report was delayed, an ADP report on private sector payrolls showed 32,000 jobs lost during the month (chart below) compared to expectations for a gain of 45,000.

There’s also more evidence in recent reports that consumer inflation will keep increasing in the months ahead, and could be exacerbated further by the historic weakness in the U.S. Dollar Index.
Nonetheless, markets are fixated on the prospect that the shutdown and potential furlough of hundreds of thousands of workers will present additional risks to the economy. That’s locking in forecasts for further rate cuts in the months ahead.
I maintain that this has been a slow to hire and slow to fire jobs environment, which could improve as the fog from the trade war is lifting. A strong economy coupled with rate cuts and loose financial conditions should add upside pressure to inflation in the coming months.
But for now, the rate backdrop and investor positioning remains a tailwind for the bull market. This week, lets unpack the growing challenges to the inflation outlook and how the dollar could play a key role. We’ll also examine the upside in gold stocks, and why the “dumb money” is adding more fuel for the rally.
The Chart Report
Even though the government shutdown is delaying the September payrolls report, other data continues showing weakness in the labor market. That includes the ADP report and JOLTs survey that shows more unemployed workers than job openings. While concerns over the labor market take the spotlight, inflationary pressure remain a huge issue and could push consumer prices higher in the months ahead. The ISM Services PMI showed the prices paid component staying at a high level, and was reported at 69.4 in September (where a reading above 50 indicates expansion). Prices paid (blue line) measures changes in input prices for services organizations, and tends to lead changes in the Consumer Price Index (CPI - orange line) as you can see in the chart below.

Currency debasement could present additional inflation pressures in the months ahead. The U.S. Dollar Index is having a historically bad year, and remains down about 10% year-to-date. That’s a significant decline for the world’s most important currency, where a weaker U.S. dollar increases the cost of foreign imports. While there’s a lag effect, those rising prices tends to show up in consumer inflation gauges. The Fed’s own modeling shows that a 10% decline in the dollar adds about 0.3% to inflation. The chart below plots CPI against a dollar index, which is inverted to show the positive correlation with CPI.

While the weaker dollar could spark more inflation ahead, a falling dollar tends to boost risk assets. Everything from stocks to commodities tends to see a tailwind from a weaker dollar for various reasons. Domestic large-cap stocks that receive a large portion of revenues from international regions typically experience an earnings bump from a falling dollar. Commodities are often priced and traded in dollars, where a weak dollar increases the purchasing power of non-U.S. buyers. The chart below shows the correlation over recent time frames for various assets to the dollar, where a negative correlation has been a tailwind for everything from the S&P 500 to gold and silver.

While hype (and valuations) around artificial intelligence (AI) stocks like Nvidia continues running high, precious metals and related mining stocks are among 2025’s leaders. Gold prices are up 46% this year, while silver has gained 63%. That’s fueling mining stocks as well, with the VanEck Gold Miners ETF (GDX) up 127% this year as high metal prices boosts earnings and the outlook for more growth. The chart below plots an index of gold mining stocks (white line) along with trailing 12 months earnings per share (blue line). Earnings in mining companies are actually expanding quicker than stock price appreciation, which is keeping a lid on mining company valuations.

The stock market continues climbing the “wall of worry.” Despite concerns over the health of the labor market and economic impact of the government shutdown, the S&P 500 is hovering near record highs and has spent 108 consecutive days trading above its 50-day moving average. But investors have collectively been slow to add equity exposure, with various measures of sentiment and positioning data showing mostly neutral readings at a time when you’d expect bullishness to be running high. By some measures, it’s even the opposite. S&P 500 stock index futures positioning shows a relatively large net short position by large speculators. They’re considered to be the “dumb money” in the data series, and are pushing bets against the S&P 500 to levels that you tend to see around major market lows.

Heard in the Hub
The Traders Hub features live trade alerts, market update videos, and other educational content for members.
Here’s a quick recap of recent alerts, market updates, and educational posts:
Why valuations don’t matter (and when they do).
The rally off the April lows remains under-owned.
Growing stock market similarities to the internet bubble.
Why the weak U.S. dollar is another catalyst for rising inflation.
You can follow everything we’re trading and tracking by becoming a member of the Traders Hub.
By becoming a member, you will unlock all market updates and trade alerts reserved exclusively for members.
🚨Hub members are now up over 100% on a gold mining stock we added in March. Check out the special offer below to join the Hub today.
👉You can click here to join now👈
Trade Idea
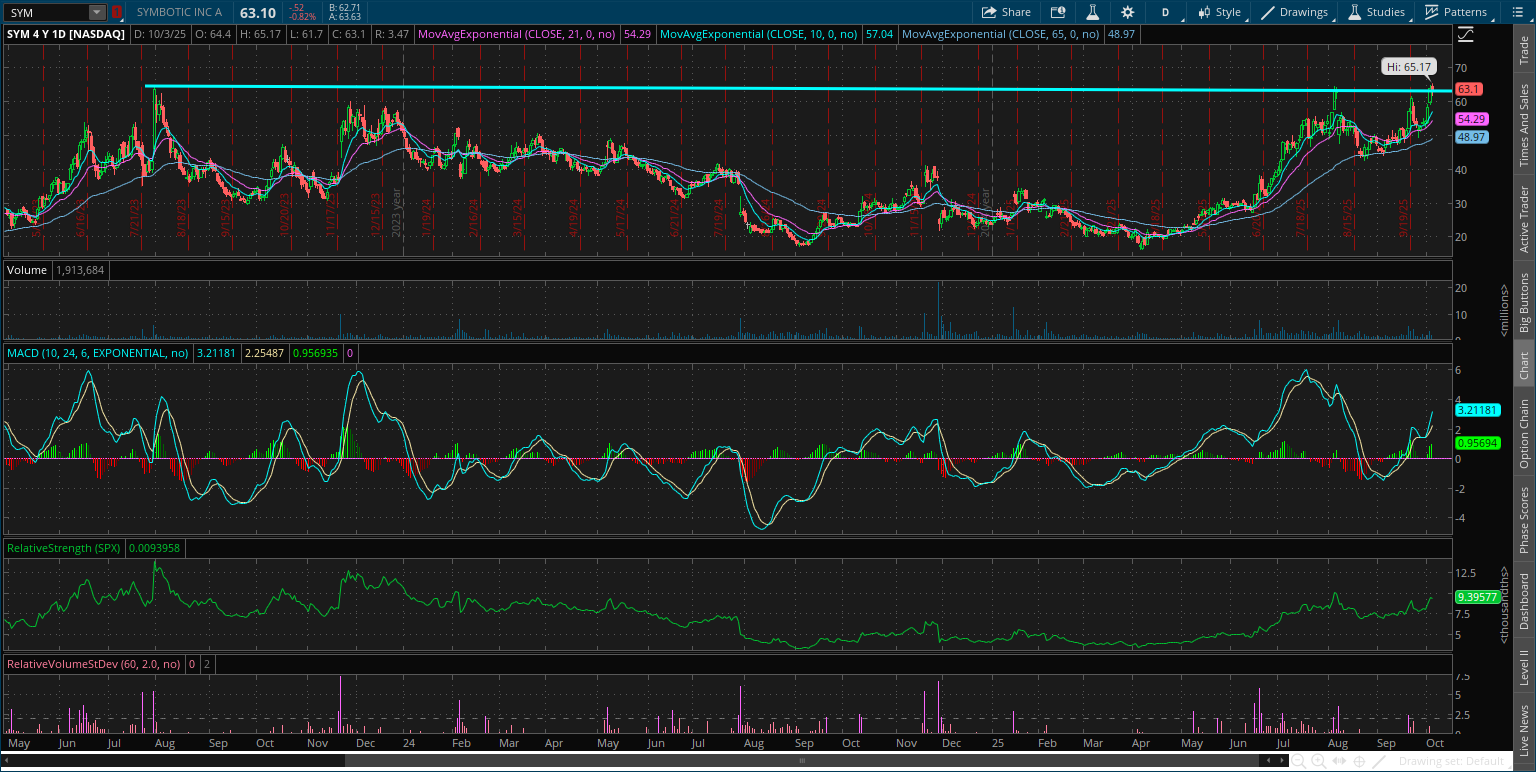
Symbotic (SYM)
Robotics stock coming back to test the prior high near $63 on a couple occasions since August. Each pullback off that level is getting smaller, with a recent MACD reset at the zero line. I’m watching for a mover over $63 on expanding volume.
Key Upcoming Data
Economic Reports
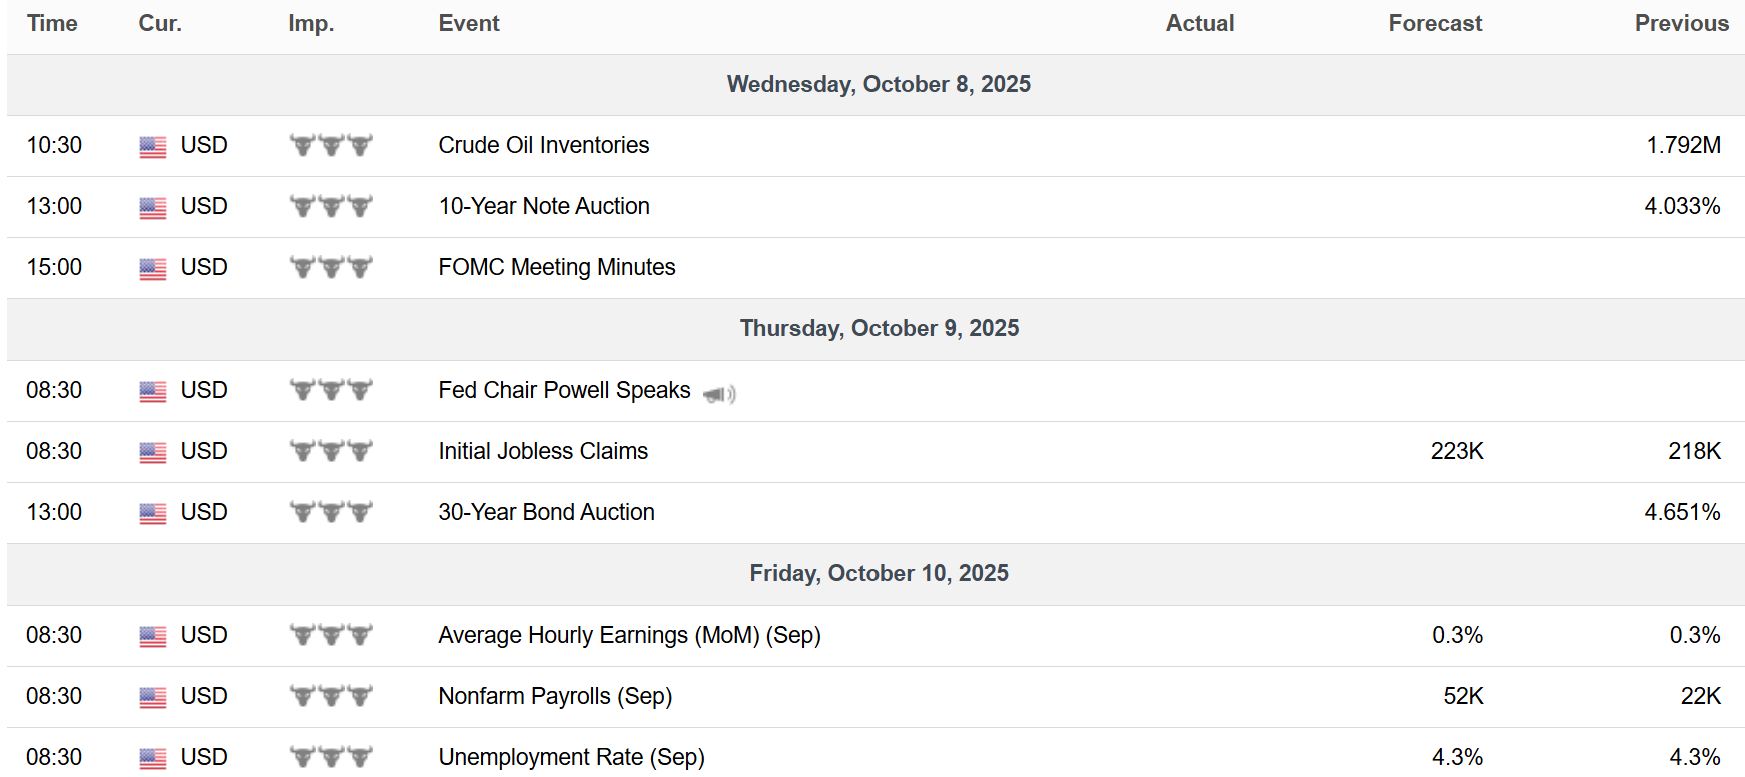
Earnings Reports

I hope you’ve enjoyed The Market Mosaic, and please share this report with your family, friends, coworkers…or anyone that would benefit from an objective look at the stock market.
Become a member of the Traders Hub to unlock access to:
✅Model Portfolio
✅Members Only Chat
✅Trade Ideas & Live Alerts
✅Mosaic Vision Market Updates + More
Our model portfolio is built using a “core and explore” approach, including a Stock Trading Portfolio and ETF Investment Portfolio.
Come join us over at the Hub as we seek to capitalize on stocks and ETFs that are breaking out!
And if you have any questions or feedback, feel free to shoot me an email at mosaicassetco@gmail.com
Disclaimer: these are not recommendations and just my thoughts and opinions…do your own due diligence! I may hold a position in the securities mentioned in this report.