
The Market Mosaic 10.26.25
S&P 500: Breadth and Sentiment Could Send the Rally into Overdrive.

👋Welcome back to The Market Mosaic, where I gauge the stock market’s next move by looking at macro, technicals, and market internals. I’ll also highlight trade ideas using this analysis.
If you find this report helpful please hit that “like” button, share this post, and become a subscriber if you haven’t already done so!
🚨And be sure to check out Mosaic Traders Hub. It’s a members-only platform to alert trade ideas, track a model portfolio of open positions, and further analyze the message coming from the capital markets (👇be sure to check out our special offer below).
Now for this week’s issue…
The partial federal government shutdown is now the second longest in history, but inflation and economic growth data are driving the S&P 500 to fresh record highs.
Various government agencies have stopped releasing economic reports during the shutdown. But a legally mandated Consumer Price Index (CPI) was updated to determine cost of living adjustments for social security.
The CPI report for the month of September showed a headline increase of 3% while the core figure that strips out food and energy prices also gained by 3% compared to last year. More recent annualized changes in the core CPI have been inflecting higher (chart below).

While the headline figure accelerated to the highest level since January, the increase in CPI was less than expected which is boosting hopes for rate cuts by the Federal Reserve.
Market-implied odds are locked into a quarter point cut at the Fed’s last two meetings this year, including the next Fed meeting later this week. A total of five rate cuts are now expected over the coming year.
Global efforts to reduce rates are already well underway. Through last month, there have been 312 rate cuts on a two-year cumulative basis which is the most since the aftermath of 2008’s financial crisis.
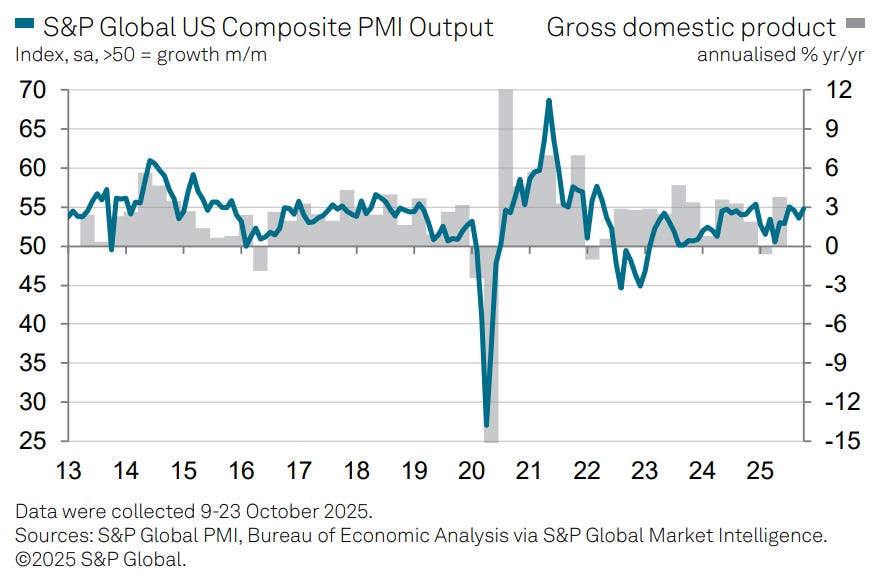
At the same time, S&P Global released an initial look at manufacturing and service sector activity for the month of October. The report, which takes on increased importance as government data is delayed, showed activity jumping to its best level in three months.
Evidence of economic growth is boosting the earnings outlook while loose financial conditions is a catalyst for more growth. The prospect of the Fed cutting interest rates into a strong economic backdrop and already loose conditions is more fuel for the stock market rally.
This week, lets unpack the global monetary easing cycle underway and how it’s rivaling rate cuts seen during times of crisis. We’ll also look at alternative data for clues on the health of the economy, and why conditions are aligned to send the stock market rally into overdrive in the months ahead.
The Chart Report
Progress on consumer inflation stalled out over a year ago with core CPI hovering around 3% since July 2024. That’s well above the Fed’s 2% inflation target, but concerns over the health of the labor market is locking expectations for more rate cuts ahead. The Fed recently restarted the cutting cycle with a 0.25% cut at the September meeting, which means the Fed is rejoining the global easing cycle already underway. The chart below shows cumulative central bank rate cuts over the past two years. You can see that the total number of cuts is approaching levels seen after the 2008 financial crisis, which has been a massive tailwind for the rally in risk assets.

Concerns over the health of the economy are intensifying as the partial government shutdown becomes the second longest in history. There’s the immediate impact of less government spending and furloughed federal workers, which is estimated at $7 billion per week. Government agencies are also not releasing key economic reports during the shutdown, leaving investors in the dark about the state of the economy. But private sector companies are still releasing data, and a report from S&P Global shows U.S. economic growth accelerating. The composite PMI indicator covering the services and manufacturing sector increased to 54.8 in October (blue line in the chart below), which is a three-month high. A reading above 50 indicates expanding activity.
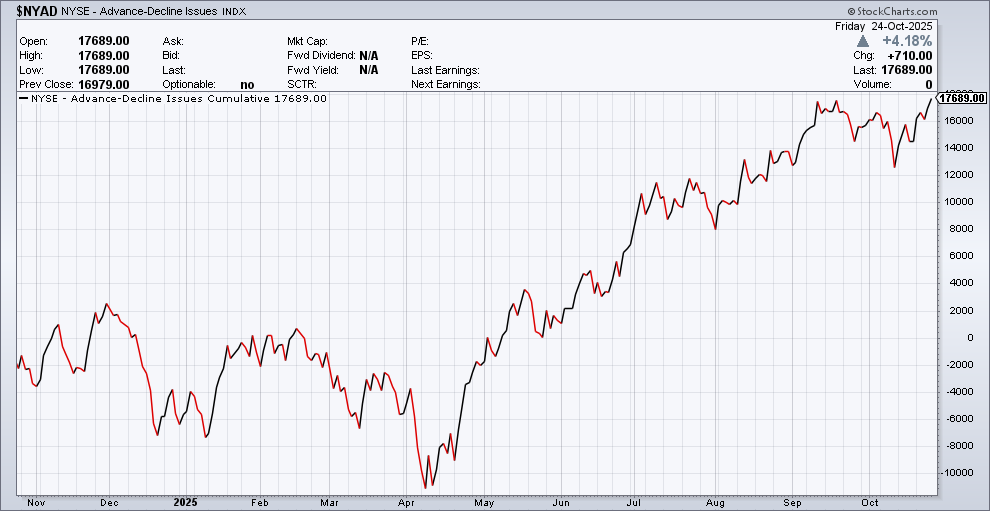
Fears over a stock market bubble are growing as concentration in the stock market’s major indexes hits record highs. The top 10 stocks in the S&P 500 now make up nearly 41% of the index, which is a record level in such few stocks. While the market’s top names continue rallying, that’s masking strength still being seen in the average stock. Tracking the number of advancing versus declining stocks across the market is one way of gauging the average stock, including the NYSE cumulative advance/decline line. The NYSE A/D line is essentially an index of the average stock on the exchange, and is making a new all-time high last week as you can see in the chart below.
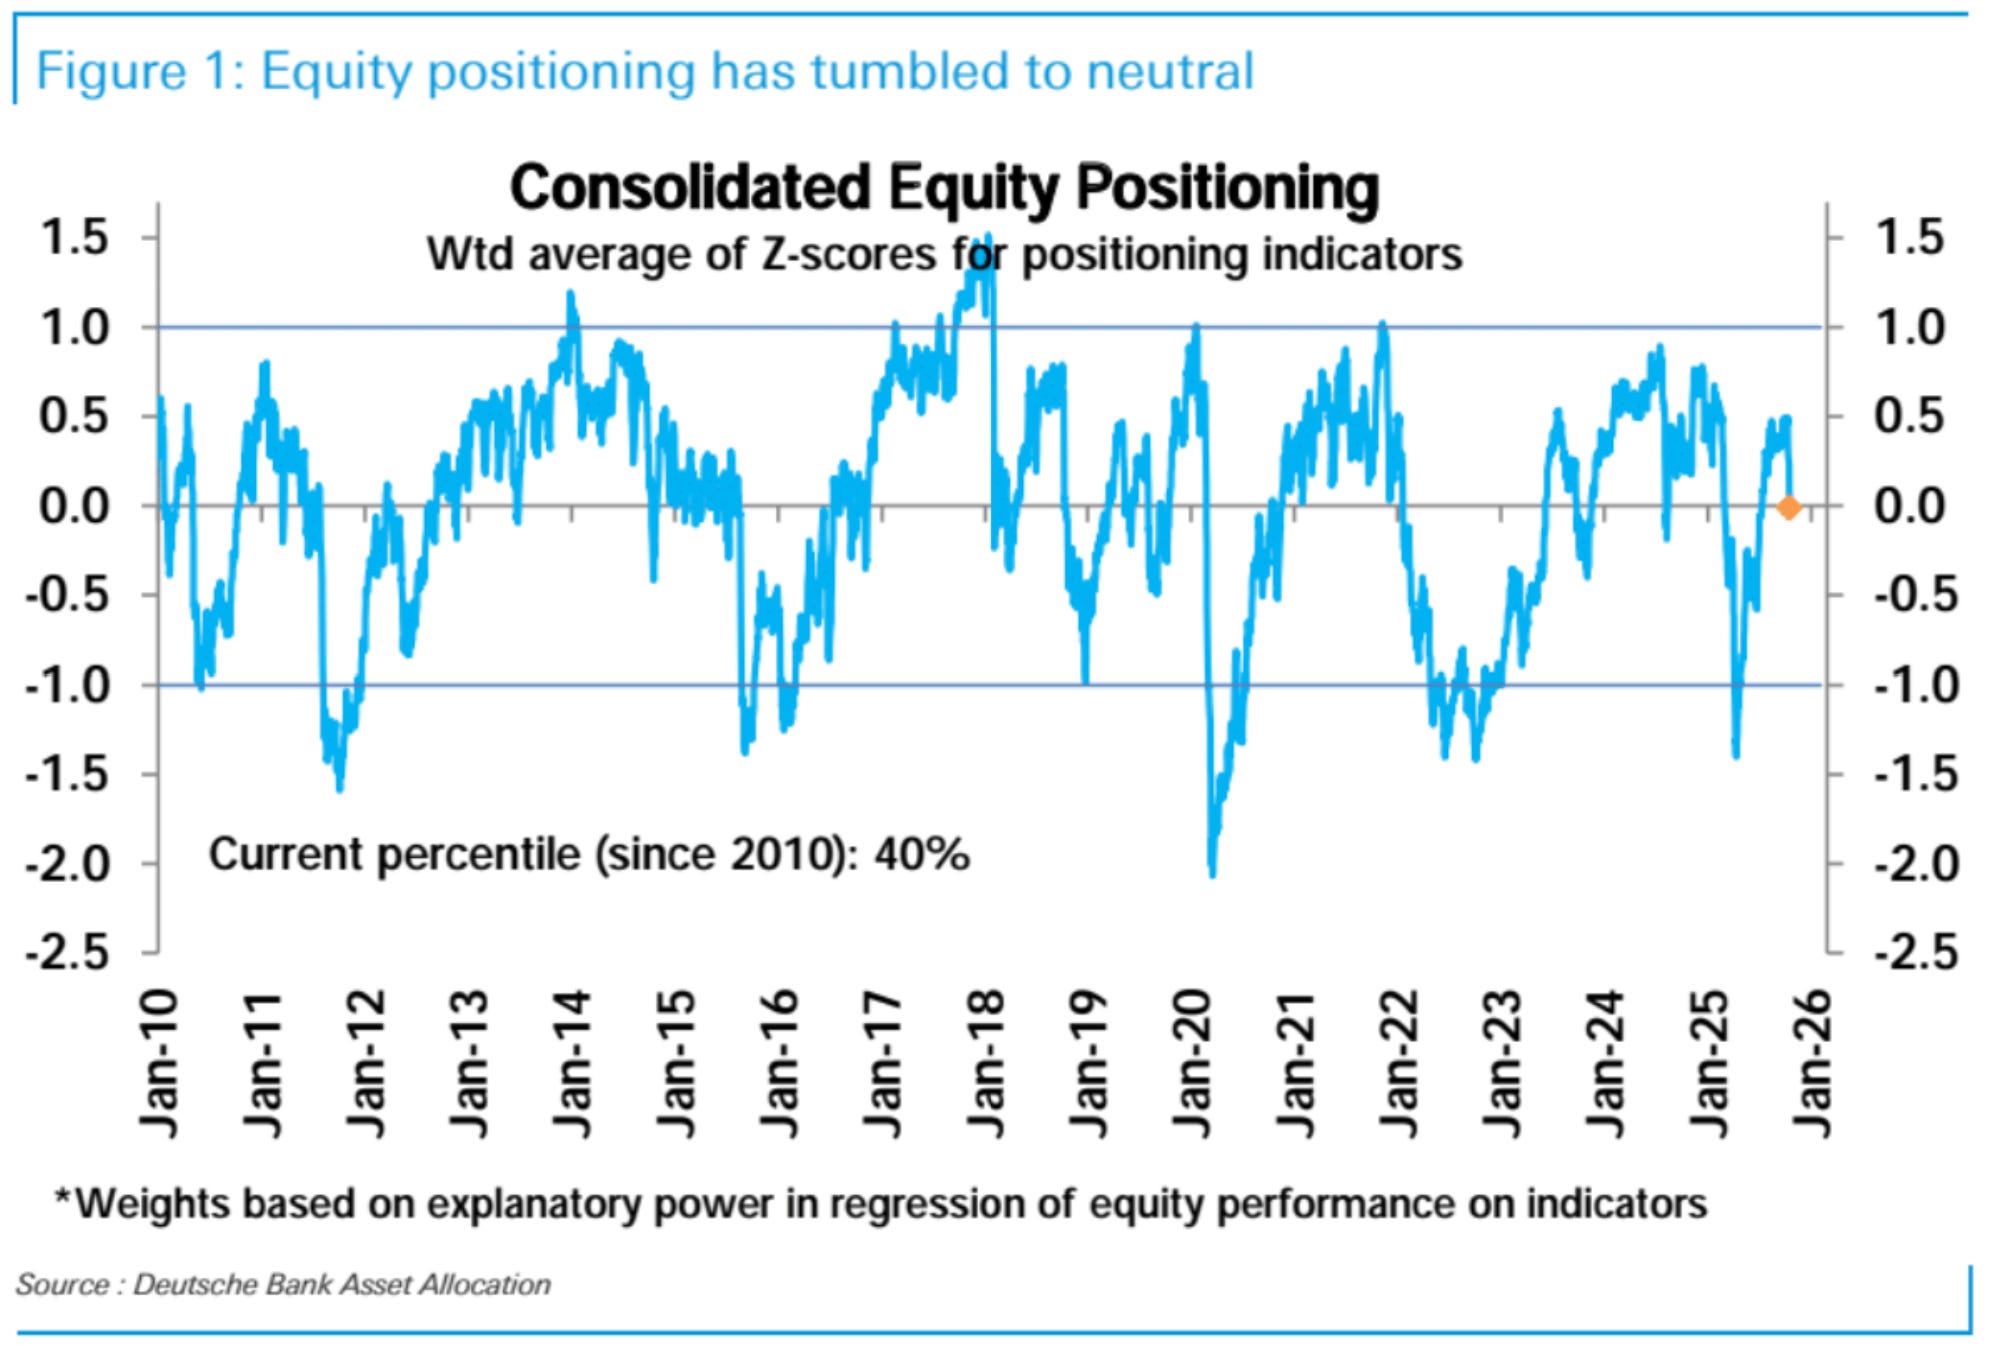
There’s a popular saying that the stock market will climb a “wall of worry”, and the rally off the early April lows has been a perfect example. Investor sentiment has been quick to shift back into fear territory on any rumblings in the stock market. Despite the S&P 500 at record highs, CNN’s Fear & Greed Index is showing fear as the prevailing emotion while the AAII survey of retail investors has bearish views at 42.7% which is well above the historical average and outnumbers bullish views. Indicators of positioning are also nowhere near extremes. An indicator of equity positioning from Deutsche Bank shows equity exposure at neutral levels following the largest weekly drop since the selloff in April on trade war headlines.
Just as investor sentiment shifts to bearishness, equity exposure is being reduced, and breadth metrics are signaling strong participation, the S&P 500 is starting its best short-term seasonal stretch based on historical trends. The “sell in May and go away” period concludes with the start of November, where a favorable six month period now runs through April. On a three-month forward return basis, last week marks the start of the best period for the S&P 500 using data going back to 1928 (chart below). I believe accelerating economic growth, bearish investor sentiment and positioning, and strong breadth supports the strong seasonal backdrop for the S&P 500.

Heard in the Hub
The Traders Hub features live trade alerts, market update videos, and other educational content for members.
Here’s a quick recap of recent alerts, market updates, and educational posts:
Signs that gold’s rally is due for a pause.
There’s more room for margin debt to rise.
VIX similarities to past stock market bubbles.
Investors remain underexposed to the stock market.
The next semiconductor stock that could breakout higher.
You can follow everything we’re trading and tracking by becoming a member of the Traders Hub.
By becoming a member, you will unlock all market updates and trade alerts reserved exclusively for members.
🚨Hub members recently locked in gains of 244.4% and 165.4%. Check out the special offer below to join the Hub today!
👉You can click here to join now👈
Trade Idea
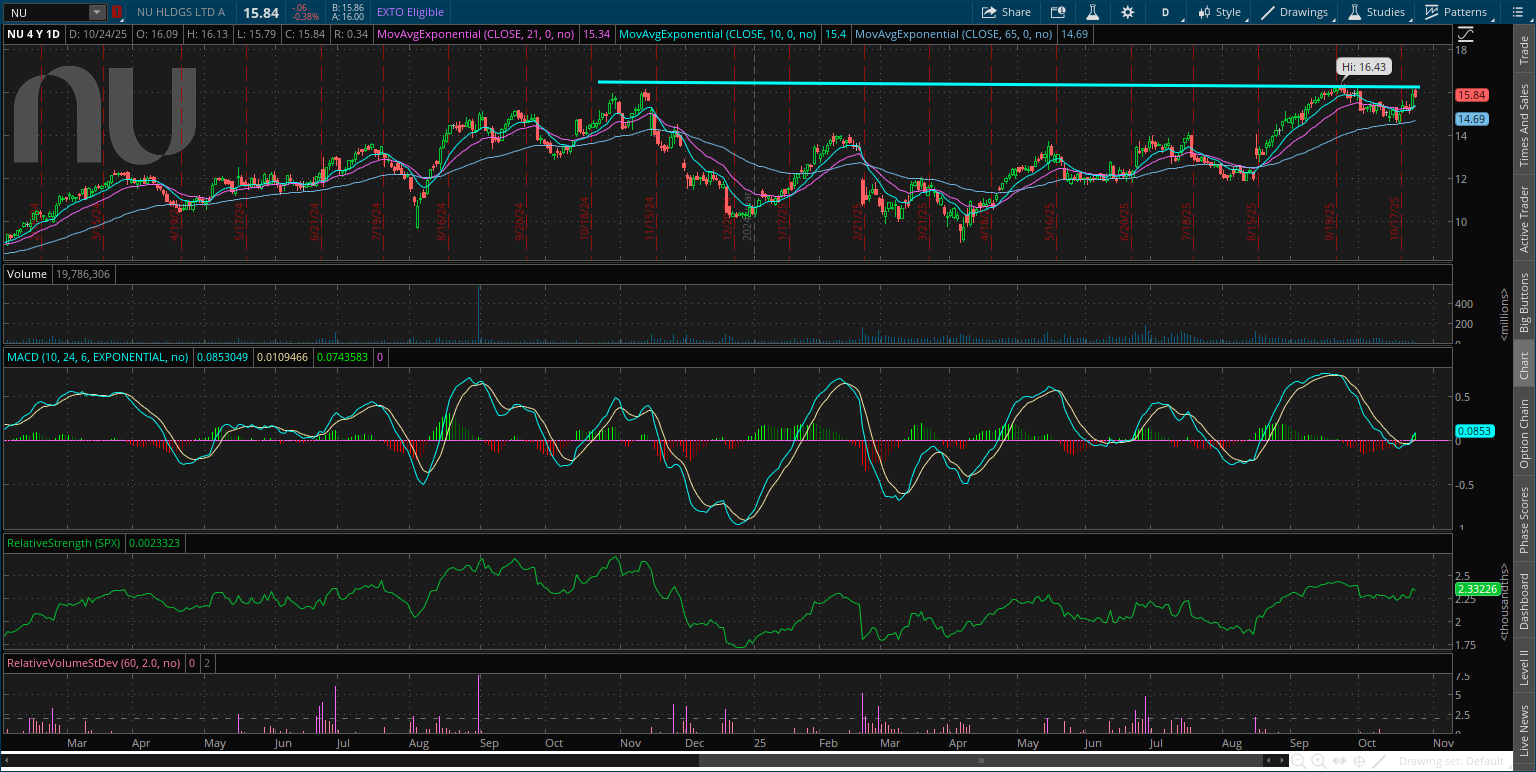
Nu Holdings (NU)
The stock ran to the $16 level in November and started a new basing pattern. NU is making a series of higher lows since April with price back to resistance at $16. I would like to see a smaller pullback to reset the MACD before breaking out over $16.
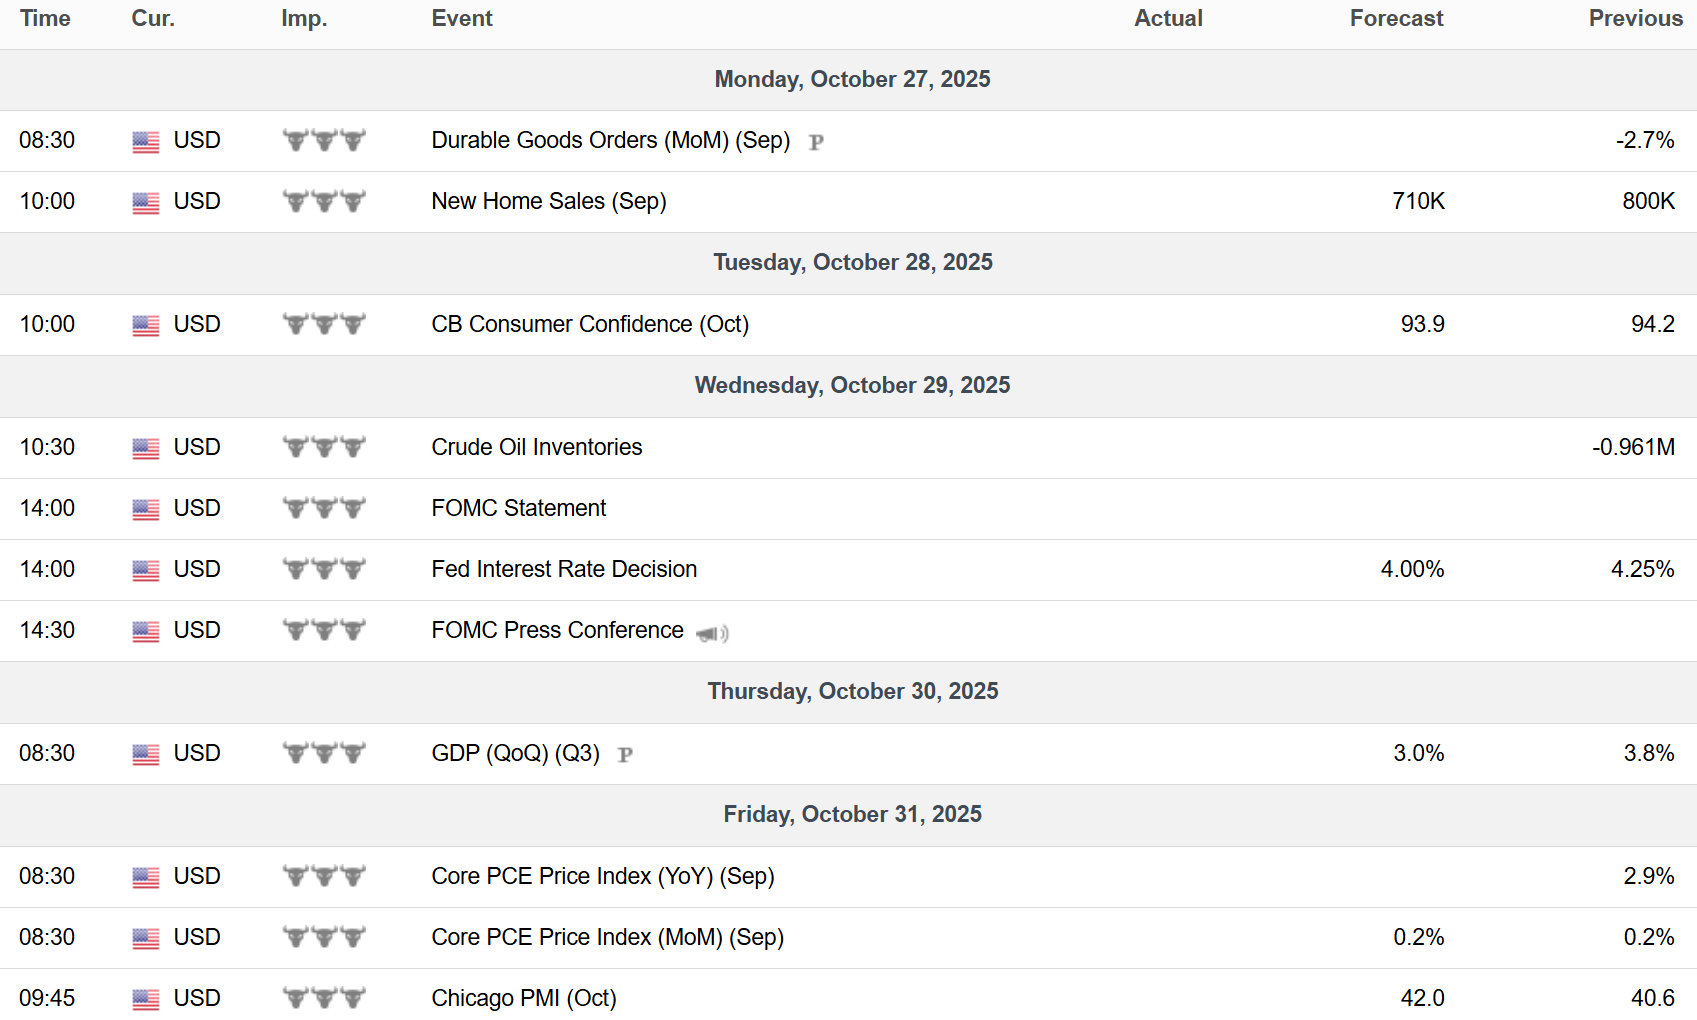
Key Upcoming Data
Economic Reports
Earnings Reports

I hope you’ve enjoyed The Market Mosaic, and please share this report with your family, friends, coworkers…or anyone that would benefit from an objective look at the stock market.
Become a member of the Traders Hub to unlock access to:
✅Model Portfolio
✅Members Only Chat
✅Trade Ideas & Live Alerts
✅Mosaic Vision Market Updates + More
Our model portfolio is built using a “core and explore” approach, including a Stock Trading Portfolio and ETF Investment Portfolio.
Come join us over at the Hub as we seek to capitalize on stocks and ETFs that are breaking out!
And if you have any questions or feedback, feel free to shoot me an email at mosaicassetco@gmail.com
Disclaimer: these are not recommendations and just my thoughts and opinions…do your own due diligence! I may hold a position in the securities mentioned in this report.