Welcome back to The Market Mosaic, where I gauge the stock market’s next move by looking at trends, market internals, and the mood of the crowd. I’ll also highlight one or two trade ideas using this information.
If you find this content helpful please hit that “like” button, share this post, and become a subscriber to this always free newsletter if you haven’t already done so!
Also, be sure to check out Mosaic Chart Alerts. It’s a midweek update covering my best chart setups among long and short ideas in the stock market, along with specific levels that would trigger a trade.
Now for this week’s issue…
When British Prime Minister Liz Truss announced a new round of unfunded tax cuts to help stimulate the U.K. economy, she probably didn’t anticipate the knock-on effects.
Faced with more borrowing to fund the plan, yields on U.K. government debt yields surged, the pound collapsed to its lowest level ever against the dollar (chart below), and the country’s central bank was forced to restart quantitative easing to contain interest rates. The central bank intervention was needed to prevent British pensions from facing margin calls and becoming insolvent…putting retirement funds at risk.
And that is just a microcosm of the turmoil that could engulf the globe. That’s because capital markets are interwoven in a complex web spanning stock, currency, commodity, and bond markets. It’s the fixed income market that can really cause a fuss as we saw with the U.K. episode, which is why investors are on edge as central banks unwind massive stimulus programs implemented since the 2008 financial crisis and amplified by the pandemic.
So with that in mind, perhaps the biggest catalyst for this week’s continued stock market losses (S&P 500 down another 2.9%) stemmed from the action in the 10-year Treasury. Yields touched 4%, which is the highest level in more than a decade which means bond prices continue to fall.
Historically, bond prices tend to zig when stocks zag, offering a diversification benefit. But stocks and bonds are falling together at a pace never seen before, with three consecutive quarters where both have fallen (credit @WillieDelwiche).
It sure does feel like volatility across asset classes is converging, and here’s why it could render traditional stock trading indicators useless.
The Right Tools But the Wrong Time
Stocks have pulled back sharply, with the S&P 500 falling 9.3% in September alone. That’s the worst monthly return since 2020’s bear market, and has the S&P 500 testing new lows (chart below).
And with the relentless decline, the chorus of investors calling for oversold conditions is becoming very loud. I’ve also noted the presence of such conditions in this week’s Mosaic Chart Alerts, where I called out the percent of stocks trading above their 50-day moving average. Here’s that chart below, where the metric is close to falling under 10%.
But we could be entering a dangerous new phase of this bear market where oversold conditions and technical indicators just don’t matter. When turmoil spreads from one market to another and asset prices become highly correlated on the downside, there’s no telling when the cascading waterfall will abate. Just look at the U.K. episode from last week, and imagine that happening on a much bigger scale.
Look at 2008 for another example where oversold conditions simply don’t matter. Here’s the same chart from 2008, where at the start of October the percent of stocks above their 50-day crossed below 10%. But as you can see with the shaded box, the plunge in prices was just beginning. Oversold conditions remained as the S&P went on to fall 32% in less than two months.
I’m not suggesting that we are on the precipice of a similar decline, but I am keeping the 2008 example in mind especially as other cross-asset signals deteriorate.
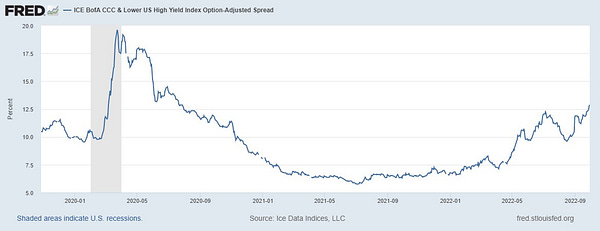
That includes high yield bond spreads, which I covered here last week. The riskiest tranche of junk bonds are those rated “CCC” or lower. If concerns over financial distress are emerging, CCC is the first group to start moving. I tweeted about the developing breakout in yields here:
Now What…
With the ongoing weakness in stocks, it should be no surprise that our watchlist of long setups aren’t triggering many buy signals. Recall that my trading strategy revolves around the dual breakout of price and relative strength, and the price component has been lacking.
But pullbacks are a great opportunity to update your watchlist with stocks showing relative strength and bucking the bear market trend. And there’s still a few bright spots on the long side, like with HLIT that I noted a couple weeks ago. The stock has continued to build on its breakout as you can see below:
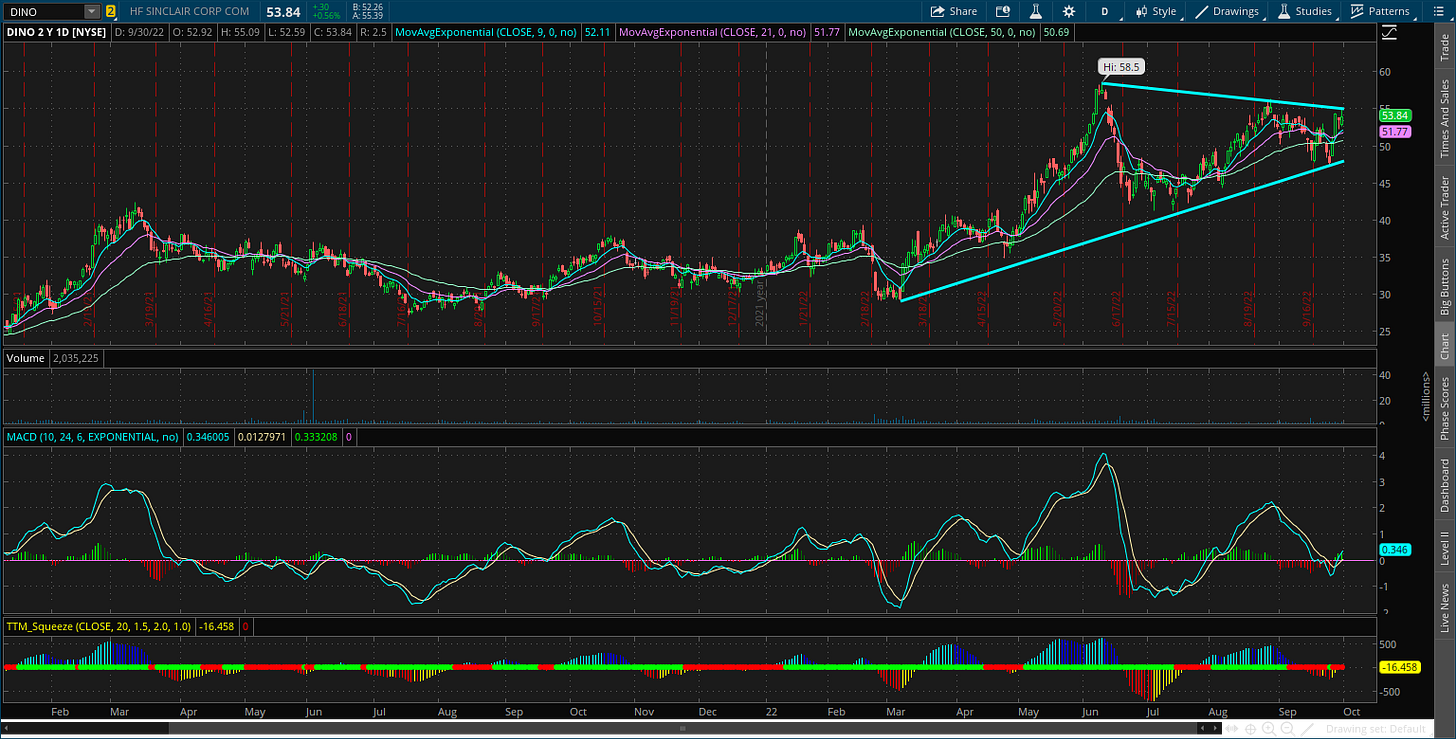
DINO is also showing relative strength again, and is now trading just below its breakout level.
But most patterns breaking out are still on the short side. Just look at the action in CCL, where we’ve tracked a bear flag setup for weeks.
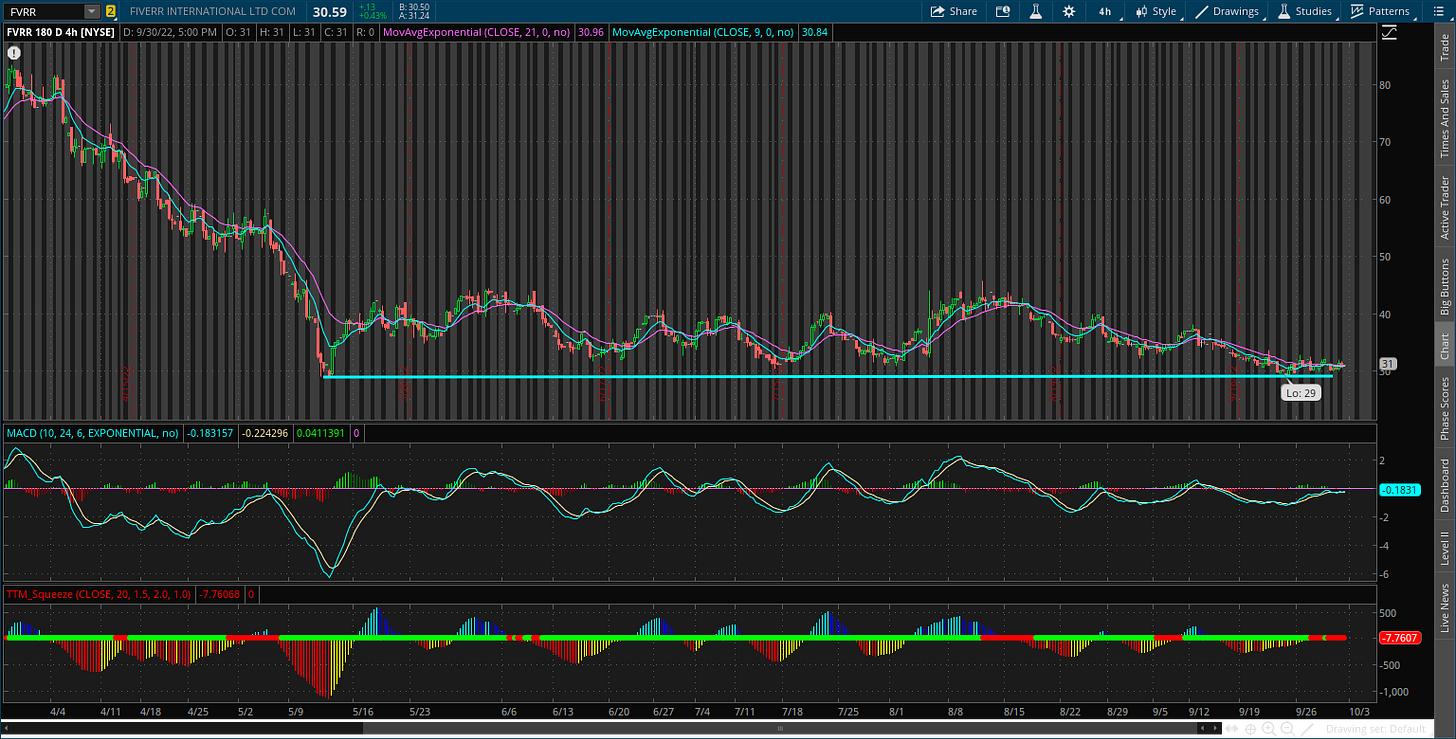
And there are still plenty of short setups on my watchlist that are on the verge of breaking down, like with FVRR that is trading just above the $30 support level.
If short setups keep playing out with more downside in the stock market, start watching for signs of panic like with high yield spreads noted above. It’s those capitulation signals that will end this bear market. But unfortunately, that means I expect more steep declines ahead and why cash remains my largest position.
I hope you’ve enjoyed this edition of The Market Mosaic, and please share this newsletter with anyone you feel could benefit from an objective look at the stock market.
And make sure you never miss an edition by subscribing here:
For updated charts, market analysis, and other trade ideas, give me a follow on twitter: @mosaicassetco
And if you have any questions or feedback, feel free to shoot me an email at mosaicassetco@gmail.com
Disclaimer: these are not recommendations and just my thoughts and opinions…do your own due diligence! I may hold a position in the securities mentioned in this newsletter.


