
The Market Mosaic 10.20.24
A global easing cycle can boost economic activity.

Welcome back to The Market Mosaic, where I gauge the stock market’s next move by looking at macro, technicals, and market internals. I’ll also highlight trade ideas using this analysis.
If you find this content helpful please hit that “like” button, share this post, and become a subscriber if you haven’t already done so!
And be sure to check out Mosaic Chart Alerts. It’s a midweek update covering chart setups among long and short trade ideas in the stock market, along with levels I’m watching.
📢There’s a new premium feature coming to my newsletter: Mosaic Traders Hub🔥
The Hub goes live on 10/28, and you can read all the details of what’s included in the Hub here (plus several new features).
The Hub is a massive expansion of what I cover in The Market Mosaic plus more trade ideas…be sure to reserve your spot before we go live!
For today’s update, I want to highlight several key charts I’m watching for the capital markets and how they are impacting the near-term outlook.
I also have a quick summary and links to recent posts that remain impactful for monitoring the markets. And after that, you can find a few trade ideas and chart updates on setups that I’m monitoring.
Big Picture
After the Federal Reserve delivered an outsized interest rate cut over concerns for the economy and labor market, more evidence is emerging that the consumer is in good shape. Retail sales for the month of September rose by a better-than-expected 0.4% compared to the prior month. That’s helping drive the Atlanta Fed’s estimate of GDP growth for the most recent quarter to new highs. Following the retail sales report, estimated annualized growth for third quarter GDP now stands at 3.4%.
The National Bureau of Economic Research (NBER) is the body responsible for determining and dating U.S. economic recessions. The NBER looks at measures like industrial production and employment to determine if the economy is in recession. The chart below shows NBER recession indicators, and the number showing month-over-month negative readings. Just one indicator is showing a negative reading, supporting the view that the economy remains in an expansion phase.

As more signs emerge that the economy is performing just fine, easier monetary policy is accelerating on a global scale. The European Central Bank is the latest cutting interest rates last week, with a growing number of banks around the world easing monetary policy. The chart below shows an indicator of financial tightness (blue line), where a rising line indicates less restrictive rates. You can see that’s historically stimulative for manufacturing activity, and leads the ISM Manufacturing PMI (black line).

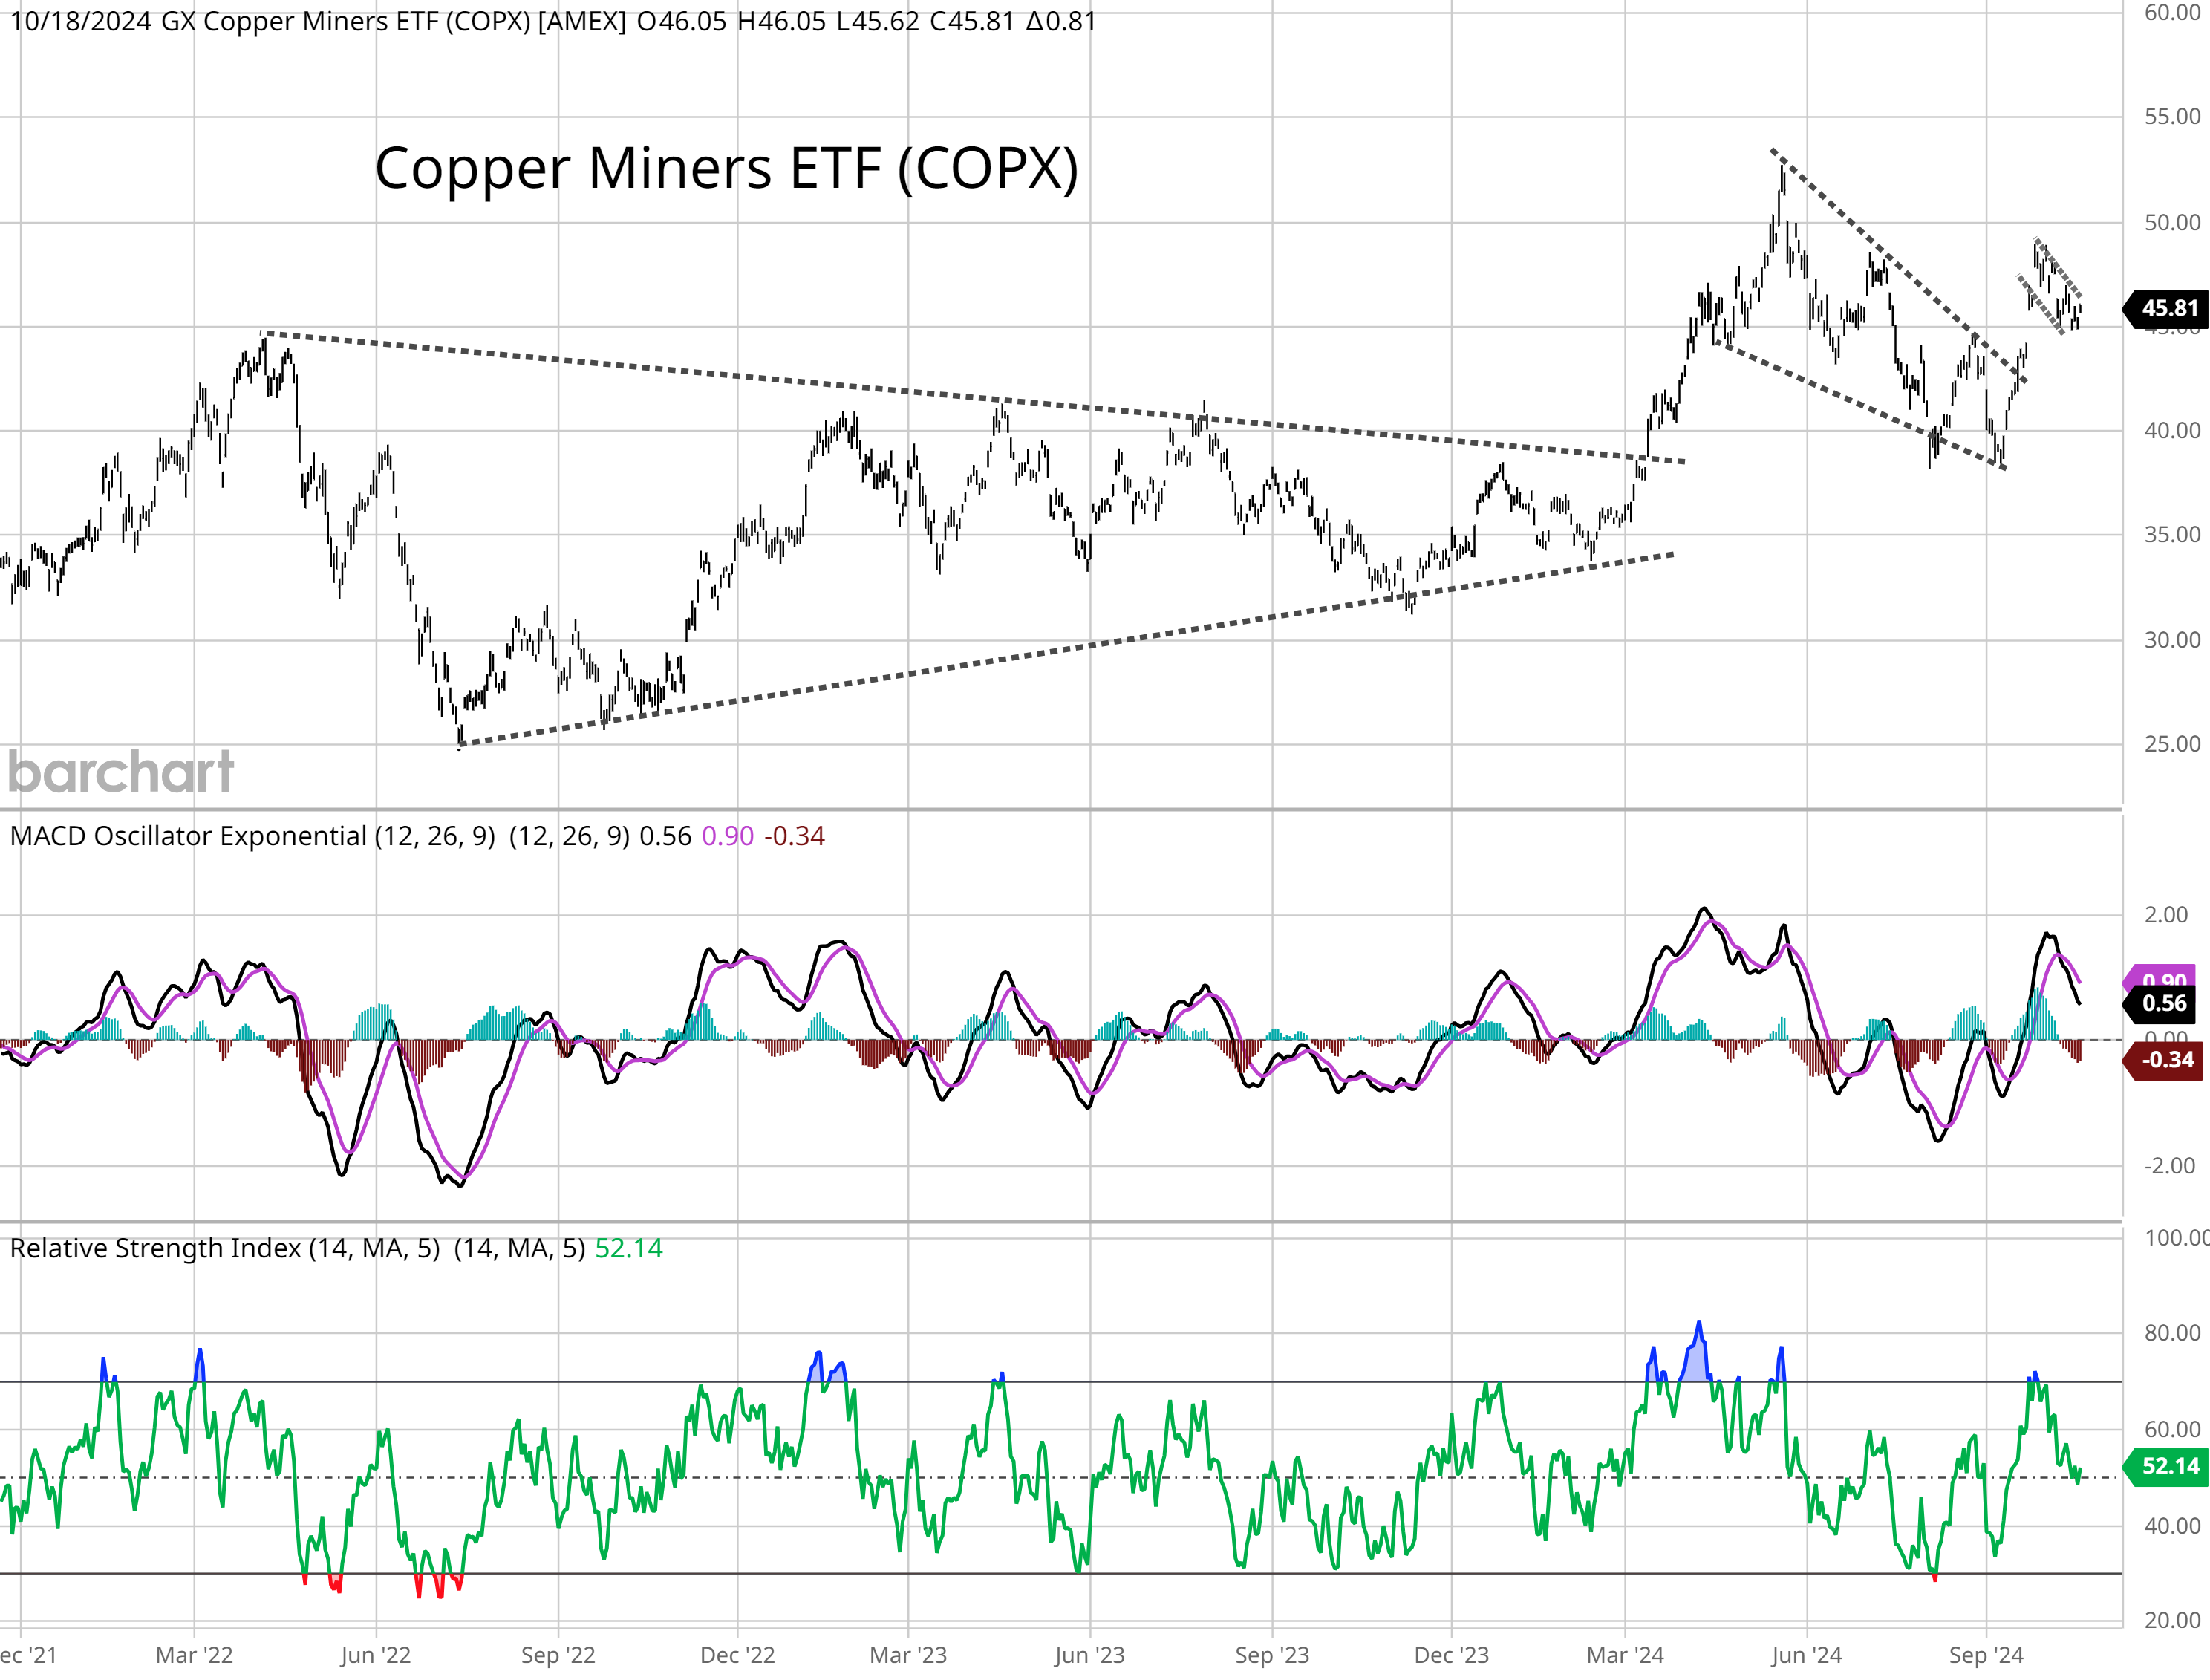
Cyclical sectors like banks and transportation are recently sending a positive message on the economic outlook. Another signal could come from copper mining stocks. The chart below shows the COPX exchange-traded fund (ETF) of copper miners. You can see that COPX has been progressing through several bullish setups and breakouts. That started with the symmetrical triangle in March, which was followed by a falling wedge pattern into September that back tested the triangle breakout. After breaking out from the wedge COPX is now making a bullish flag pattern just as the MACD resets at zero along with the RSI holding over 50.
The U.S. Dollar Index is rallying off a key support level near the 100. That’s bringing an oscillator tracking the dollar’s momentum to the most overbought level since 2022 as you can see below. At the same time, the dollar is encountering resistance at the 200-day moving average. If the dollar rejects lower, watch for another test and potential breakdown below the 100 support level that has held since early 2023.

Recent strengthening in the U.S. Dollar Index should be bearish for precious metals that are priced in dollars. But both gold and silver are rallying despite the dollar’s move higher. While gold’s move to new all-time highs over the past week is receiving most of the attention, silver’s breakout from a bullish consolidation pattern suggests a new uptrend phase. As you can see below, silver is breaking out of an ascending triangle pattern. The MACD reset at the zero line and RSI turn higher off the 50 level is positive for more upside momentum ahead.

Mosaic Tidbits
Here are a few of my recent posts that are still impactful and relevant to the stock market’s next move:
The third quarter earnings season is underway for companies in the S&P 500. Recent earnings growth has been driven by the “Magnificent 7”, but there are signs that growth contributions from the average stock is set to catch up.
Following the price action in cyclical sectors leveraged to the economy can deliver clues about the outlook. One sector is breaking out from a three year consolidation pattern, and is the latest sign that the economic growth outlook remains strong.
The Federal Reserve made it clear that the labor market is taking precedent among its dual mandate of price stability and full employment. But a strong payrolls report coupled with stubbornly high core inflation could complicate the Fed’s plan to cut interest rates.
Once the Fed starts cutting interest rates, the path of the stock market comes down to a “soft landing” for the economy. Here are several signs from the capital markets that the economy will stick the landing.
Heard in the Chat
Once the Hub goes live on 10/28, only members of Mosaic Traders Hub will be able to access the chat.
Here’s a quick recap of alerts and market updates posted in the chat:
Taking an SLV trade for silver’s breakout.
Taking a KBE trade for the breakout in banks.
My plan to get long COPX if copper miners move higher.
Taking an MDY trade for the breakout in mid-cap stocks.
Breaking down chart action in FAST and SNA in industrial products.
You can follow everything we’re tracking and trading in the chat here:

Chart Updates
NVIDIA (NVDA)
Rallied to the $135 level in June and consolidating gains since then. New basing pattern making a series of higher lows and recently testing resistance at $135 again. Would prefer to see a MACD reset at the zero line before attempting to breakout.

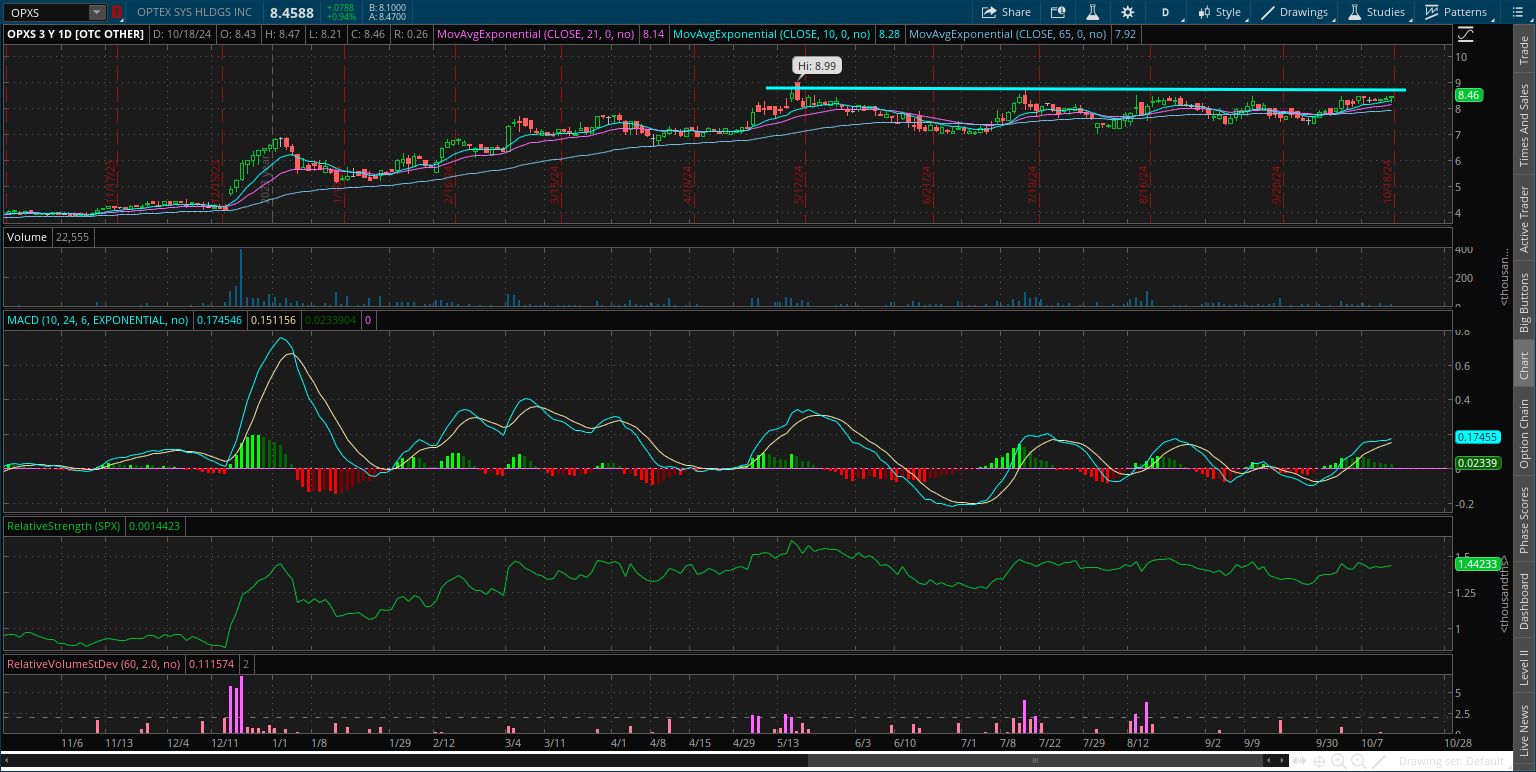
Optex Systems Holdings (OPXS)
Peaked near the $8.50 level in May and setting up in a new consolidation pattern. Series of smaller pullbacks following a test of resistance on four occasions. Would like to see a MACD reset at zero before a move over $8.50.
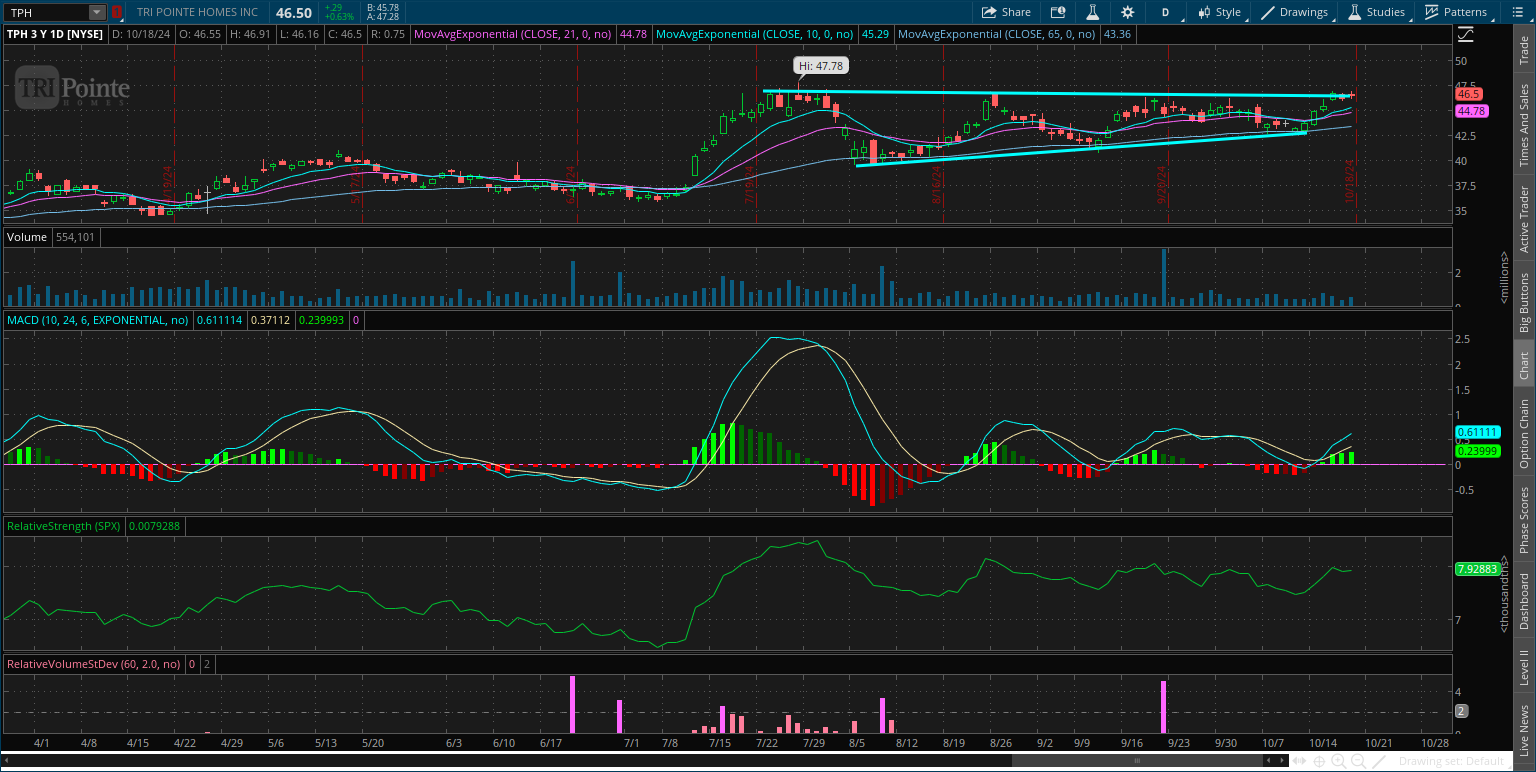
Tri Pointe Homes (TPH)
After rallying to the $47 level in July, the stock has been consolidating gains. Recent series of smaller pullbacks off the $47 resistance level, while the relative strength line is holding near the high. I’m watching for a breakout over $47 on higher volume with confirmation by the relative strength line.
I hope you’ve enjoyed The Market Mosaic, and please share this report with your family, friends, coworkers…or anyone that would benefit from an objective look at the stock market.
And make sure you never miss an edition by subscribing here:
For updated charts, market analysis, and other trade ideas, give me a follow on X: @mosaicassetco
And if you have any questions or feedback, feel free to shoot me an email at mosaicassetco@gmail.com
Disclaimer: these are not recommendations and just my thoughts and opinions…do your own due diligence! I may hold a position in the securities mentioned in this report.