
The Market Mosaic 10.19.25
Is Volatility Set to Spark a Stock Market Plunge?

👋Welcome back to The Market Mosaic, where I gauge the stock market’s next move by looking at macro, technicals, and market internals. I’ll also highlight trade ideas using this analysis.
If you find this report helpful please hit that “like” button, share this post, and become a subscriber if you haven’t already done so!
🚨And be sure to check out Mosaic Traders Hub. It’s a members-only platform to alert trade ideas, track a model portfolio of open positions, and further analyze the message coming from the capital markets (👇be sure to check out our special offer below).
Now for this week’s issue…
October has a hard-earned reputation for market volatility, and this year is no different as the stock market tests key support levels and volatility spikes to the highest level since the start of the trade war.
The initial pullback in the S&P 500 off record highs started with trade war headlines as China announced new export controls on rare earth materials and President Trump hit back with threats of an additional 100% tariff on Chinese imports.
That sparked a single-day drop of 2.7% in the S&P 500, which was the largest daily decline since April. Volatility was also amplified last week on a sharp selloff in regional bank shares.
Concerns over regional banks have lingered since March 2023, when a growing bank crisis surrounding unrealized losses on Treasury securities led to several bank failures in the U.S. including Silicon Valley Bank and the ultimate demise of Credit Suisse that was acquired by UBS.
Growing liquidity concerns in short-term funding markets along with loan losses at several regional banks led to large declines in bank stocks, including Zions Bancorp that lost 13% in a single day.
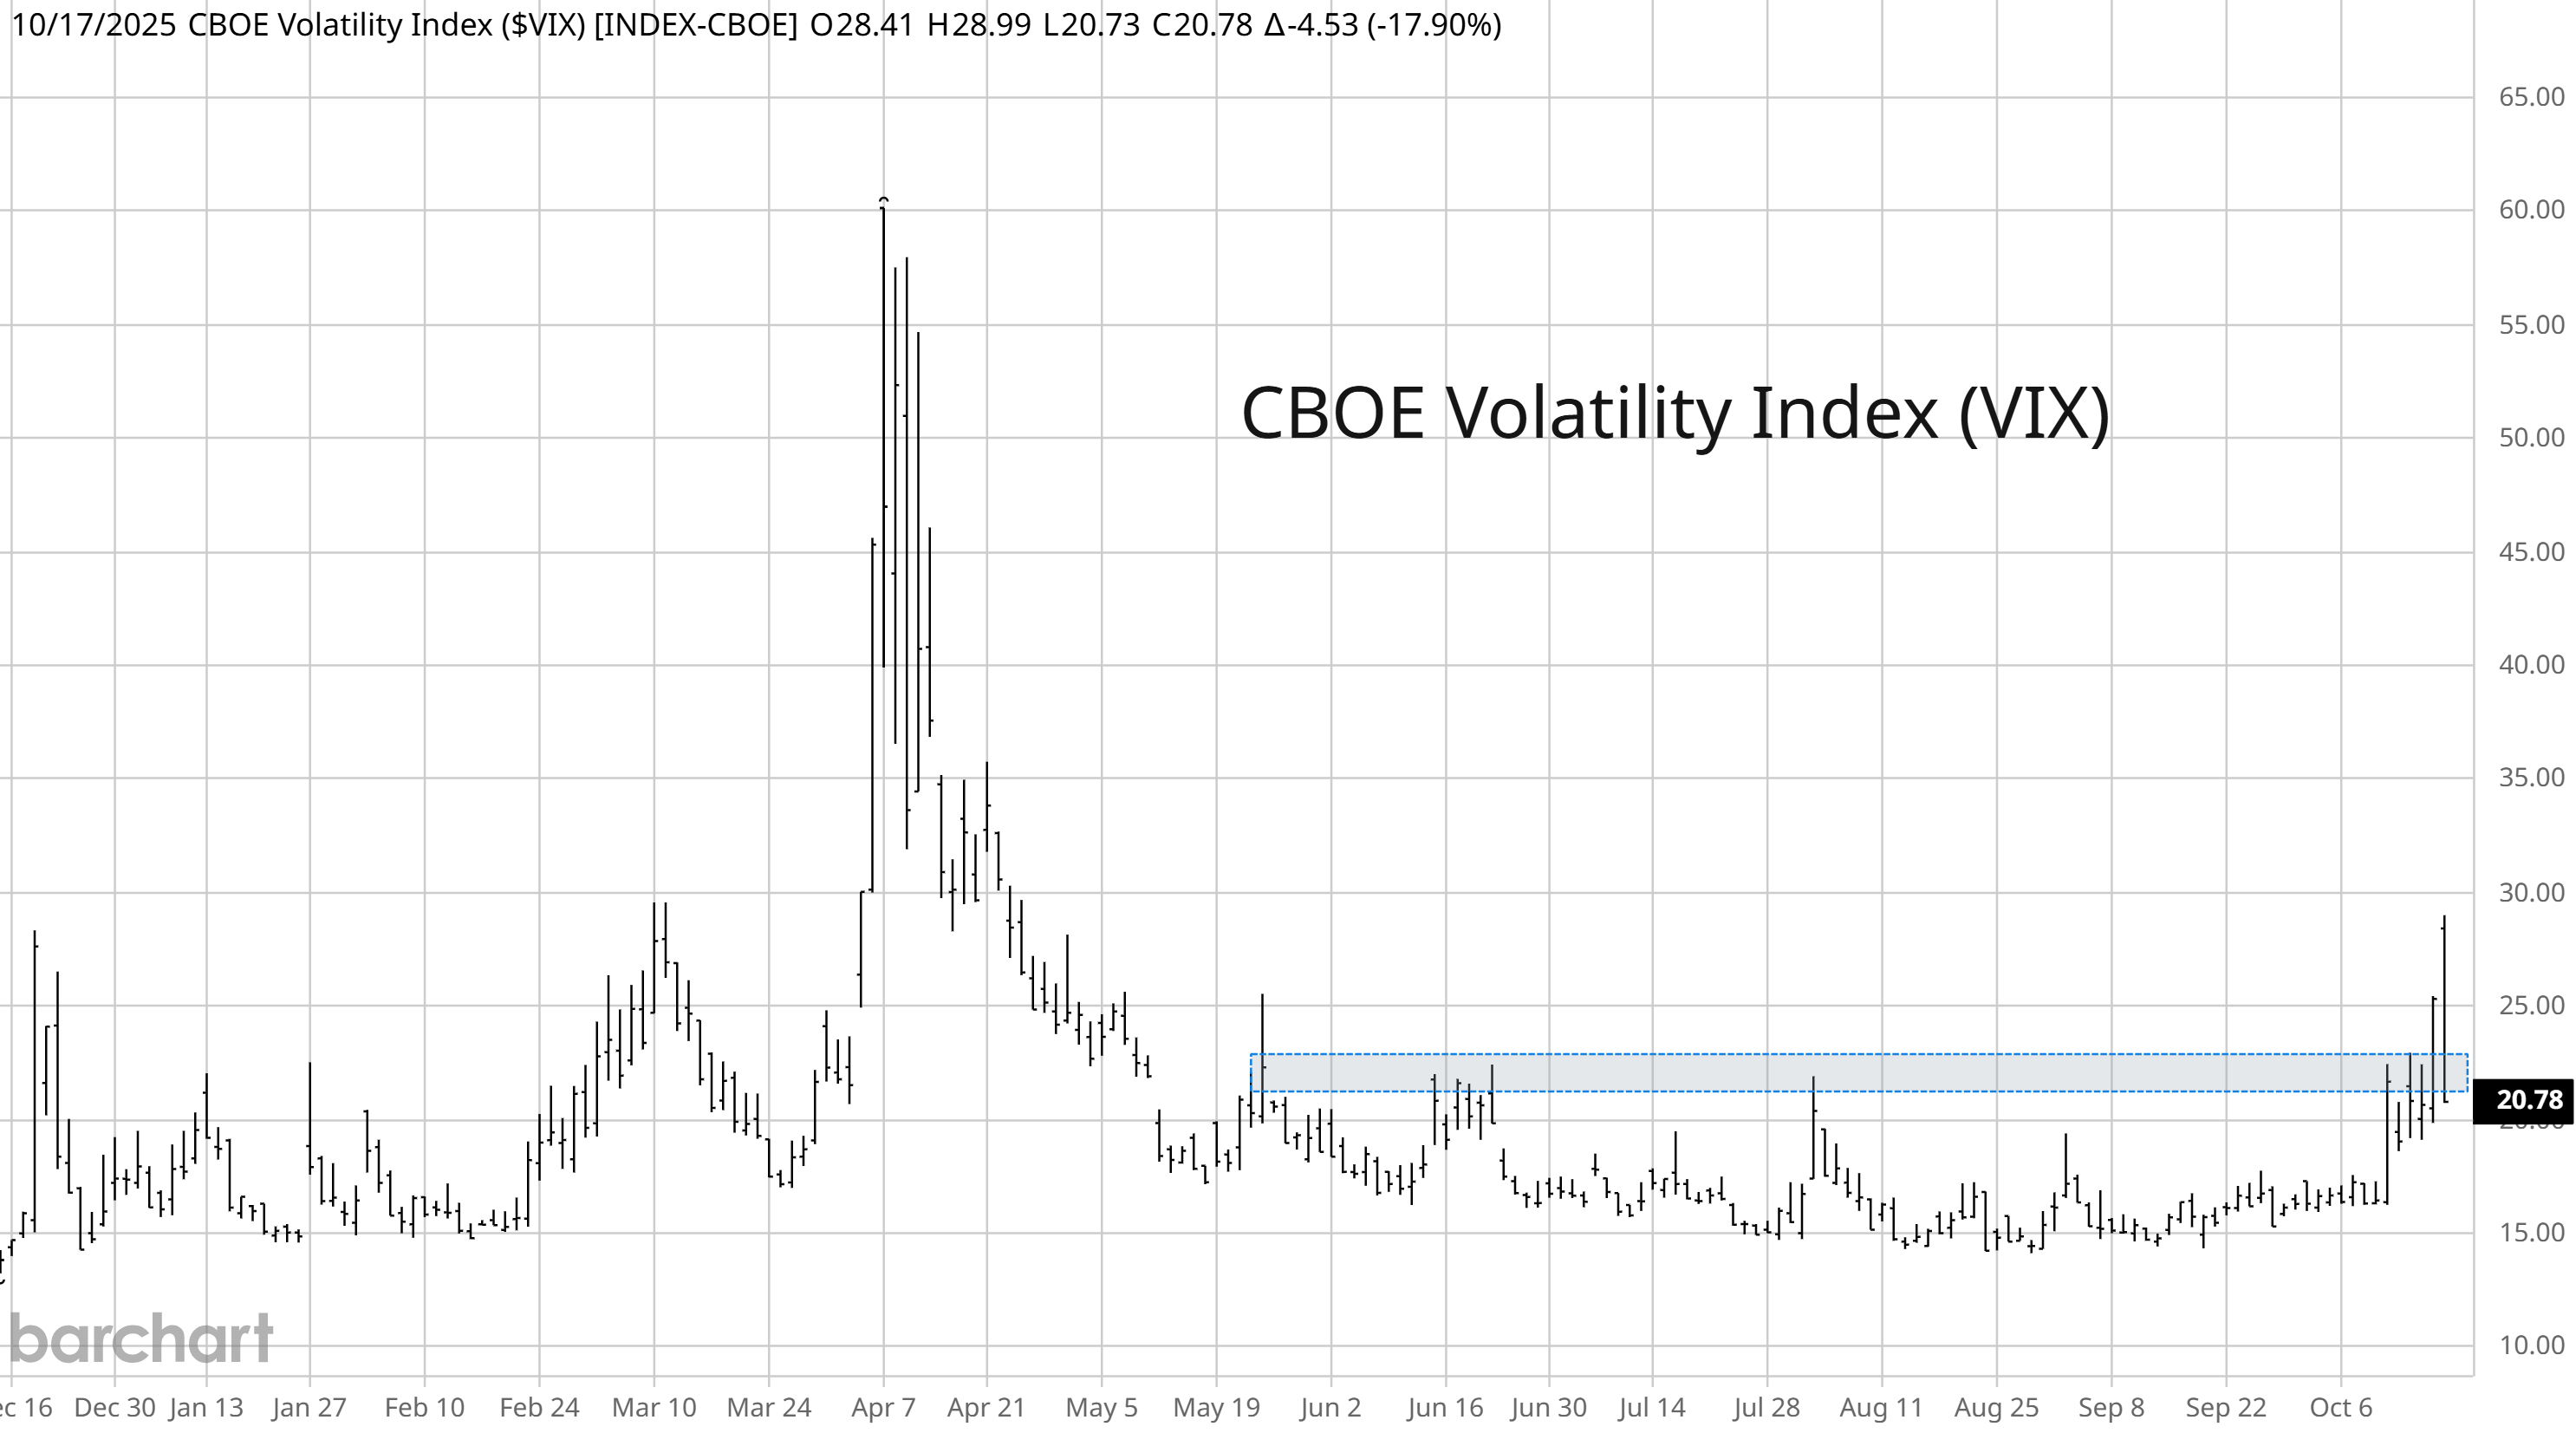
The events helped the CBOE Volatility Index (VIX) jump above a key level for the first time since May. The 22 level on VIX had held on any pullback since May (chart below), which shows that bears are having a difficult time sustaining any downside momentum.
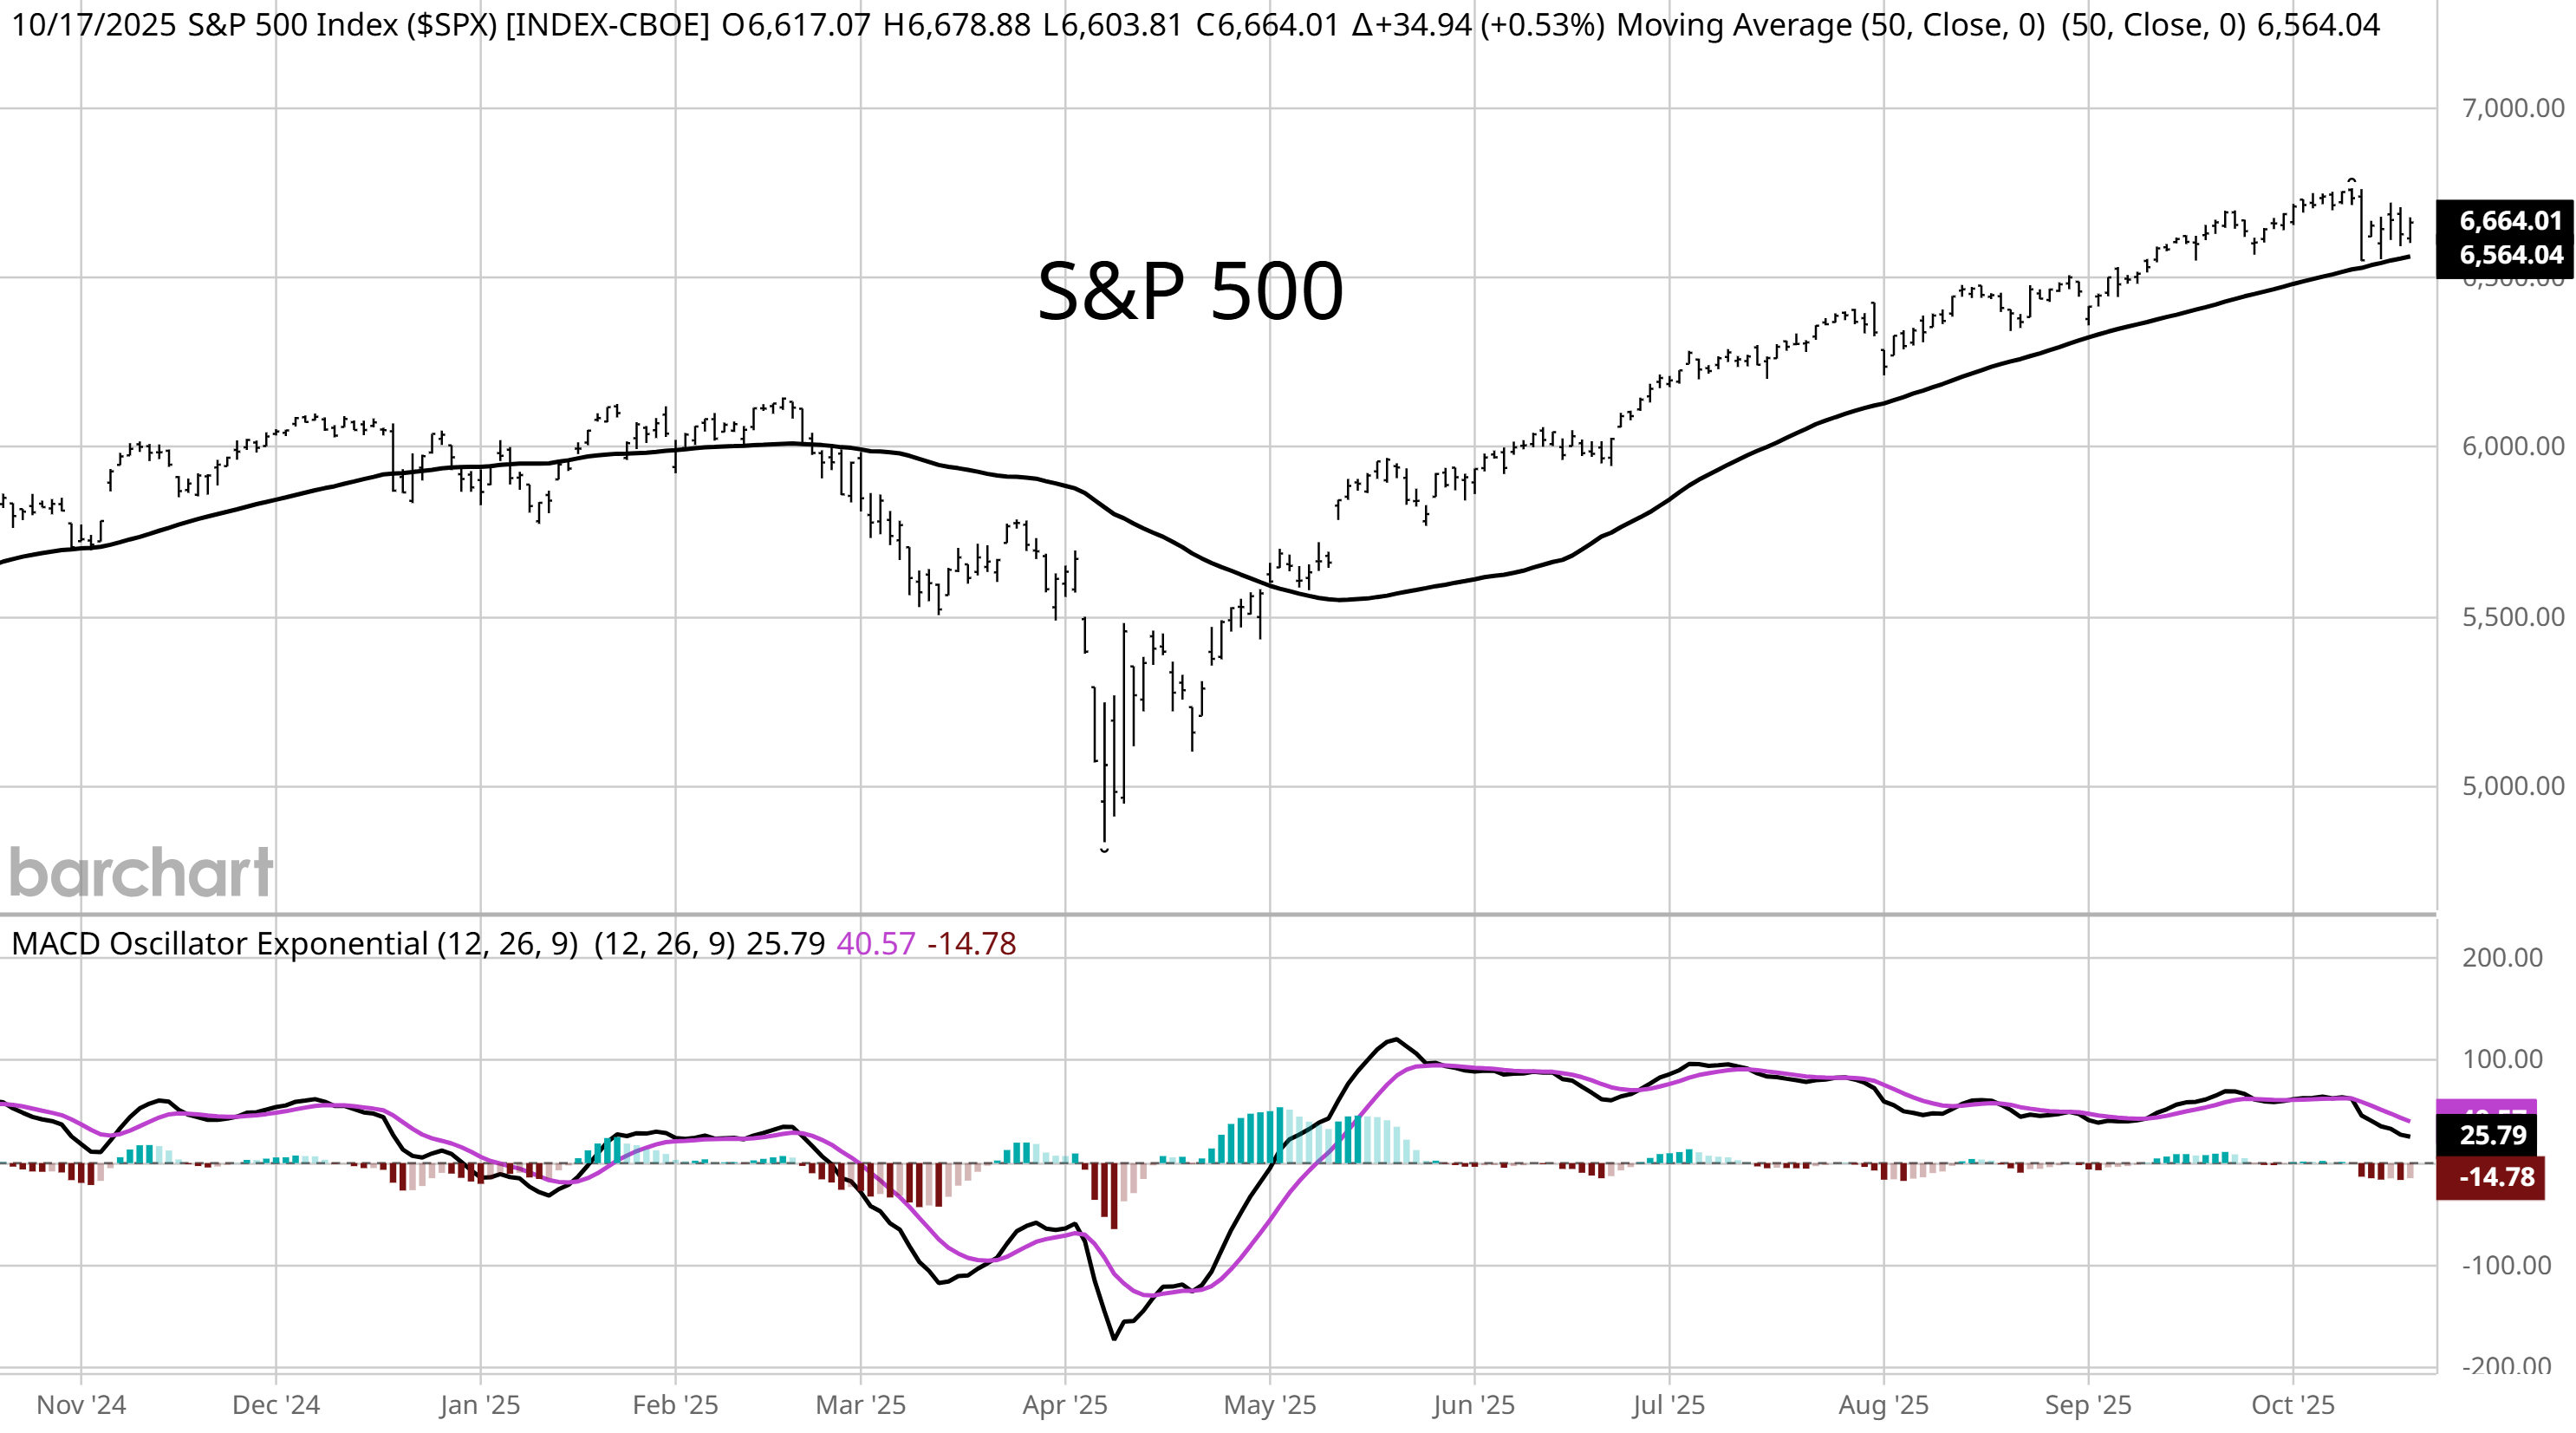
The low volatility environment over the last few months has coincided with a 117 day stretch in which the S&P 500 hasn’t moved below the 50-day moving average (MA).
But the S&P is testing that key level on several occasions over the past week while volatility metrics are holding above levels that could draw more selling pressure in the near-term.
This week, lets unpack the potential for the S&P 500’s pullback off record highs to become something more serious and where selling pressure could originate. We’ll also look at signs of stress in credit markets and how the economy is holding up as the U.S. federal government remains in a partial shutdown.
The Chart Report
Ever since crossing back above the 50-day MA at the start of May as trade tensions eased following the selloff into April, the S&P 500 has seen a steady grind higher with any pullbacks being modest. Until last week, the S&P hadn’t even tested the 50-day MA but now key levels are emerging on this pullback. You can see in the chart below that the S&P has tested price near the 50-day on four occasions recently. That’s also carving out a key price zone to watch in the 6550 to 6600 area. With the S&P only 1.3% off the prior record high, the price area around the 50-day MA will be key for more near-term price weakness to emerge.
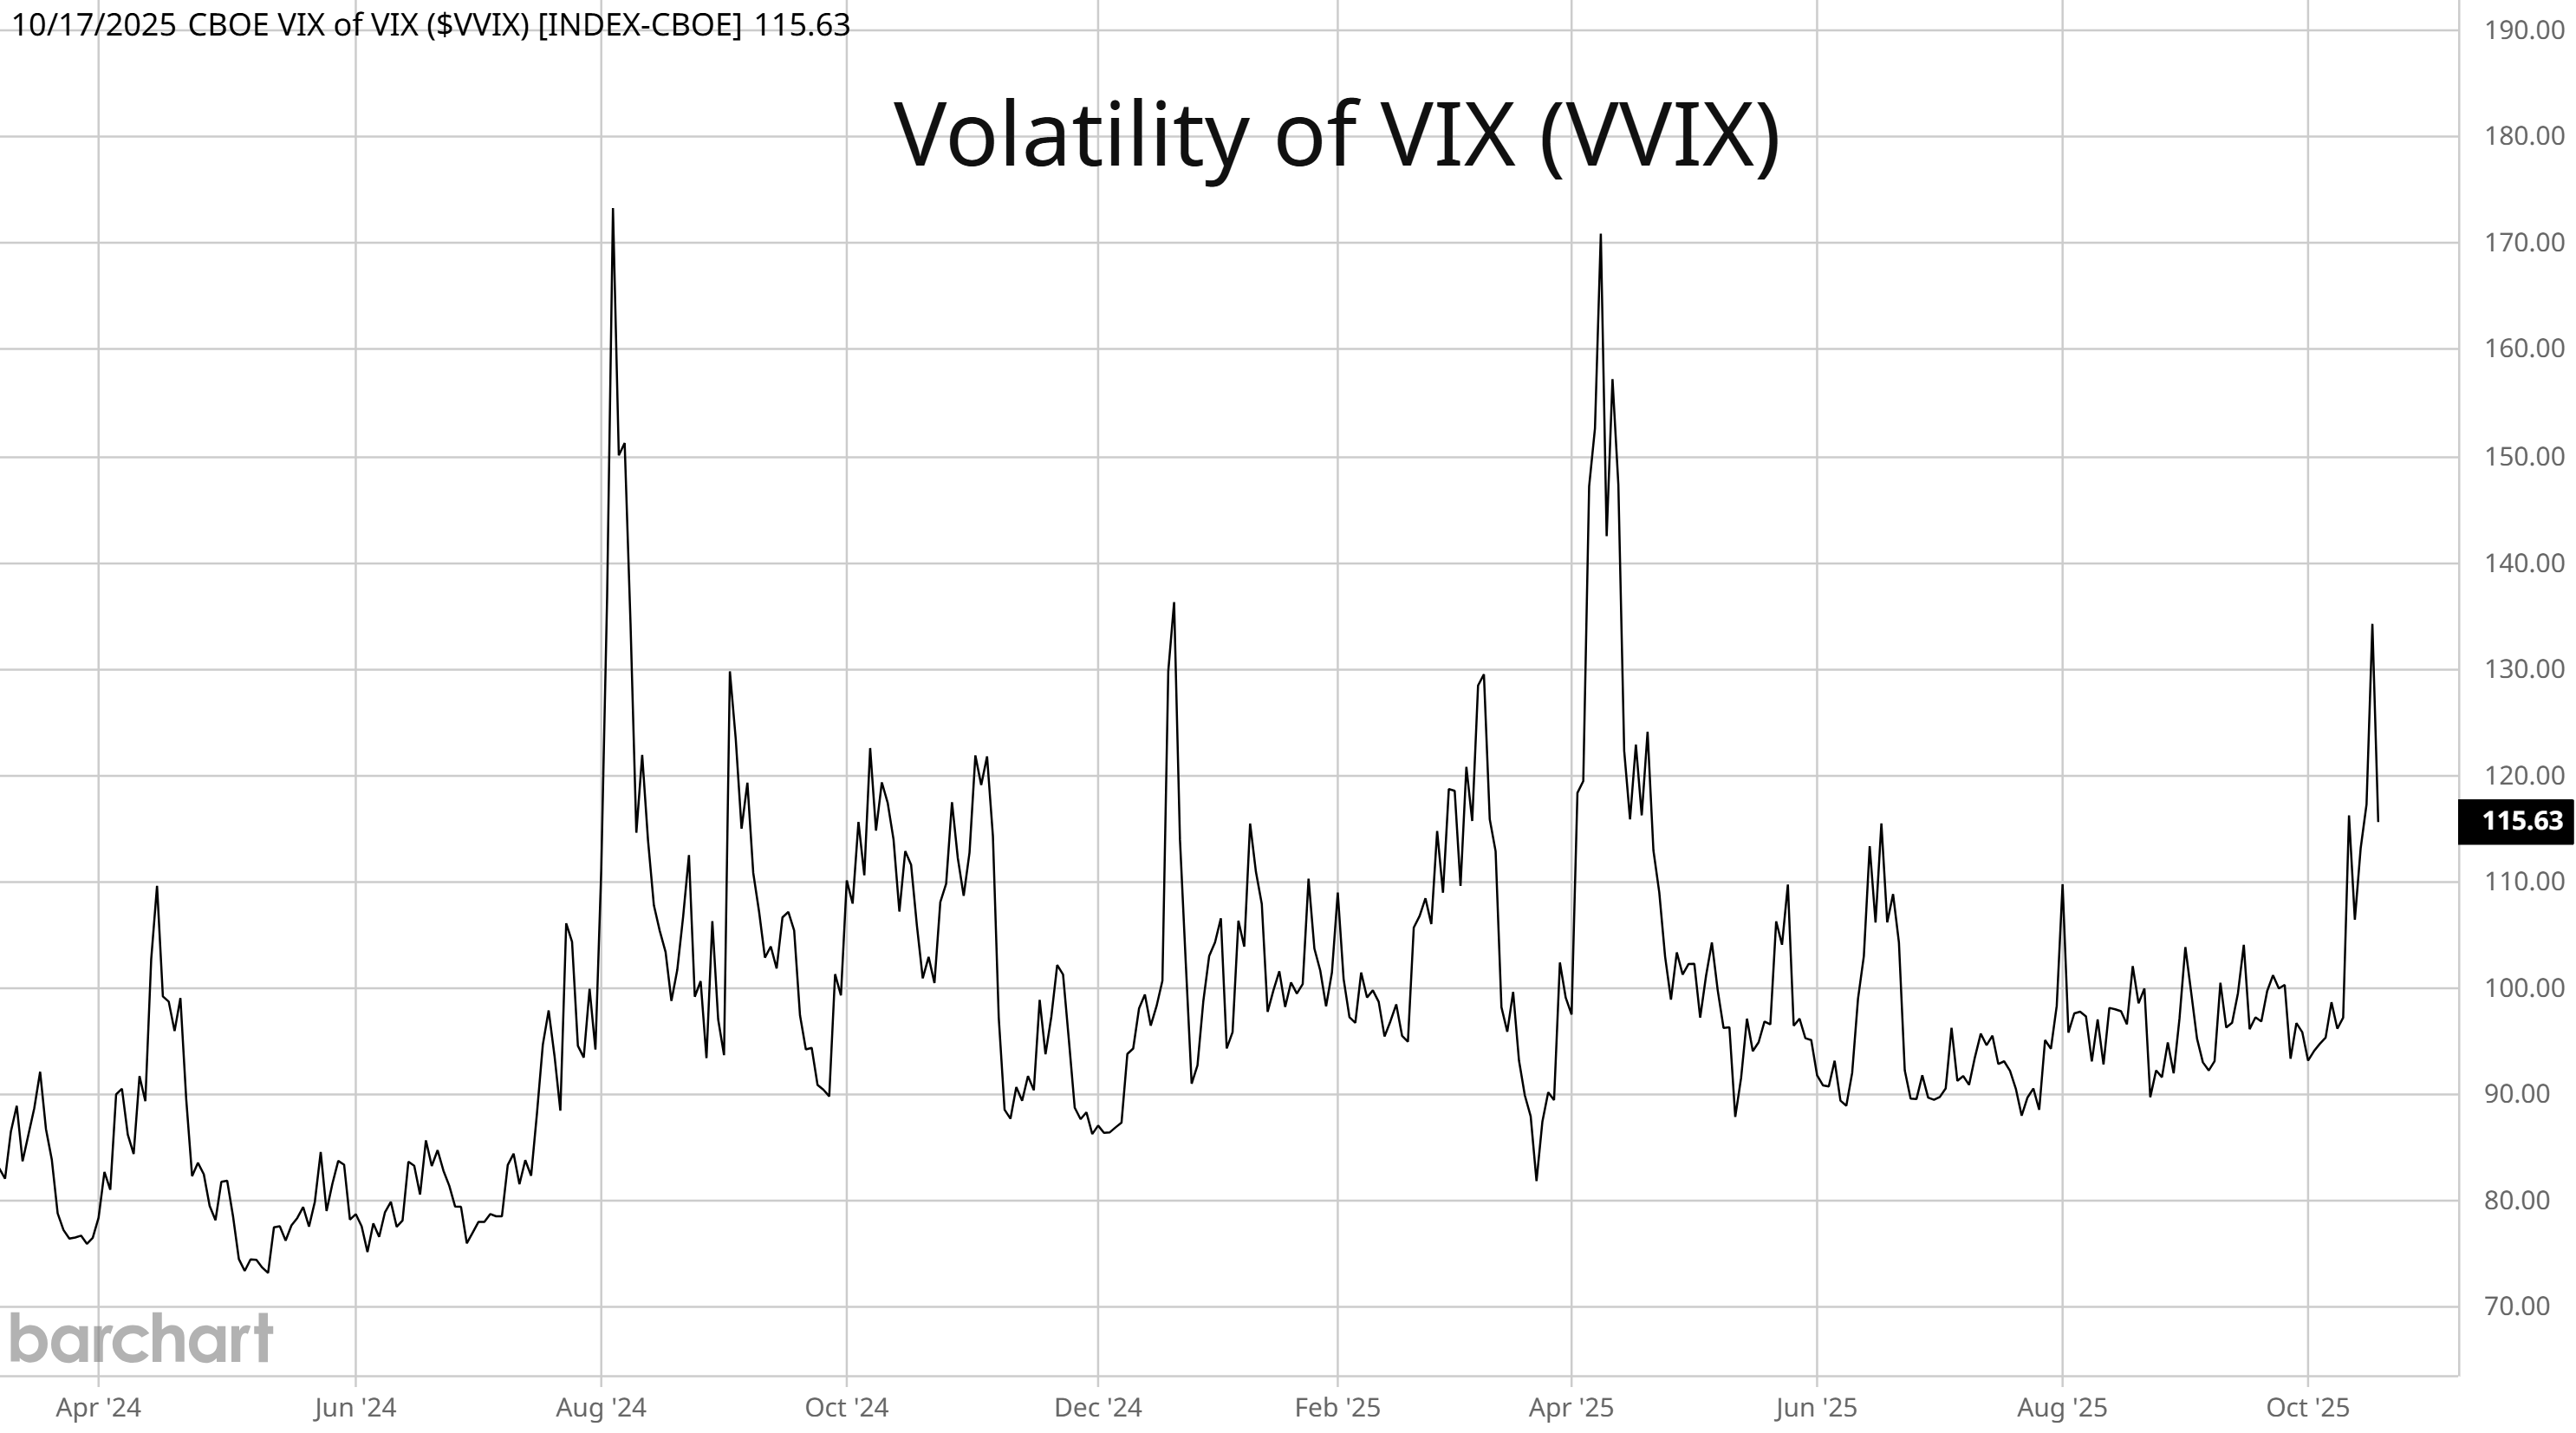
Volatility levels jumped last week to their highest level since April as the VIX increased to 29 intraday before reversing lower. VVIX tracks the volatility of VIX itself, and will often lead spikes in the VIX. The chart below shows VVIX, which last week saw a close at the highest level since April 11. We’re tracking key levels on the S&P 500 for signs that more volatility could be ahead. On the flipside, there are important levels to watch with VIX and VVIX to signal that calm is returning to the market. Keep a close eye on the 20 level with VIX and the 110 area on VVIX. A move below those levels could keep volatility targeting funds at bay and limit selling pressure from systematic strategies.
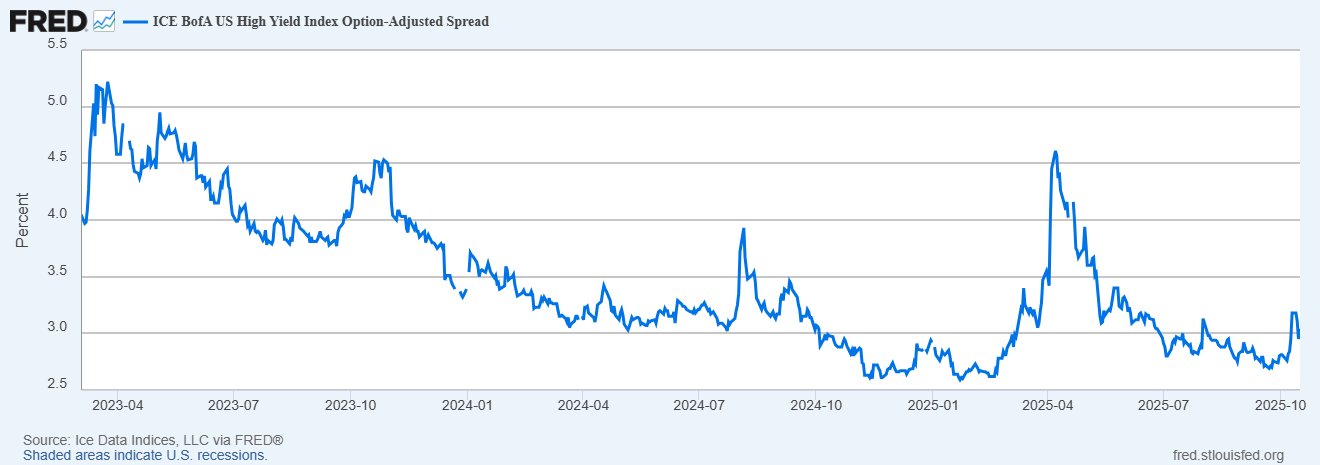
We can also track high yield credit spreads for signs of stress across the capital markets. Spreads measure the cost for high yield issuers to borrow debt above and beyond the cost of debt for a risk-free security like U.S. Treasury securities. You can see in the chart below that spreads are rising from a historically low level during the start of October. Overall, spreads remain contained relative to recent selloff events impacting the stock market like the trade war and volatility around the Japanese yen carry trade unwind during the summer of 2024. A move in spreads above 3.5% would signal growing concern among high yield investors, which would likely happen alongside a steeper selloff in equities.
Regional banks are back in the headlines as a new wave of concerns hits the sector. Fears over loan losses sparked a sharp selloff across banks following loan loss disclosures by Zion Bancorp and Western Alliance Bancorp. The SPDR S&P Regional Banking ETF (KRE) lost over 6% in a single trading session last week. JPMorgan CEO Jamie Dimon commented that “when you see one cockroach, there are probably more.” At the same time, unrealized losses of $395 billion are still sitting on bank balance sheets (chart below). The losses stem from the impact of rising interest rates on Treasury securities held as reserves, and played a key role in the bank crisis that emerged in early 2023. While developments around the trade war and government shutdown dominate the headlines, the combination of credit and liquidity concerns facing banks could emerge as a key driver of volatility.

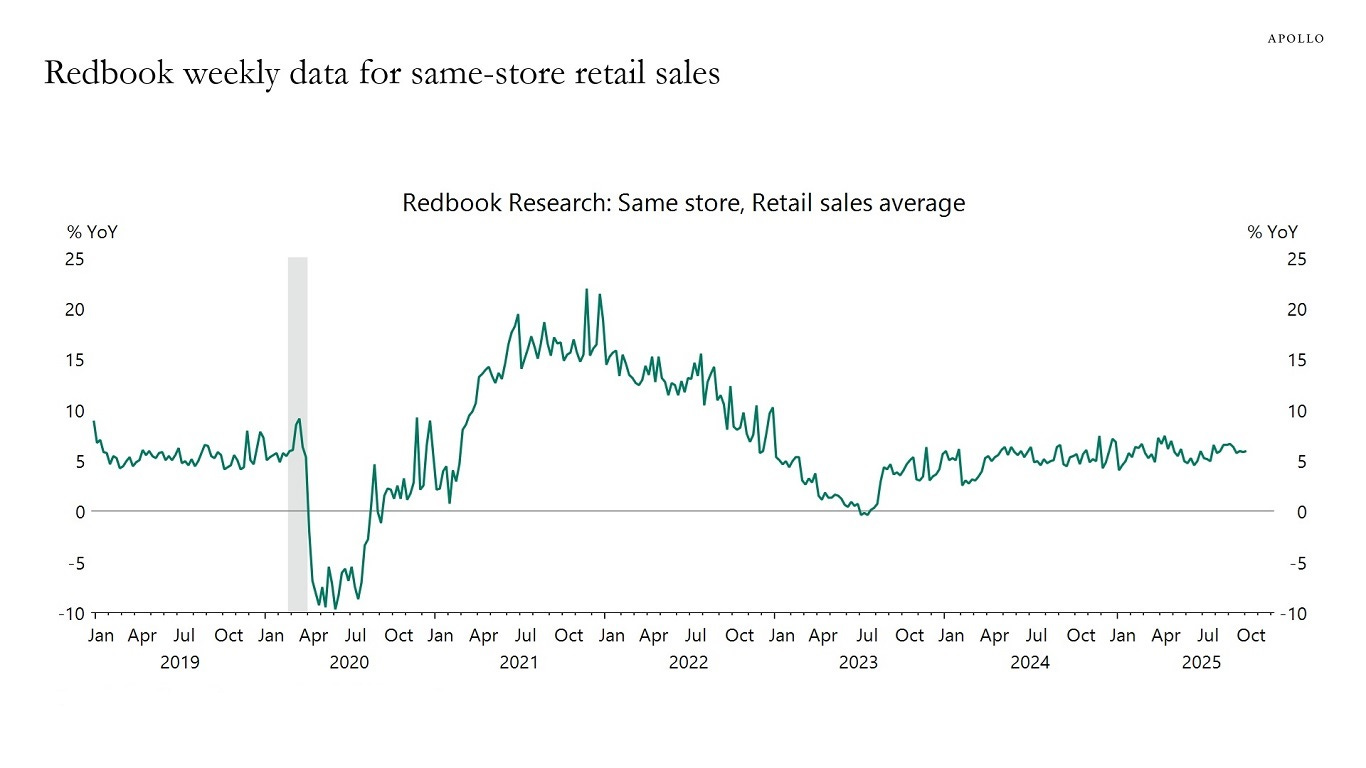
The government shutdown is entering its 19th day, becoming the third-longest shutdown in history. For investors, the shutdown can impact the stock market through two primary avenues. First, the shutdown is estimated to cost the U.S. economy $15 billion for every week the shutdown persists. That amounts to a hit of about 0.2% to GDP each week. At the same time, key government reports covering various economic data are not being released and impacts everything from inflation to jobs and retail sales. Alternative sources of data on the health of the economy are available, and points to the economy holding up. That includes the Johnson Redbook Index, which is a weekly indicator of U.S. retail sales growth (chart below). It tracks same-store sales for a sample of large general merchandise retailers, representing over 80% of the Commerce Department’s equivalent official retail sales data. Retail sales growth continues running near the same range since 2024 around 5%.
Heard in the Hub
The Traders Hub features live trade alerts, market update videos, and other educational content for members.
Here’s a quick recap of recent alerts, market updates, and educational posts:
The central bank gold buying spree.
The dollar’s decline could just be starting.
Signs that the stock market is already oversold.
The next AI infrastructure stock that could breakout.
How investors are voting with their own money (contrarian signal).
You can follow everything we’re trading and tracking by becoming a member of the Traders Hub.
By becoming a member, you will unlock all market updates and trade alerts reserved exclusively for members.
🚨Hub members recently locked in gains of 244.4% and 165.4%. Check out the special offer below to join the Hub today!
👉You can click here to join now👈
Trade Idea
Tesla (TSLA)
After running to new record highs around the $490 level in December, Tesla shares started a new basing period. The stock is recently making a smaller pullback off after testing an area close to the prior highs, which is leading to a bullish MACD momentum reset. I’m watching for a breakout to new record highs.

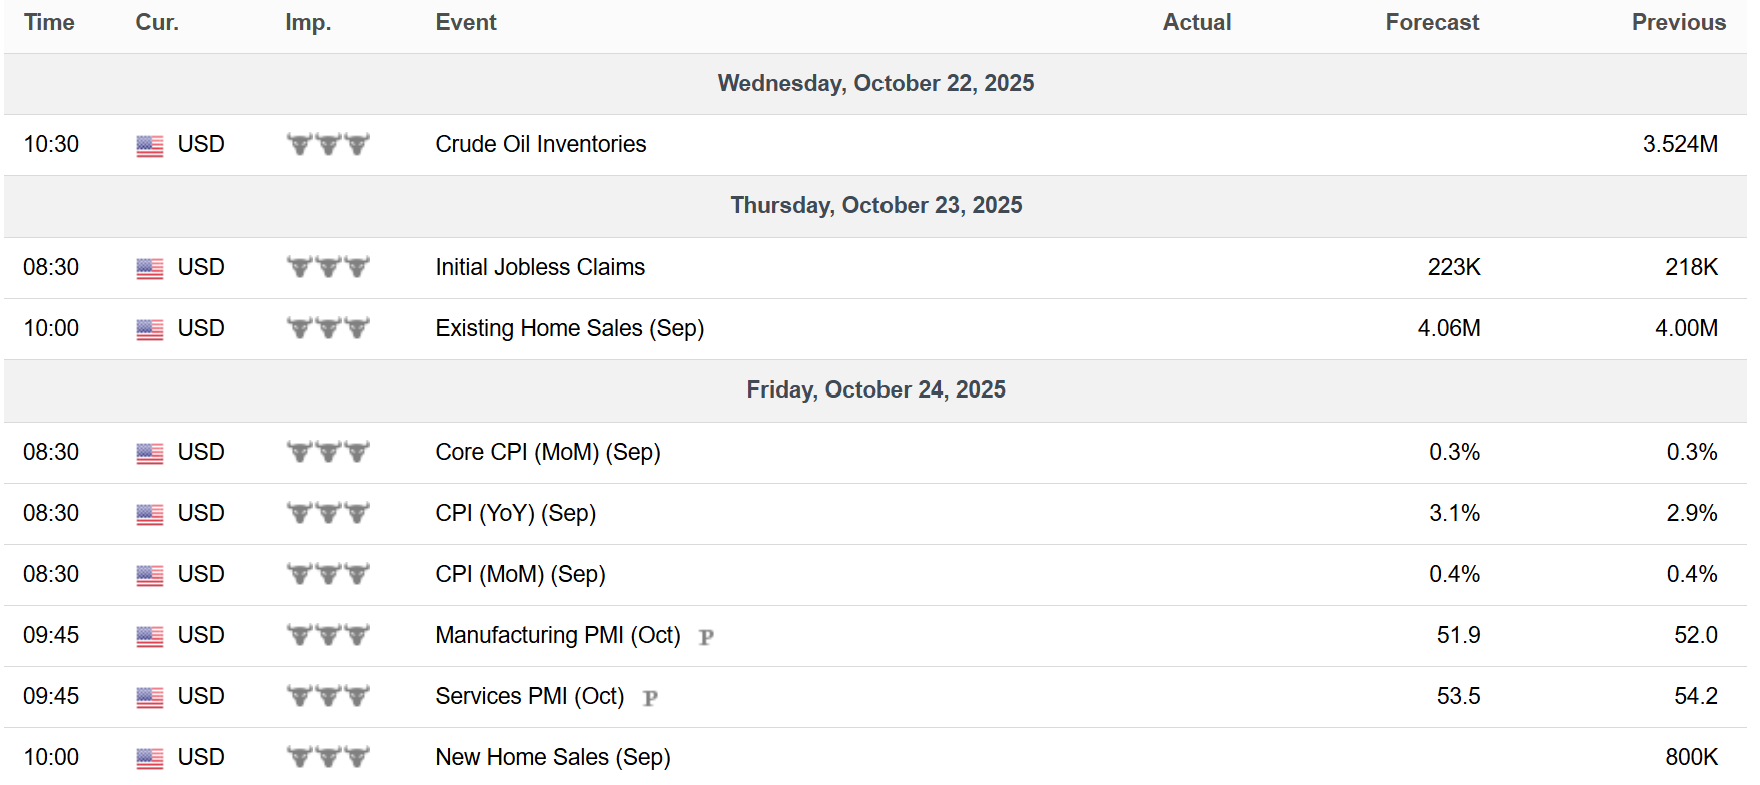
Key Upcoming Data
Economic Reports
Earnings Reports

I hope you’ve enjoyed The Market Mosaic, and please share this report with your family, friends, coworkers…or anyone that would benefit from an objective look at the stock market.
Become a member of the Traders Hub to unlock access to:
✅Model Portfolio
✅Members Only Chat
✅Trade Ideas & Live Alerts
✅Mosaic Vision Market Updates + More
Our model portfolio is built using a “core and explore” approach, including a Stock Trading Portfolio and ETF Investment Portfolio.
Come join us over at the Hub as we seek to capitalize on stocks and ETFs that are breaking out!
And if you have any questions or feedback, feel free to shoot me an email at mosaicassetco@gmail.com
Disclaimer: these are not recommendations and just my thoughts and opinions…do your own due diligence! I may hold a position in the securities mentioned in this report.