
The Market Mosaic 10.12.25
Is the Currency Debasement Trade Just Getting Started?

👋Welcome back to The Market Mosaic, where I gauge the stock market’s next move by looking at macro, technicals, and market internals. I’ll also highlight trade ideas using this analysis.
If you find this report helpful please hit that “like” button, share this post, and become a subscriber if you haven’t already done so!
🚨And be sure to check out Mosaic Traders Hub. It’s a members-only platform to alert trade ideas, track a model portfolio of open positions, and further analyze the message coming from the capital markets (👇be sure to check out our special offer below).
Now for this week’s issue…
While the “currency debasement” trade took a breather late last week, the catalysts behind the theme aren’t going away any time soon.
Gold hit the $4,000 per ounce level for the first time ever, while silver is testing the prior record high around $50 per ounce. While precious metals have pulled back from record levels, gold is still up 54% on the year while silver has rallied 73%.
The tailwinds behind the gains aren’t going away anytime soon. That includes concerns over the future of fiat money at time when fiscal imbalances keep growing. Worries over debt levels and deficit spending have been around for as long as I can remember, but maybe investors are finally starting to care.
The U.S. debt-to-GDP ratio stands at 119%, which is up from 60% in 2005 (chart below). Even though the federal government remains partially shutdown over funding disagreements, federal deficit spending isn’t going away anytime soon.
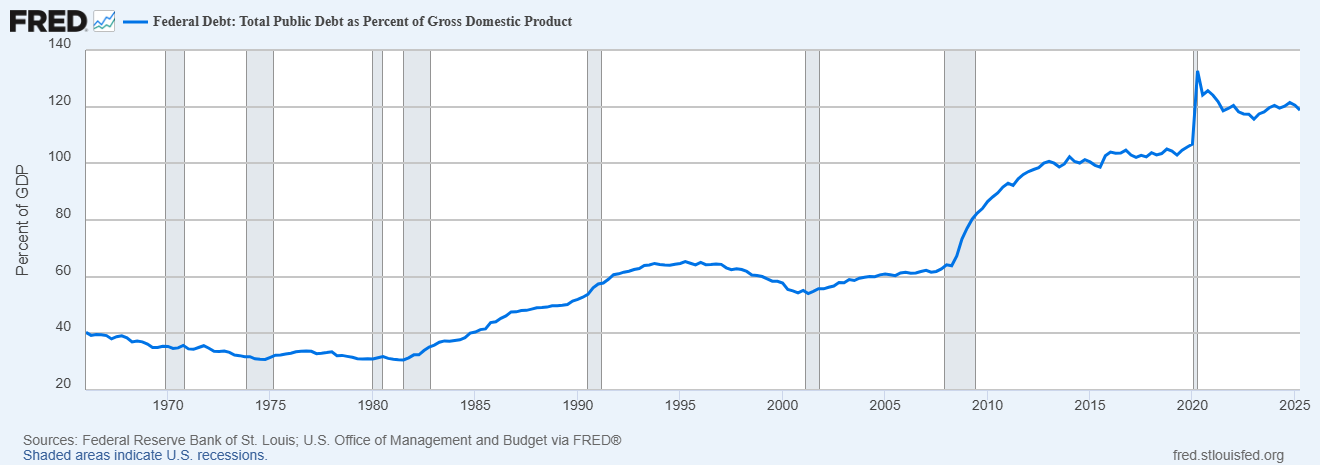
Total deficit spending over the next decade is estimated at $22.7 trillion and average 6.1% of GDP every year in that span. And those estimates assumes the economy continues growing.
Worries over the future path of inflation that could erode purchasing power is also playing a key role in the scarcity trade. The minutes of the most recent rate-setting meeting shows that the Federal Reserve is staying on the easing path for now.
Comments from the Fed shows there’s deep divisions at the central bank, and whether the full employment or price stability mandate carries greater importance. A statement in the minutes even noted that progress on inflation “had stalled, even excluding the effects of this year’s tariff increases.”
But a slight majority favored cutting interest rates by a quarter point during each of the Fed’s last two meetings of the year. While the focus remains on supporting the labor market, lowering rates could also add upward pressure on inflation.
This week, lets unpack the tailwinds behind the scarcity trade, and the next key breakouts in precious metals and cryptocurrencies to watch. We’ll also look at evidence that currency debasement could help stir inflation, and the key levels on consumer inflation that could impact stock market valuations.
The Chart Report
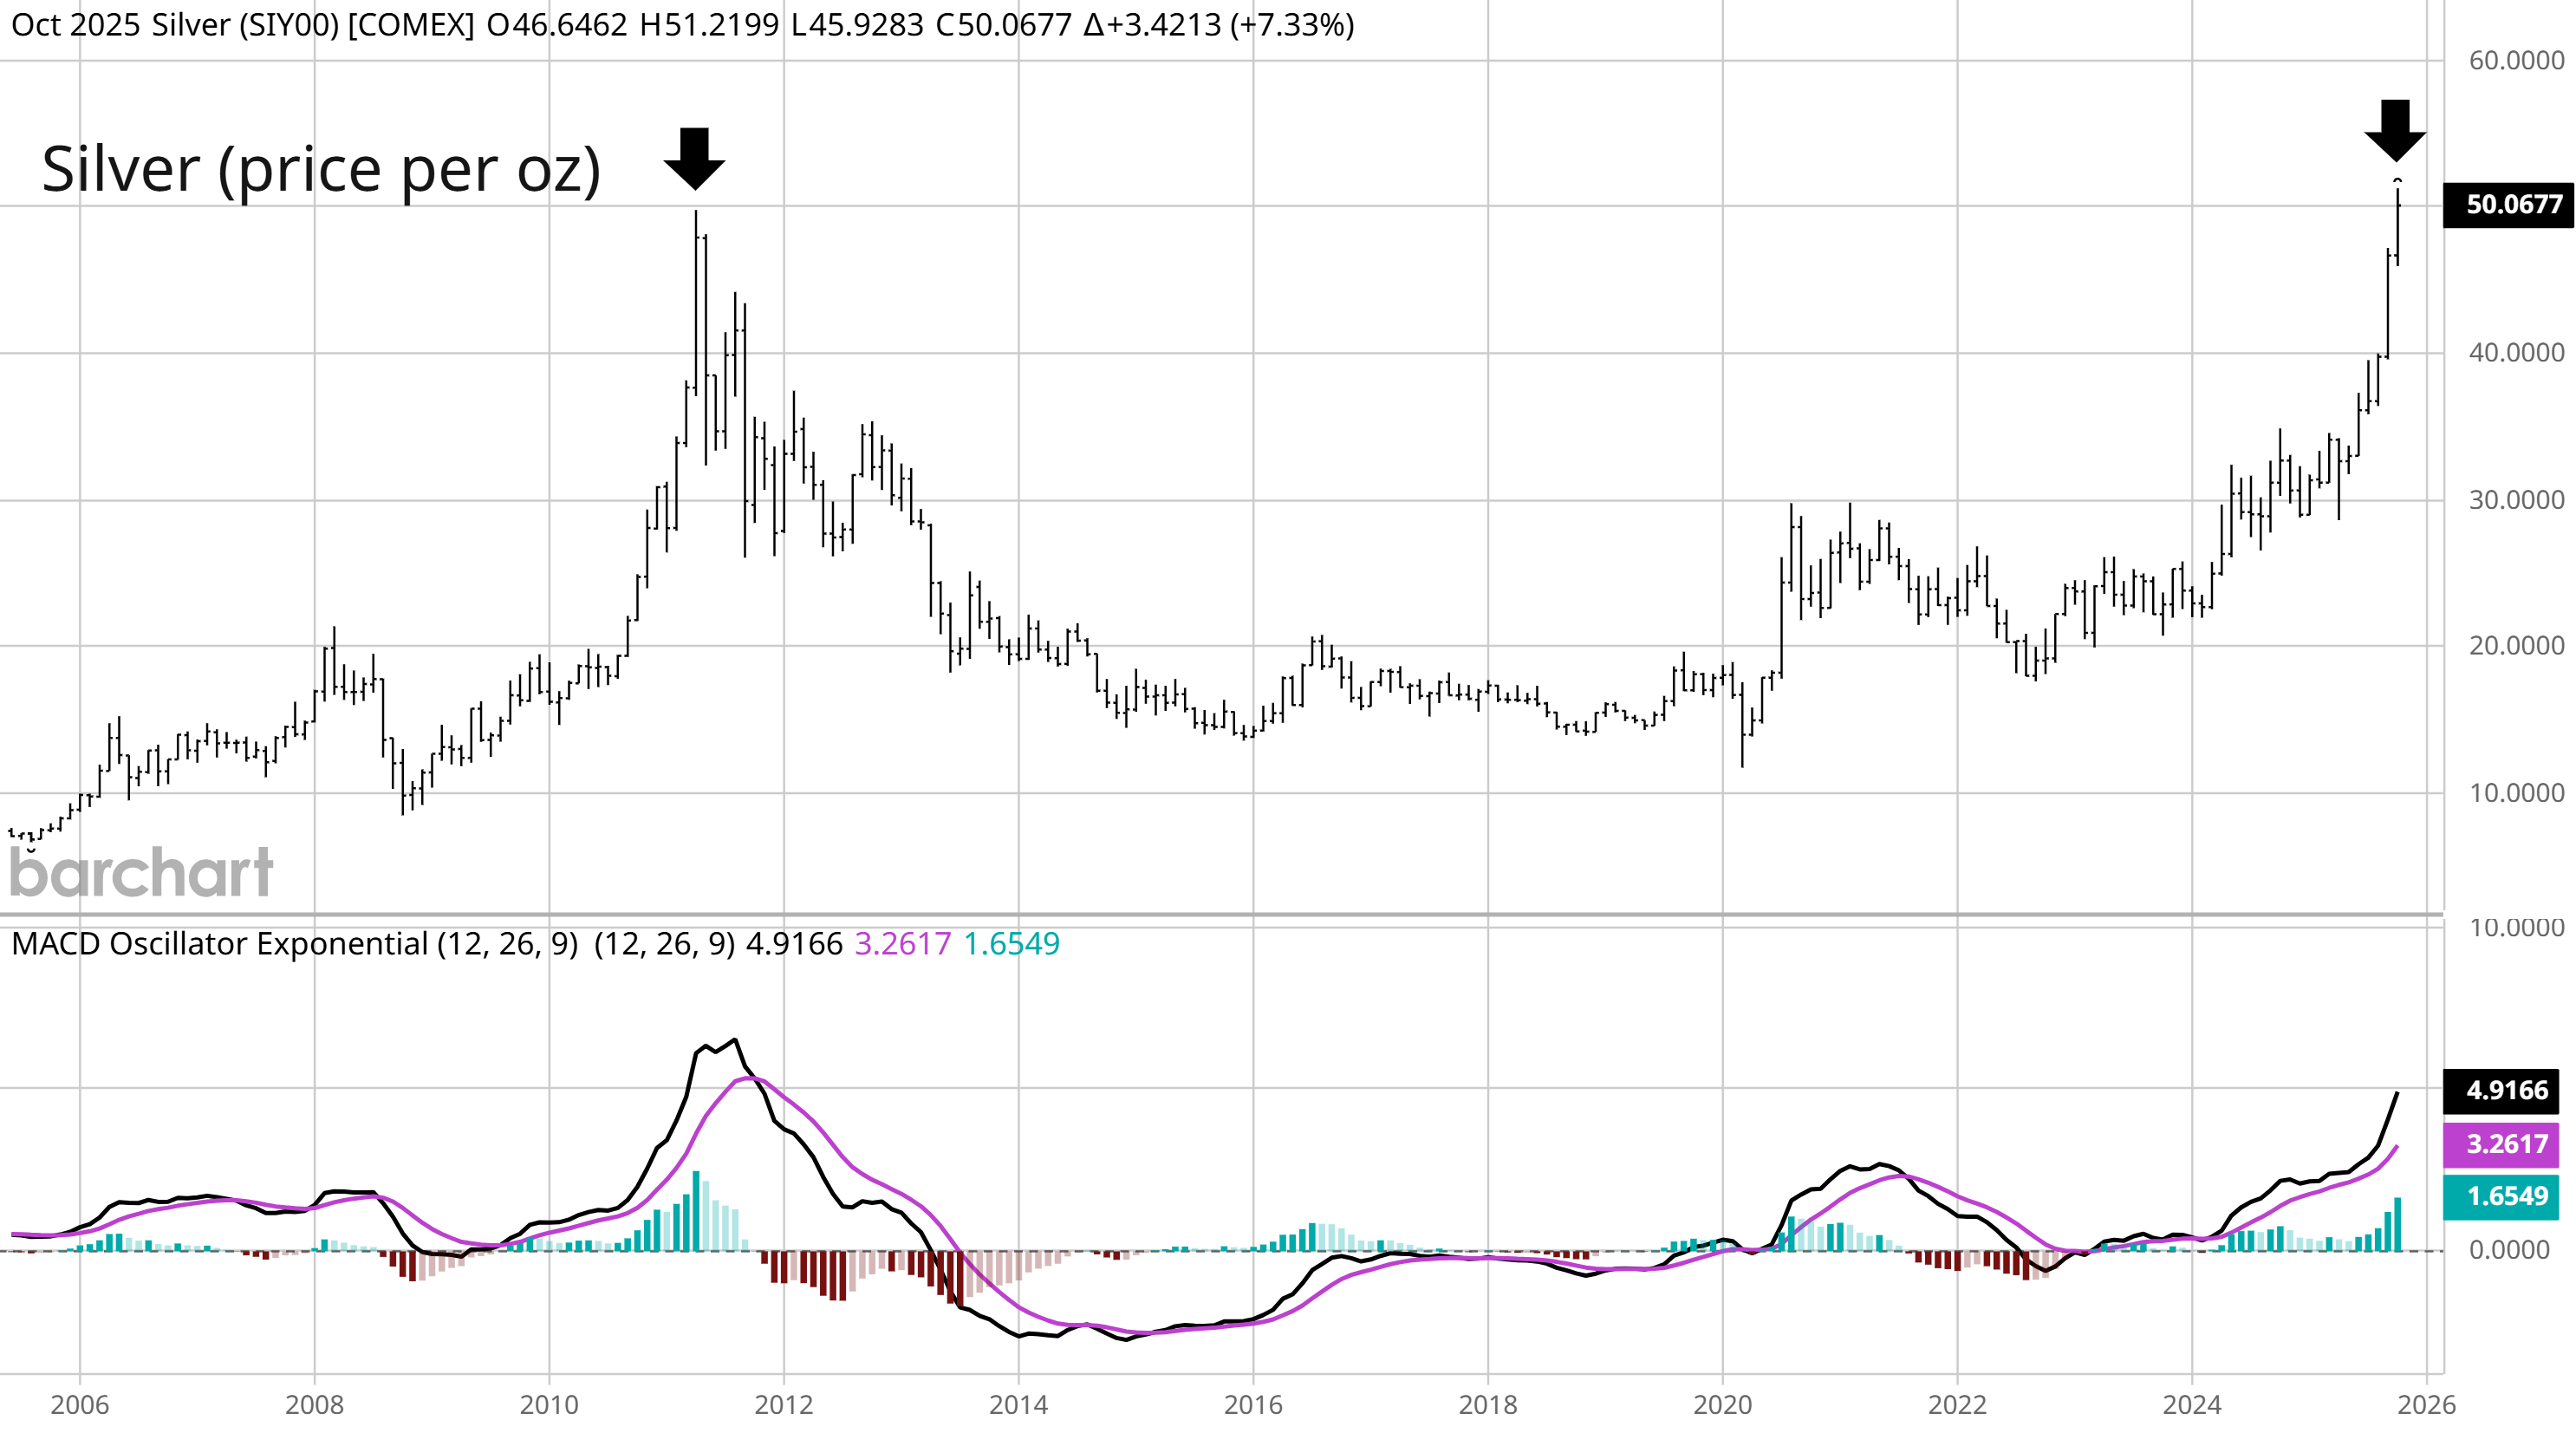
The ongoing rally in gold prices is finally going mainstream. Gold originally started breaking out to new record highs by trading above the $2,000 per ounce level in late 2023. Prices have doubled since then, with gold recently touching the $4,000 per ounce level to much fanfare. While silver’s rally is starting to gain more attention, it remains an underfollowed “scarcity” trade along with industrial end uses in the artificial intelligence infrastructure buildout. Silver prices are now testing the prior record highs around the $50 per ounce level (arrows in the chart below), and could follow gold’s footsteps in moving out to fresh record highs.
Silver’s valuation relative to gold is also supportive of momentum favoring the silver trade. The chart below plots a ratio of gold prices relative to silver prices going back to the early 1900s. A rising ratio signals that gold is outperforming silver, and vice versa when the ratio is falling. You can see that the ratio is recently back near the high end of the historical range following gold’s breakout to new highs and march to the $4,000 per ounce level. The ratio shows that silver is near historically undervalued levels at a time when silver is testing a breakout to record highs.

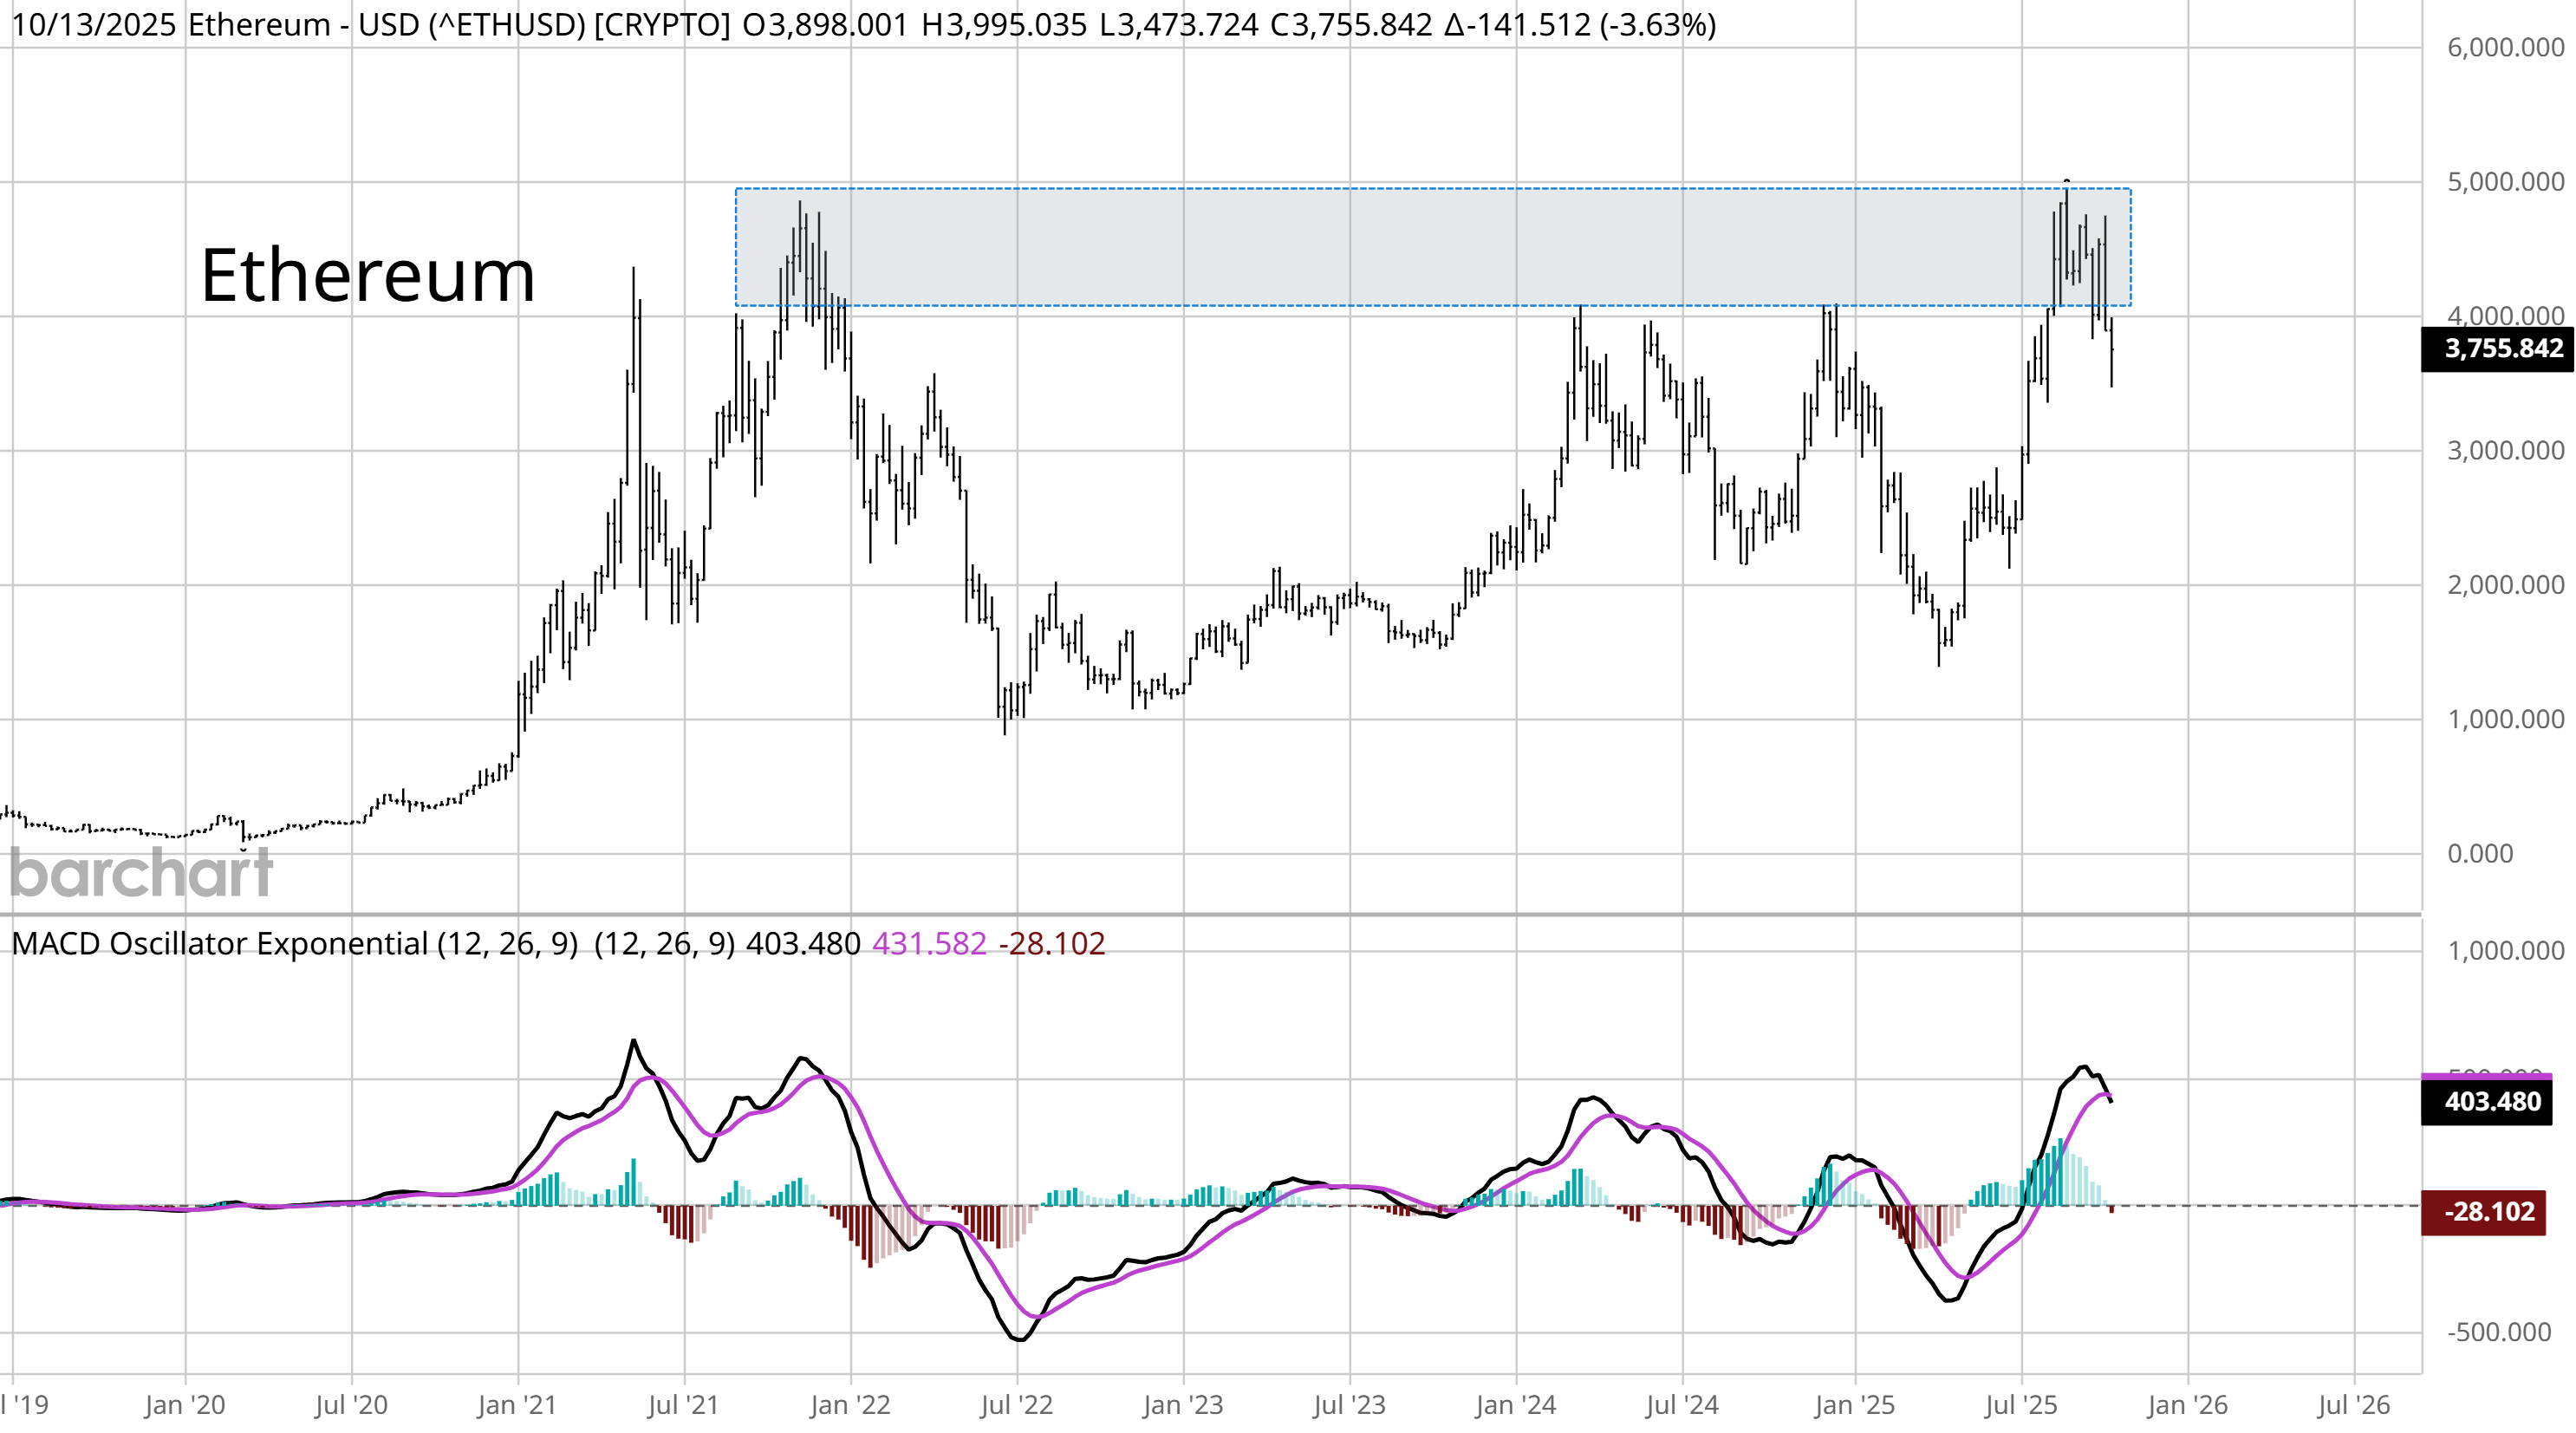
News over the weekend is focusing on the sharp pullback in cryptocurrencies following the broad risk-off move in various markets. But stepping back and looking at the big picture shows that the largest cryptos are simply consolidating recent gains. Bitcoin started moving out to record highs in 2024, which has taken Bitcoin as high as $125,000. Similar to gold leading new highs in precious metals, Bitcoin is leading the way among cryptocurrencies. And just as silver could follow gold to record highs, Ethereum could be setting up a breakout to catch Bitcoin. The weekly chart below shows Ethereum is once again testing the $5,000 level, and remains in an overall uptrend off the April lows despite the recent pullback.
Precious metals and popular cryptocurrencies have seen a boost over currency debasement concerns following an increasing global money supply and surging government debt levels. Another symptom of currency debasement could be an inflationary wave in the months ahead. The chart below plots the prices paid component from various Fed district purchasing manger indexes, which surveys businesses about underlying trends. The prices paid component measures the change in raw materials and other input prices, which tends to be a leading indicator of consumer inflation (green line) as you can see below. While the increase in prices paid indicators aligns with the start of the trade war, currency debasement could be an underlying driver of inflation as well.

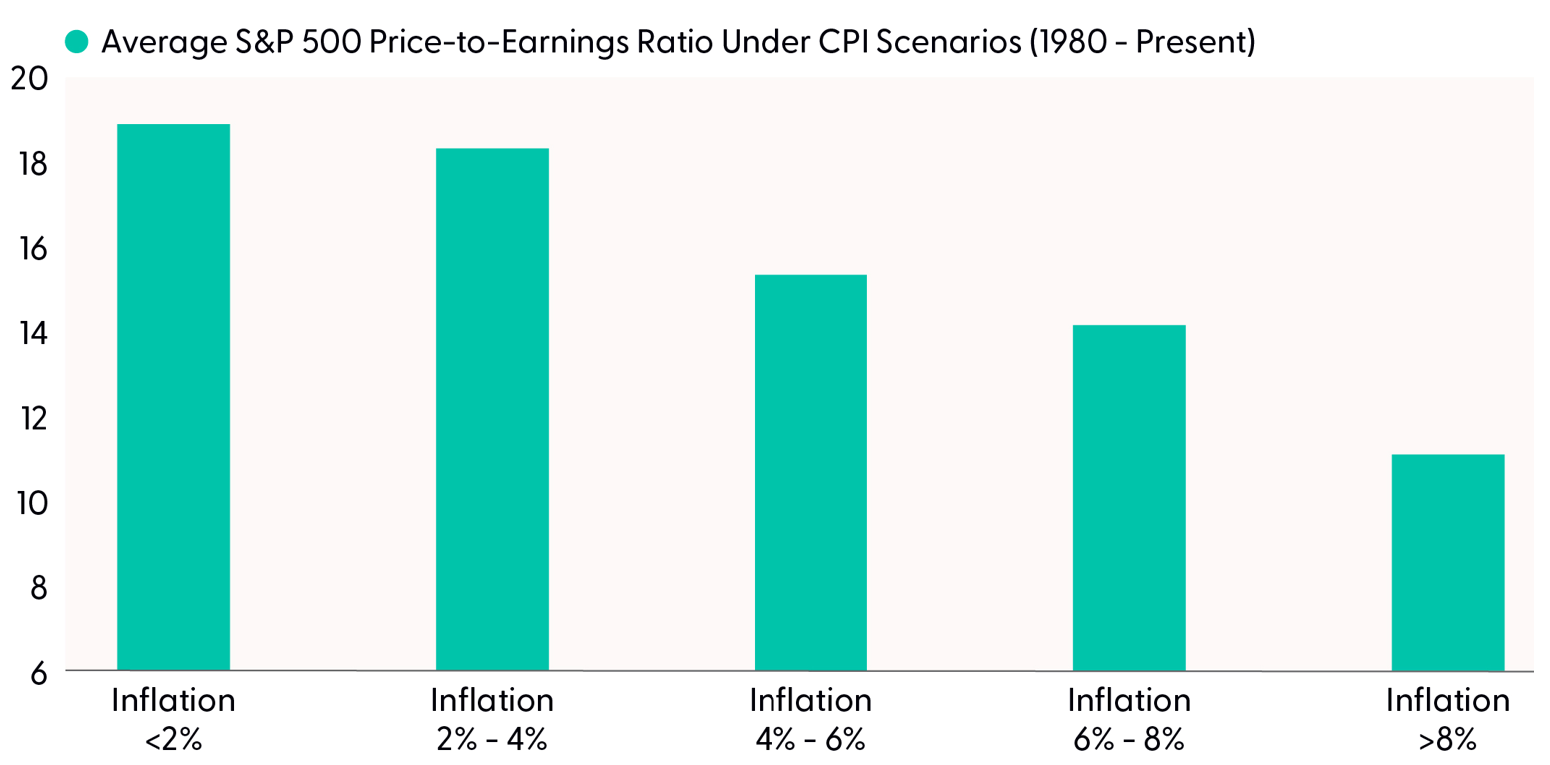
The rally in the S&P 500 has brought the trailing price-to-earnings (P/E) ratio to 29.8 and the forward P/E using earnings estimates for the next 12 months to 22.8. The forward P/E is the highest since the internet bubble in the late 1990s. If inflation does start accelerating further in the months ahead, that could add significant pressure to stock valuations. High inflation tends to lead to high interest rates, which makes the present value of future corporate profits worth less in present value terms. The chart below shows the average S&P 500 P/E ratio under different inflation regimes going back to 1980. You can see that average valuations start taking a big hit as inflation moves above 4%. With core consumer inflation running around 3%, potential acceleration in the months ahead could have a major impact on valuations.
Heard in the Hub
The Traders Hub features live trade alerts, market update videos, and other educational content for members.
Here’s a quick recap of recent alerts, market updates, and educational posts:
Signs that the labor market is improving.
The worrying trend in CPI inflation components.
These Fed surveys point to rising risks on a key mandate.
When inflation will actually start to impact the stock market.
The trading setup in a fintech stock, and the reason it’s on our watchlist.
You can follow everything we’re trading and tracking by becoming a member of the Traders Hub.
By becoming a member, you will unlock all market updates and trade alerts reserved exclusively for members.
🚨Hub members locked in gains of 244.4% and 165.4% last week. Check out the special offer below to join the Hub today!
👉You can click here to join now👈
Trade Idea
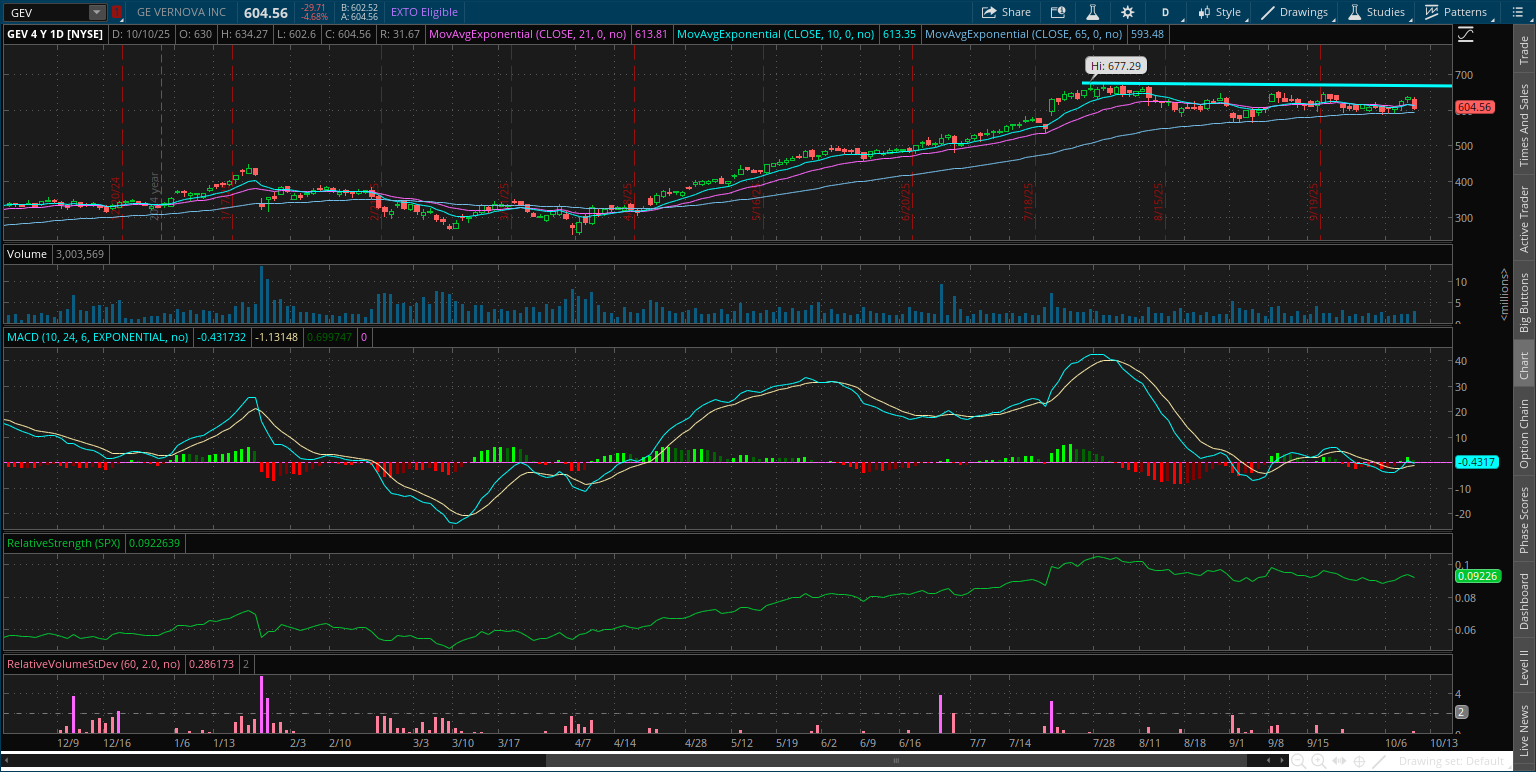
GE Vernova (GEV)
GEV rallied to the $675 level in July and is now forming a new basing pattern. The stock is trading in a relatively tight range with the MACD recently crossing back above zero. I’m watching for a move above $675 with the relative strength line at a new high.
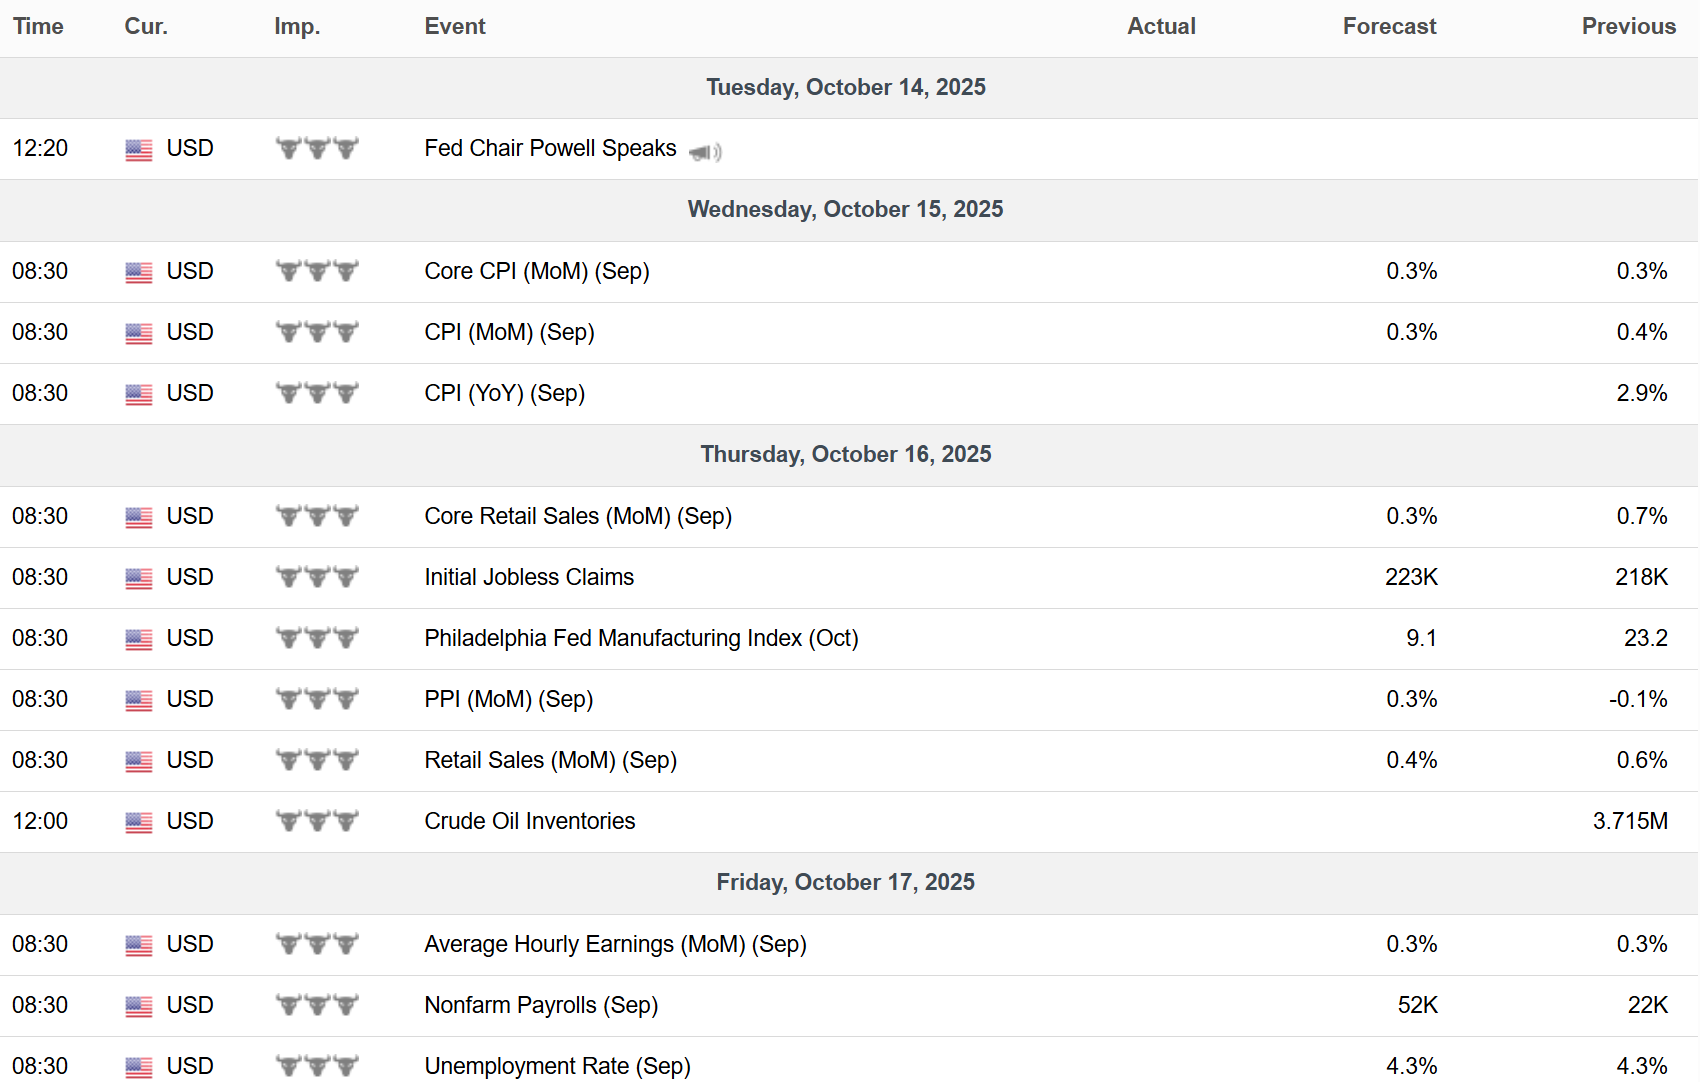
Key Upcoming Data
Economic Reports
Earnings Reports

I hope you’ve enjoyed The Market Mosaic, and please share this report with your family, friends, coworkers…or anyone that would benefit from an objective look at the stock market.
Become a member of the Traders Hub to unlock access to:
✅Model Portfolio
✅Members Only Chat
✅Trade Ideas & Live Alerts
✅Mosaic Vision Market Updates + More
Our model portfolio is built using a “core and explore” approach, including a Stock Trading Portfolio and ETF Investment Portfolio.
Come join us over at the Hub as we seek to capitalize on stocks and ETFs that are breaking out!
And if you have any questions or feedback, feel free to shoot me an email at mosaicassetco@gmail.com
Disclaimer: these are not recommendations and just my thoughts and opinions…do your own due diligence! I may hold a position in the securities mentioned in this report.