Welcome back to Mosaic Chart Alerts!
In this post, I’ll focus on setups that I’m monitoring for both long and short positions. With a chart and short write-up, this is a quick way to scan and plan potential trades.
These ideas are the end result of my process to identify stocks offering the right combination of fundamentals along with a proper chart setup.
Here are my notes from a focus list of setups I’m monitoring.
Before today’s chart updates, I do have a quick note.
I will be celebrating the holidays and spending time with my family this weekend, so there will not be a Sunday edition of The Market Mosaic this week.
I want to wish you much cheer this holiday season!
Stock Market Update
Even with today’s 1.5% pullback in the S&P 500, stock market seasonality is mostly following the historic trend. Over the past 20 years, December typically sees gains (skewed toward the second half of the month) while the period marking the Santa Claus rally is just around the corner. That covers the last five trading days of the year along with the first two days of the new year, and has seen the S&P 500 increase an average of 1.3% since 1950. I also posted a special report yesterday outlining the breakout setups developing among most the “Magnificent Seven” stocks that make up nearly 28% of the S&P.
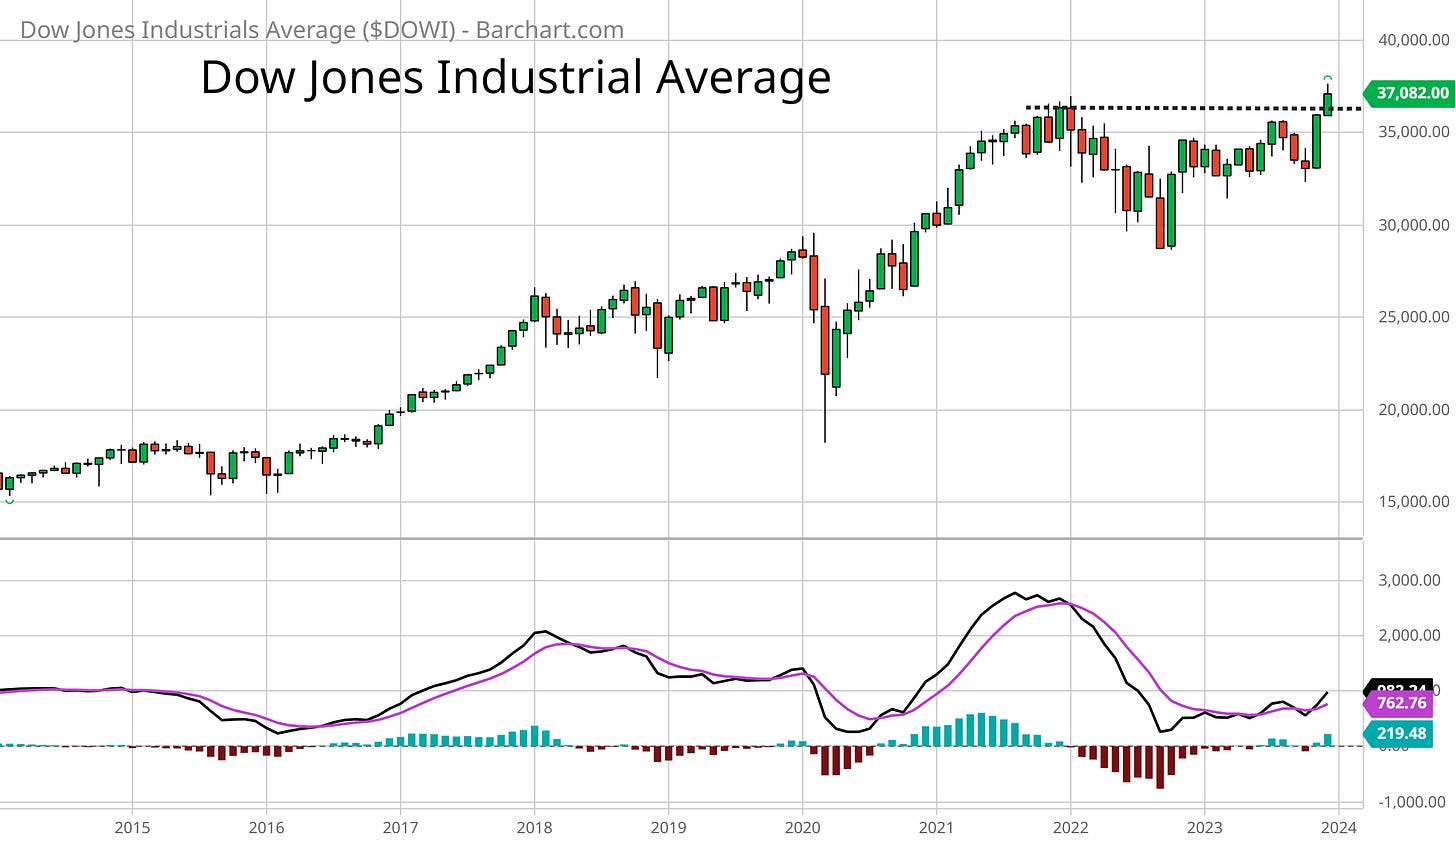
There’s also an important breakout underway with the Dow Jones Industrial Average. The monthly chart below shows the clean break to new all-time highs for the Dow if it holds through month-end, while the MACD is just turning up from the zero line. This is a great example of how I use the MACD to analyze stages of a trend, and the potential for mean-reversion. The Dow’s pullback after peaking in 2021 happened as the MACD became too extended to the upside. But the pullback and consolidation since then has reset the MACD at the zero line. With the indicator just now turning higher as the Dow breaks out, we could still be in the early stages of an overall uptrend that can span a year or longer based on other historical precedents (i.e. look at 2016-2018).
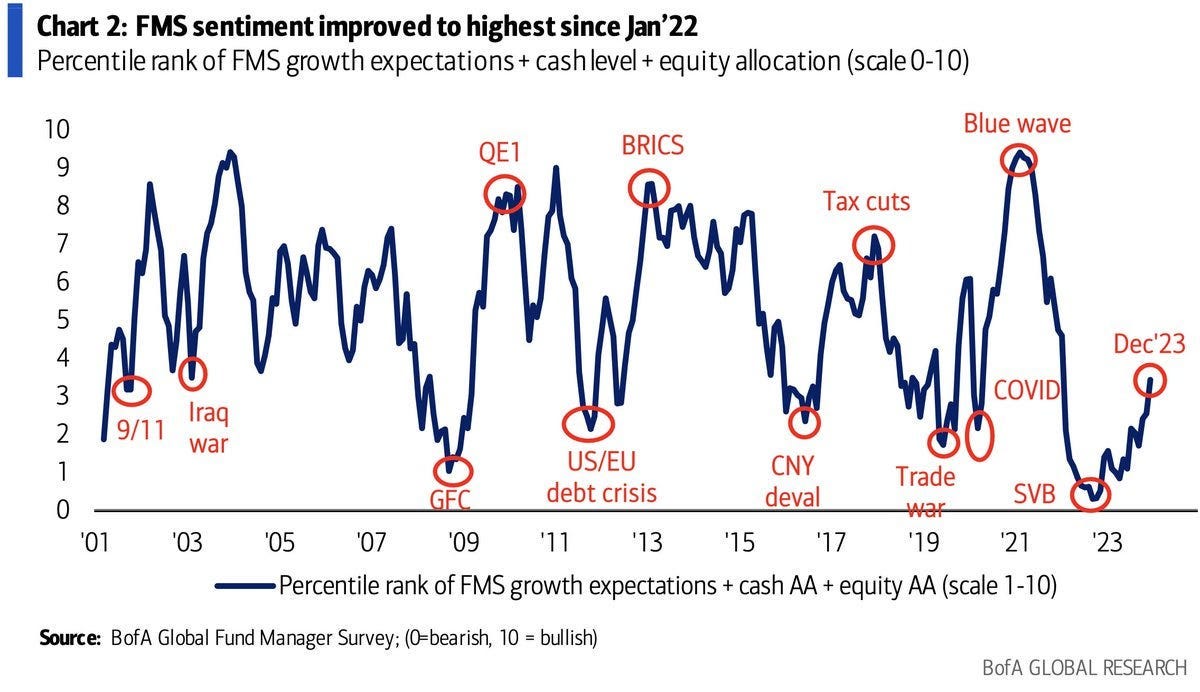
With the stock market rallying since the end of October, several measures of investor sentiment are now hitting bullish extremes like CNN’s Fear & Greed Index. But I also like to take longer-term sentiment gauges into account, like with BofA’s Fund Manager Survey (FMS). That’s a monthly survey of institutional investors, and the chart below (h/t Daily Chartbook) shows a sentiment composite based on things like growth outlooks and cash levels. You can see the indicator bottomed around the start of the year, but is still well below the peak in fund manager sentiment seen in the past. With the indicator still rising from a bearish level, I believe this can help support a longer-term breakout in the Dow discussed above.
I also recently wrote that extremes in sentiment (bullish or bearish) work best as a signal when you have breadth divergences at the same time. And right now, breadth remains strong as the average stock continues performing well even considering today’s pullback. Last week, net new 52-week highs across the major stock exchanges hit the highest daily reading in over two years. As today shows, you shouldn’t expect the market to move in a straight line higher. But participation in the rally since October is much better than we’ve seen for quite some time. For this week, I’m removing DBX and YELP from the watchlist as both stocks break out and complete their pattern. That clears the way for a couple new additions this week.
Keep reading below for all the updates…
Long Trade Setups
THR
Broke out over $29 from an ascending triangle at the start of November. Now basing above that pattern and back testing support. Watching for the uptrend to resume with a move above $33.
NVDA
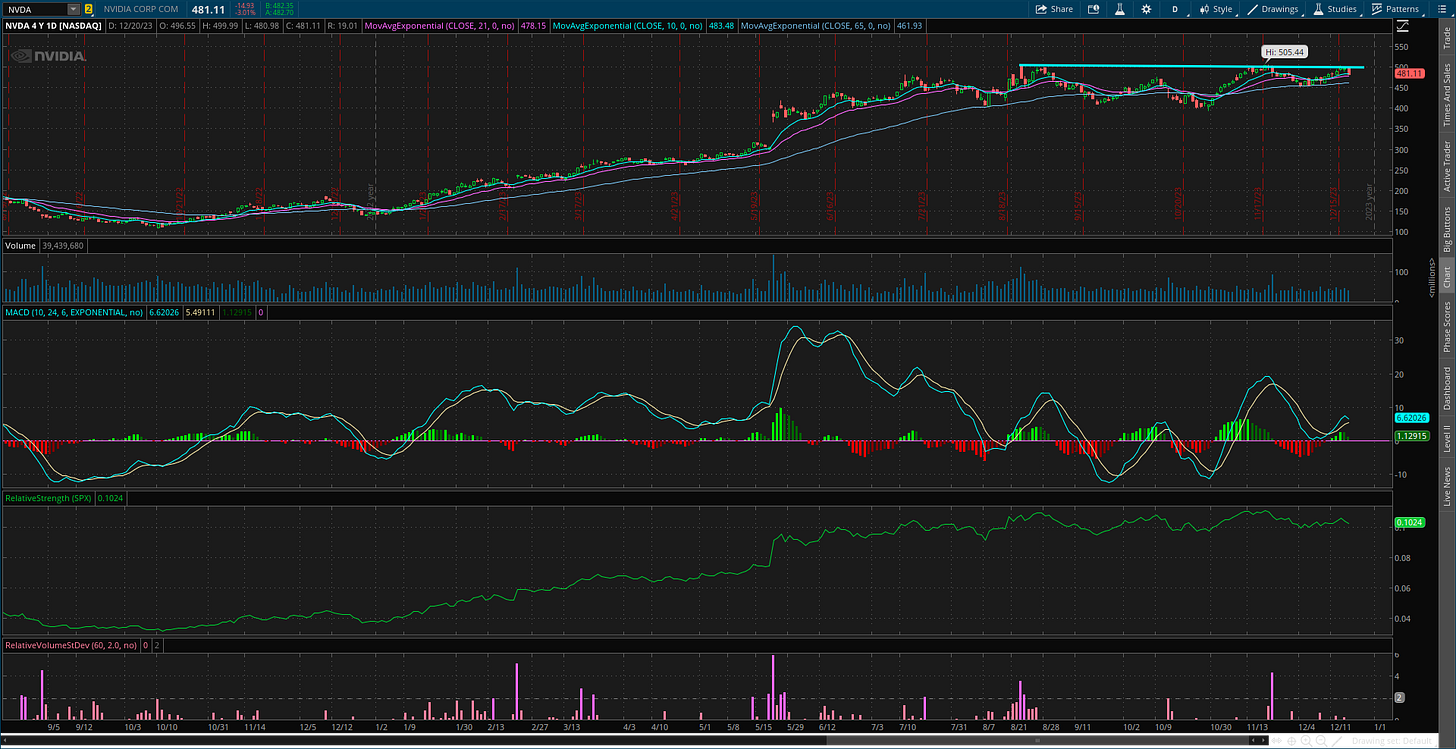
Daily chart creating a resistance level at $500 since August as it consolidates the prior move higher. Recent MACD reset at zero line now turning higher as the $500 level is being tested again.
RMBS
Recently testing resistance at the prior high around $70. MACD extended on that test, now a small retracement of the rally since October. That's resetting the MACD back at the zero line. Now watching for a breakout over $70 with the relative strength (RS) line at new highs.
URBN
Consolidating prior gains since August, forming a resistance level around $38. MACD recently turning up from the zero line and testing that level again. Expect a breakout to first target the prior highs at $40.
COCO
Trading in a basing pattern since mid-June, with a failed breakout attempt in September. Has traded in a similar range since then, with resistance around the $30 level. The MACD is weakening further, but will keep on watch as long as support around $25 holds.
SPSC
Consolidating after making a new all-time high back in July. Somewhat resembles a base-on-base pattern after testing the $150 breakout area. Price back near the highs, where I’m watching for a breakout over $195. A MACD reset at the zero line would help this pattern.
SYM
Big run over the past few weeks to test resistance around $60. Need to see momentum reset for another move, so ideally the stock trades sideways for a period to reset the MACD at the zero line. If that happens, I would look to buy a breakout to new highs confirmed by rising volume and the RS line at new highs.
MBLY
Made a quick move higher off support around $34. My ideal trade setup is price tests resistance around $45 then does a small retracement of the rally. Look for the MACD to reset at zero in that scenario, followed by an attempt to breakout over $45.
GES
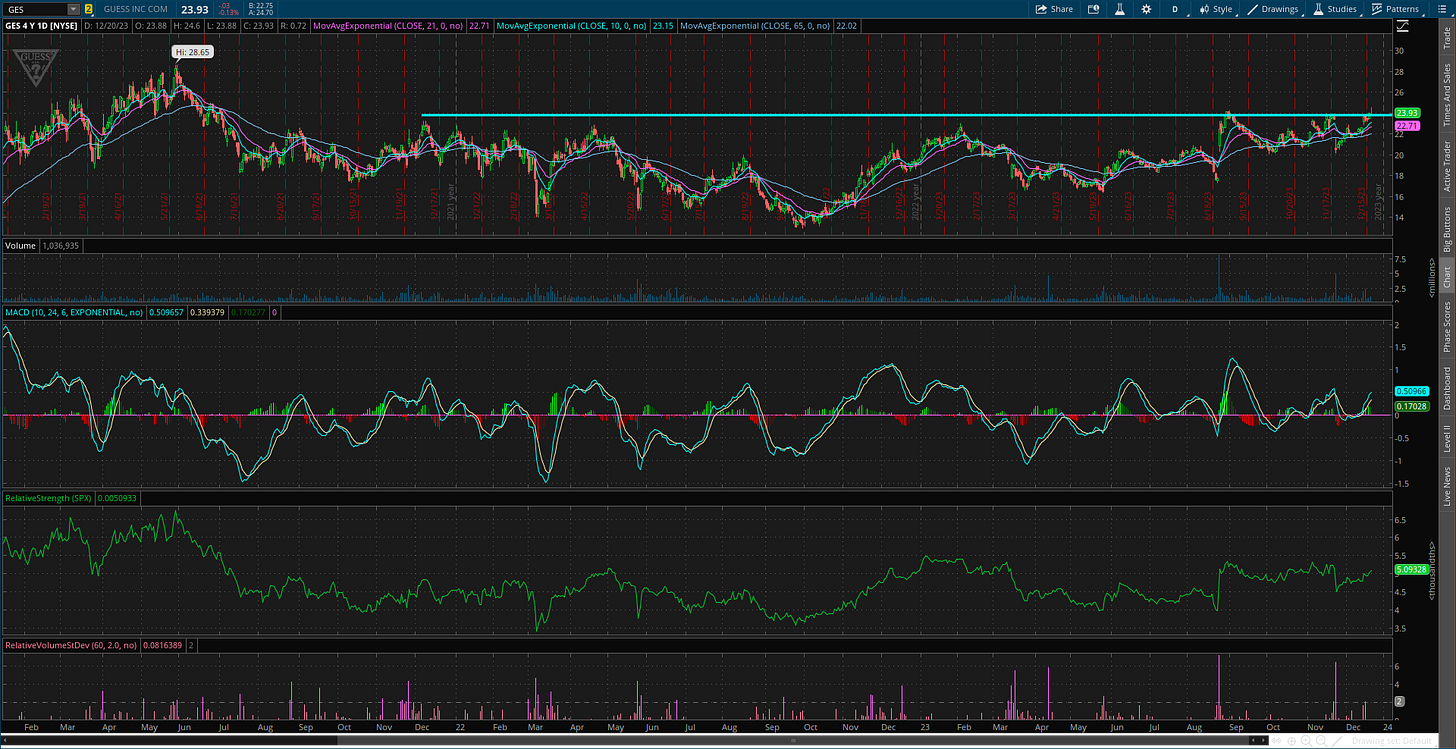
Pulled back after reporting earnings. Will keep on the watchlist for now as long as support at $20 holds. Still watching resistance at $24, which is a level tested several times going back to 2021. Series of higher lows since last October’s bottom. A breakout could target the prior high near $29.
URNM
Uranium stocks could be basing for another move higher. The URNM uranium ETF is pulling back this week after testing resistance again at $50. Now seeing another MACD reset which can help a breakout attempt.
Short Trade Setups
None this week!
Rules of the Game
I trade chart breakouts based on the daily chart for long positions. And for price triggers on long setups, I tend to wait until the last half hour of trading to add a position. I find that emotional money trades the open, and smart money trades the close. If it looks like a stock is breaking out, I don’t want a “head fake” in the morning followed by a pullback later in the day.
I also use the RS line as a breakout filter. I find this improves the quality of the price signal and helps prevent false breakouts. So if price is moving out of a chart pattern, I want to see the RS line (the green line in the bottom panel of my charts) at new 52-week highs. Conversely, I prefer an RS line making new 52-week lows for short setups.
Also for long positions, I use the 21-day exponential moving average (EMA) as a stop. If in the last half hour of trading it looks like a position will close under the 21-day EMA, I’m usually selling whether it’s to take a loss or book a profit.
For short (or put) positions, I trade off a four-hour chart instead of a daily. Why? There’s a saying that stocks go up on an escalator and down on an elevator. Once a profitable trade starts to become oversold on the four-hour MACD, I start to take gains. Nothing like a short-covering rally to see your gains evaporate quickly, so I’m more proactive taking profits on short positions. I also use a 21-period EMA on the four-hour chart as a stop. If there is a close above the 21-period EMA, I tend to cover my short.
For updated charts, market analysis, and other trade ideas, give me a follow on Twitter: @mosaicassetco
Disclaimer: these are not recommendations and just my thoughts and opinions…do your own due diligence! I may hold a position in the securities mentioned in this post.


Agreed. I’ve got butterflies for march targeting $400 that I’m hoping will start my 2024 with a bang