

In this post, I’ll focus on setups that I’m monitoring for both long and short positions. With a chart and short write-up, this is a quick way to scan and plan potential trades.
These ideas are the end result of my process to identify stocks offering the right combination of growth fundamentals along with a proper chart setup.
Stock Market Update
Investors continue to digest evidence of stagflation following a pair of economic reports last week. The Federal Reserve’s preferred inflation gauge with the PCE price index rose by 2.6% while the core figure sits at 2.8% in June compared to last year. Both measures are above the Fed’s 2% inflation target. Then came the July nonfarm payrolls report that missed estimates and saw massive downward revisions to May and June. That brought the three-month average payrolls growth to 35,000, which is the lowest since the pandemic.
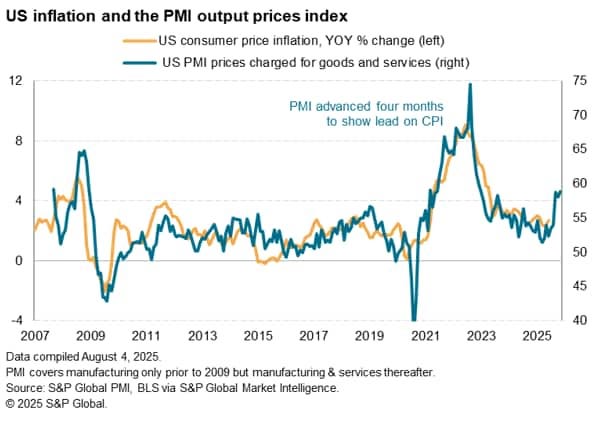
A widely followed report on manufacturing activity seems to confirm the stagflation scenario facing the economy. The ISM Manufacturing PMI showed another month of contracting activity in the manufacturing sector, with the July reading coming in at 48. The report is structured so that a reading below 50 indicates contraction and above 50 points to expansion. The new orders component, which is a leading indicator of activity, came in at 47.1 while the prices paid component came in at 64.8. Another PMI report from S&P Global has also seen a sharp rise in prices paid, which tends to be a leading indicator of inflation. The chart below shows the U.S. prices paid (blue line) from S&P Global moved ahead four months and overlaid with CPI consumer inflation (orange line).
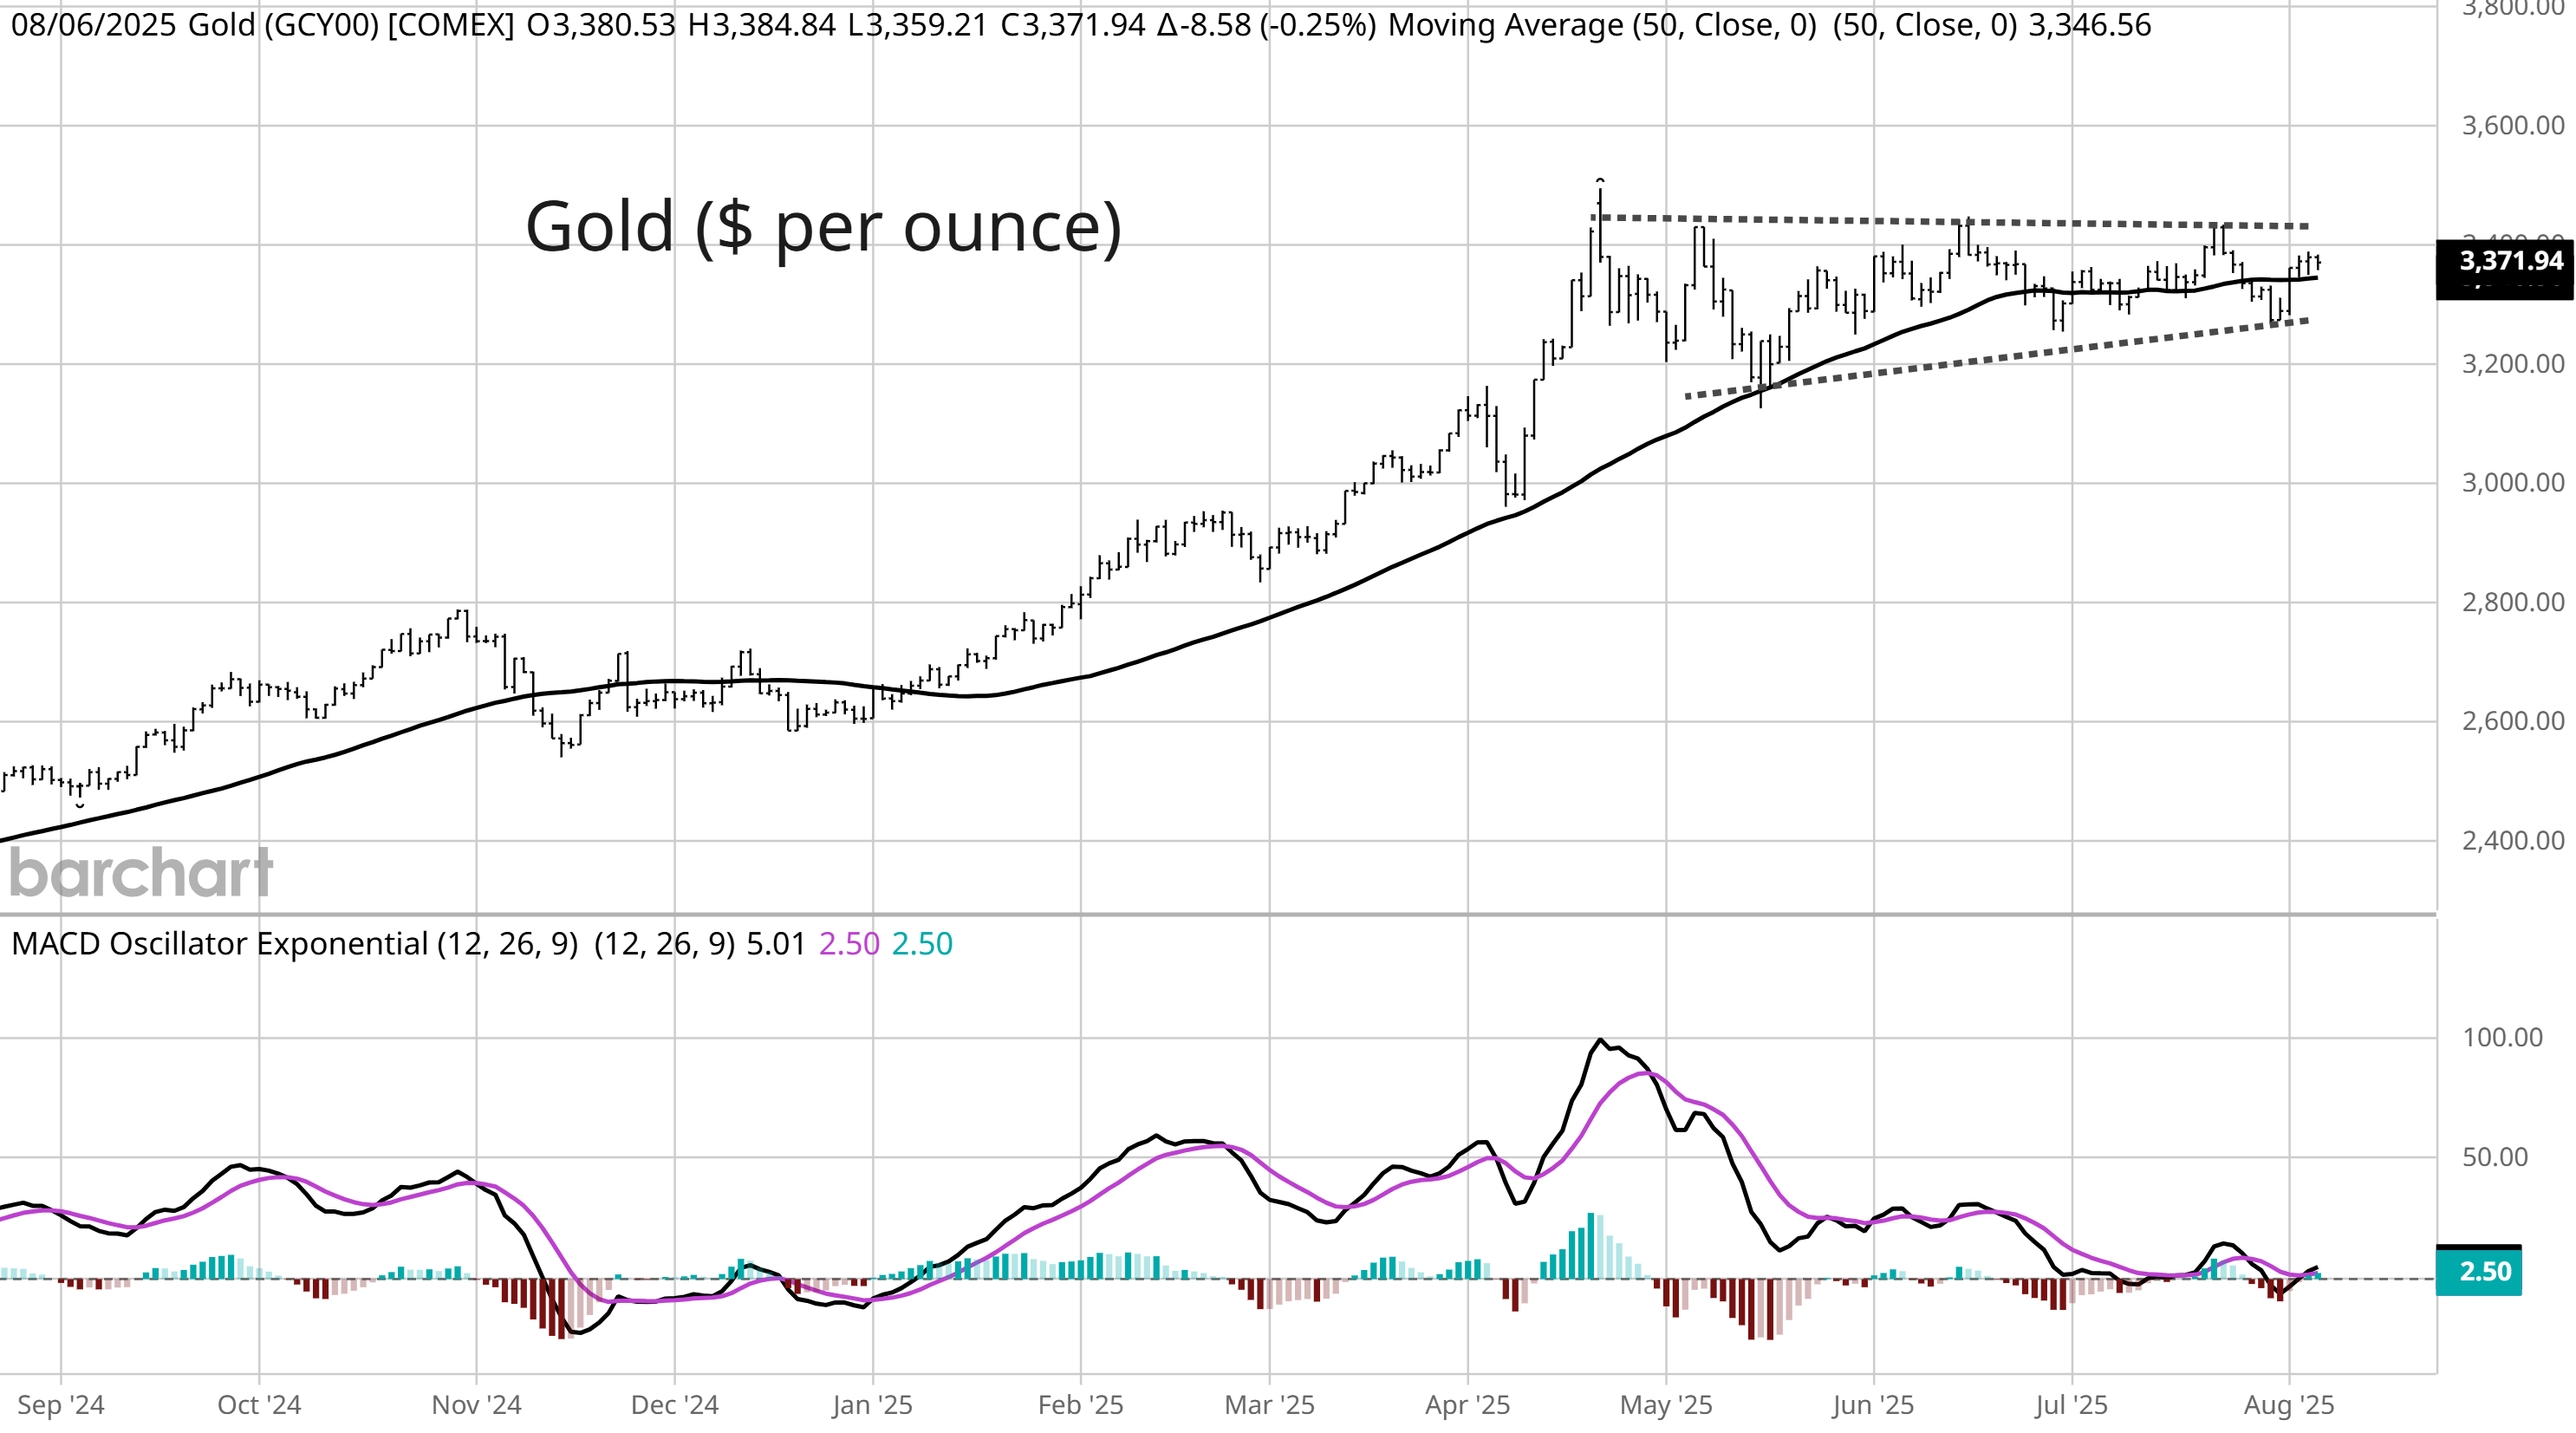
While leading indicators of inflation continue pointing to rising price levels ahead, indicators of economic activity are more mixed. S&P Global’s U.S. PMI has been reported above 50 for 30 consecutive months, aligning with overall economic expansion over that time. Their latest reading of 55.1 suggests that GDP growth is accelerating relative to the first half of the year, and is also the highest reading of 2025. And while it’s still early collecting data points for the estimate, the Atlanta Fed’s GDPNow model is pointing to 2.5% annualized growth for the third quarter. While the growth outlook is up for debate, there seems to be consensus on the prospect for rising inflation. That should help gold prices, which has one of the highest inflation betas around, to breakout from a consolidation extending back to April (chart below). After peaking near $3,500 per ounce, gold prices are trading in a range around the 50-day moving average (shown with the dashed trendlines) and is starting to coil tighter.
Although the S&P 500 only experienced a modest dip from the July peak following last week’s job data, I shared with Traders Hub members several signs that breadth was nearing oversold levels. At the same time, investor sentiment has mostly fallen back toward neutral territory. That shows conditions aren’t overly bullish or bearish at this point despite headlines swirling over the state of the economy. Keep reading to see:
Open ETF positions.
Open stock positions.
Chart analysis for new trade ideas.
